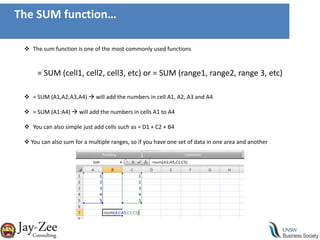
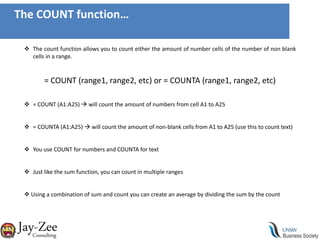
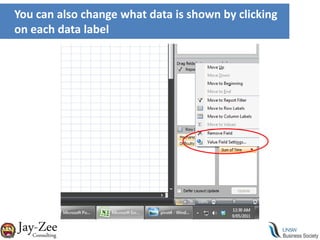
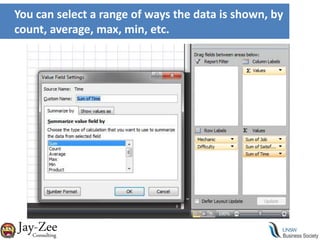
This ppt includes basic concepts about data types, levels of measurements. It also explains which descriptive measure, graph and tests should be used for different types of data. A brief of Pivot tables and charts is also included.
In this ppt the viewer will able to know about Epi Info- An Statistical Software. Epi Info is statistical software for epidemiology developed by Centers for Disease Control and Prevention (CDC) in Atlanta, Georgia (US). Epi Info has been in existence for over 20 years and is currently available for Microsoft Windows, Android and iOS, along with a web and cloud version. The program allows for electronic survey creation, data entry, and analysis. Within the analysis module, analytic routines include t-tests, ANOVA, nonparametric statistics, cross tabulations and stratification with estimates of odds ratios, risk ratios, and risk differences, logistic regression (conditional and unconditional), survival analysis (Kaplan Meier and Cox proportional hazard), and analysis of complex survey data.
Portion explained:
1. Epi Info Software
2. History of Epi Info Software
3. Features of Epi Info Software
4. Release history of Epi Info Software
Probability Sampling Method- Concept - Types Sundar B N
This ppt contains Probability Sampling Method- Concept - Types which also covers Types of Sampling
Simple Random Sampling
Systematic Sampling
Stratified Random Sampling
Cluster Sampling
Reasons for Sampling
and advantages and disadvantages of each methods
Please Subscribe to this Channel for more solutions and lectures
http://www.youtube.com/onlineteaching
Chapter 12: Analysis of Variance
12.2: Two-Way ANOVA
Box and whisker plot is a statistical measure to show the distribution of data. It is also called as Five Number Summary box as it consists of the median, the quartiles (lower and upper) and smallest and greatest values in distribution.
A Step-By-Step Introduction to SAS Report ProcedureYesAnalytics
The presentation of data is an essential part of every analytics project and there are number of tools within SAS that allows to create a large variety of charts, reports, and data summaries.
PROC REPORT is a particularly powerful and valuable procedure that can be used in this process. It can be used to both summarize and display data, and is highly customizable and highly flexible. It combines features of the PRINT, MEANS, and TABULATE procedures with features of the DATA step.
Here is a step by step introduction to Report Procedure which walks through the PROC REPORT statement and a few of its key options.
This presentation covers statistics, its importance, its applications, branches of statistics, basic concepts used in statistics, data sampling, types of sampling,types of data and collection of data.
Top 20 microsoft excel formulas you must knowAlexHenderson59
icrosoft Excel is one of the most popular data analysis tools in the world. A significant number of companies depend on MS Excel for calculation, analysis and visualization of data and information. Not many are taking full advantage of this simple yet powerful tool. We made a list of Top 20 Microsoft Excel Formulas you must know to become an Excel guru.
10 Excel Formulas that will help you in any JobHitesh Biyani
These are some basic and moderate excel formulas but are widely used in a corporate world be it any industry. A must read for freshers looking to seek a job with profiles in Banking, Insurance, BPO / KPO (Data support), etc
Want to learn more? Sign up to our course: http://bit.ly/excel2013course
This 4 step excel 2013 functions guide covers the fundamental aspects of using excel. It highlights and covers key components of excel for everyday usage and helps to enhance productivity with using excel.
STAT 3309SOS 3312 Excel AssignmentUsing the Excel file ST.docxdessiechisomjj4
STAT 3309/SOS 3312 Excel Assignment
Using the Excel file STAT Assignment Data in the Stat Assignment folder in Blackboard, you will see a list of
200 values in column A. You will want to sort the values in column A by choosing the Data tab at the top and
then sort the data in increasing order. These values were randomly generated from a Normal distribution with
a mean of 100 and a standard deviation of 20. You will also see the Descriptive Statistics from this data
starting in cell C1.
1) Using the mean and standard deviation from the Descriptive Statistics, calculate the interval in which about
68% of the data should lie according to the Empirical Rule.
2) From the sorted column A, find the percentage of data that actually lie in your interval calculated in 1) by
counting the number of values that fit in your interval and dividing by 200.
3) Using the mean and standard deviation from the Descriptive Statistics, calculate the interval in which about
95% of the data should lie according to the Empirical Rule.
4) From the sorted column A, find the percentage of data that actually lie (without rounding) in your interval
calculated in 3) by counting the number of values that fit in your interval and dividing by 200.
5) Using the mean and standard deviation from the Descriptive Statistics, calculate the interval in which about
99.7% of the data should lie according to the Empirical Rule.
6) From the sorted column A, find the percentage of data that actually lie (without rounding) in your interval
calculated in 5) by counting the number of values that fit in your interval and dividing by 200.
For the next part of the assignment, you will be generating the Descriptive Statistics for the fifteen values from
F1 to F15. You may also use a TI-84 to accomplish this task but I would suggest trying to use Excel. You will
need to see if the version of Excel you are using already has the Data Analysis toolpak already added in to
Excel. Click on the Data tab and look over to the right and see if Data Analysis is there like it is shown on this
version of Excel:
If you don’t see the Data Analysis then you will see instructions on the last page on how to add it to your Excel.
From Data Analysis, choose Descriptive Statistics:
Enter the following information and click OK:
7) Identify the sample mean from the output.
8) Identify the sample standard deviation from the output.
When studying confidence intervals for a t-distribution, we learned that it would require technology to
determine the critical value for values that were not already on a table of values. We will use the Excel
command TINV to calculate a critical value. The arguments for this command are =TINV(1 – CL, df). For
example, to calculate the t-value for a 96% confidence interval with n = 20, you would find an empty cell and
enter =TINV(1 - .96, 19)
9) Using n = 15 for the data in F1:F15, calculate the t-value for a 75% confidence interval.
10) Using the information from.
Executive Directors Chat Leveraging AI for Diversity, Equity, and InclusionTechSoup
Let’s explore the intersection of technology and equity in the final session of our DEI series. Discover how AI tools, like ChatGPT, can be used to support and enhance your nonprofit's DEI initiatives. Participants will gain insights into practical AI applications and get tips for leveraging technology to advance their DEI goals.
2024.06.01 Introducing a competency framework for languag learning materials ...Sandy Millin
http://sandymillin.wordpress.com/iateflwebinar2024
Published classroom materials form the basis of syllabuses, drive teacher professional development, and have a potentially huge influence on learners, teachers and education systems. All teachers also create their own materials, whether a few sentences on a blackboard, a highly-structured fully-realised online course, or anything in between. Despite this, the knowledge and skills needed to create effective language learning materials are rarely part of teacher training, and are mostly learnt by trial and error.
Knowledge and skills frameworks, generally called competency frameworks, for ELT teachers, trainers and managers have existed for a few years now. However, until I created one for my MA dissertation, there wasn’t one drawing together what we need to know and do to be able to effectively produce language learning materials.
This webinar will introduce you to my framework, highlighting the key competencies I identified from my research. It will also show how anybody involved in language teaching (any language, not just English!), teacher training, managing schools or developing language learning materials can benefit from using the framework.
Synthetic Fiber Construction in lab .pptxPavel ( NSTU)
Synthetic fiber production is a fascinating and complex field that blends chemistry, engineering, and environmental science. By understanding these aspects, students can gain a comprehensive view of synthetic fiber production, its impact on society and the environment, and the potential for future innovations. Synthetic fibers play a crucial role in modern society, impacting various aspects of daily life, industry, and the environment. ynthetic fibers are integral to modern life, offering a range of benefits from cost-effectiveness and versatility to innovative applications and performance characteristics. While they pose environmental challenges, ongoing research and development aim to create more sustainable and eco-friendly alternatives. Understanding the importance of synthetic fibers helps in appreciating their role in the economy, industry, and daily life, while also emphasizing the need for sustainable practices and innovation.
Operation “Blue Star” is the only event in the history of Independent India where the state went into war with its own people. Even after about 40 years it is not clear if it was culmination of states anger over people of the region, a political game of power or start of dictatorial chapter in the democratic setup.
The people of Punjab felt alienated from main stream due to denial of their just demands during a long democratic struggle since independence. As it happen all over the word, it led to militant struggle with great loss of lives of military, police and civilian personnel. Killing of Indira Gandhi and massacre of innocent Sikhs in Delhi and other India cities was also associated with this movement.
Read| The latest issue of The Challenger is here! We are thrilled to announce that our school paper has qualified for the NATIONAL SCHOOLS PRESS CONFERENCE (NSPC) 2024. Thank you for your unwavering support and trust. Dive into the stories that made us stand out!
Model Attribute Check Company Auto PropertyCeline George
In Odoo, the multi-company feature allows you to manage multiple companies within a single Odoo database instance. Each company can have its own configurations while still sharing common resources such as products, customers, and suppliers.
June 3, 2024 Anti-Semitism Letter Sent to MIT President Kornbluth and MIT Cor...Levi Shapiro
Letter from the Congress of the United States regarding Anti-Semitism sent June 3rd to MIT President Sally Kornbluth, MIT Corp Chair, Mark Gorenberg
Dear Dr. Kornbluth and Mr. Gorenberg,
The US House of Representatives is deeply concerned by ongoing and pervasive acts of antisemitic
harassment and intimidation at the Massachusetts Institute of Technology (MIT). Failing to act decisively to ensure a safe learning environment for all students would be a grave dereliction of your responsibilities as President of MIT and Chair of the MIT Corporation.
This Congress will not stand idly by and allow an environment hostile to Jewish students to persist. The House believes that your institution is in violation of Title VI of the Civil Rights Act, and the inability or
unwillingness to rectify this violation through action requires accountability.
Postsecondary education is a unique opportunity for students to learn and have their ideas and beliefs challenged. However, universities receiving hundreds of millions of federal funds annually have denied
students that opportunity and have been hijacked to become venues for the promotion of terrorism, antisemitic harassment and intimidation, unlawful encampments, and in some cases, assaults and riots.
The House of Representatives will not countenance the use of federal funds to indoctrinate students into hateful, antisemitic, anti-American supporters of terrorism. Investigations into campus antisemitism by the Committee on Education and the Workforce and the Committee on Ways and Means have been expanded into a Congress-wide probe across all relevant jurisdictions to address this national crisis. The undersigned Committees will conduct oversight into the use of federal funds at MIT and its learning environment under authorities granted to each Committee.
• The Committee on Education and the Workforce has been investigating your institution since December 7, 2023. The Committee has broad jurisdiction over postsecondary education, including its compliance with Title VI of the Civil Rights Act, campus safety concerns over disruptions to the learning environment, and the awarding of federal student aid under the Higher Education Act.
• The Committee on Oversight and Accountability is investigating the sources of funding and other support flowing to groups espousing pro-Hamas propaganda and engaged in antisemitic harassment and intimidation of students. The Committee on Oversight and Accountability is the principal oversight committee of the US House of Representatives and has broad authority to investigate “any matter” at “any time” under House Rule X.
• The Committee on Ways and Means has been investigating several universities since November 15, 2023, when the Committee held a hearing entitled From Ivory Towers to Dark Corners: Investigating the Nexus Between Antisemitism, Tax-Exempt Universities, and Terror Financing. The Committee followed the hearing with letters to those institutions on January 10, 202
Biological screening of herbal drugs: Introduction and Need for
Phyto-Pharmacological Screening, New Strategies for evaluating
Natural Products, In vitro evaluation techniques for Antioxidants, Antimicrobial and Anticancer drugs. In vivo evaluation techniques
for Anti-inflammatory, Antiulcer, Anticancer, Wound healing, Antidiabetic, Hepatoprotective, Cardio protective, Diuretics and
Antifertility, Toxicity studies as per OECD guidelines
A Strategic Approach: GenAI in EducationPeter Windle
Artificial Intelligence (AI) technologies such as Generative AI, Image Generators and Large Language Models have had a dramatic impact on teaching, learning and assessment over the past 18 months. The most immediate threat AI posed was to Academic Integrity with Higher Education Institutes (HEIs) focusing their efforts on combating the use of GenAI in assessment. Guidelines were developed for staff and students, policies put in place too. Innovative educators have forged paths in the use of Generative AI for teaching, learning and assessments leading to pockets of transformation springing up across HEIs, often with little or no top-down guidance, support or direction.
This Gasta posits a strategic approach to integrating AI into HEIs to prepare staff, students and the curriculum for an evolving world and workplace. We will highlight the advantages of working with these technologies beyond the realm of teaching, learning and assessment by considering prompt engineering skills, industry impact, curriculum changes, and the need for staff upskilling. In contrast, not engaging strategically with Generative AI poses risks, including falling behind peers, missed opportunities and failing to ensure our graduates remain employable. The rapid evolution of AI technologies necessitates a proactive and strategic approach if we are to remain relevant.
2. Why excel? Why should I care about excel? It helps with your university courses, especially if you’re doing finance where you’ll encounter it in 1613, 2624, Applied Corporate Finance, Options, Applied Corporate Finance etc. But I have an awesome friend who knows excel and will do it all for me! Well, that friend won’t be there forever, especially when you get an internship or a graduate job where knowing how to use excel will help you adapt quicker and give you a better chance at doing well. I don’t plan to work in commerce! Well then… WHAT ON EARTH ARE YOU DOING HERE?!?! Now that we have that sorted, please go to the link below to download the excel spreadsheet with exercises and data for practice. www.unswbsoc.com/media/Introduction to Excel - Application to Statistics.xlsx http://myendlesssoliloquy.files.wordpress.com/2011/05/introduction-to-excel-application-to-statistics1.xlsx
23. You can use multiple cells or ranges in the average function
24.
25.
26. You can also expand the logical test with functions like AND, OR and NOT
27. = IF (AND(A1>0.5,A1<0.75,”Come see me”, “”) Will check cell A1 and if the value is larger than 0.5, but less than 0.75. If so it will display “Come see me”, otherwise it will just be left blank.
28. You can also imbed multiple IF functions up to 13 in total. Usually people will embed the extra IF function into the value if false part of the function
29. = IF (A1>0.5, IF (A1<0.75, “Come see me”, ”Good”),””) Will do the same as above, but you should notice that this is the same as the function above, but if A1 is larger than 0.5 but not less than 0.75 (ie. Larger than 0.75) then it will display good instead of come see me
30.
31. You can use multiple criteria in a sumif by using the AND and/or OR functions
35. This is great when you just want a summary of the data
36. If you want to separate the statistics for the information, simply filter and sort the information into the sections you need and then simply perform statistical analysis on those individual sectionsSort Filter
37. First you need to turn on the add-in by clicking on the first and then excel options
38. Go to add-in and then choose excel add-ins then press go