Download to read offline


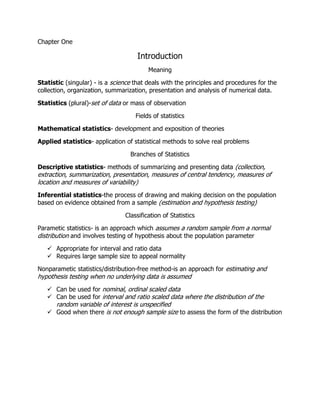
![Chapter Two
Sampling Techniques
Population [N]-totality of the individuals
Target population-entire set of individuals which we require info from
Sampled population-finite set of individuals from which sample is drawn
Coverage error-when the sampled population and the target population are not identical
Sample-representative portion of the population understudy
Principle of Randomization
“Four basic reasons for the use of samples”
1. It allows us to obtain information with greater speed
2. It allows us to obtain information with reduced cost
3. It allows us to obtain information over a greater scope
4. It allows us to obtain information with greater accuracy
Probability sampling and Non-probability Sampling
Probability sampling-uses random selection
Methods of Probability Sampling
1. Simple random sampling-choosing a sample from a set
Techniques in drawing SRS
a) Table of Random Numbers
b) Lottery of fishbowl technique
May be done in two ways
a) With replacement
b) Without replacement
Advantages
Simple and is more easily understood that other sampling designs
Disadvantages
List of all the members in the population is needed.
Assigning numbers to each member of the sampled population is
frequently impractical.
It may be difficult to collect the sample data with SRS if the samples
are spread inconveniently throughout the population.](https://image.slidesharecdn.com/statistics-140804040259-phpapp01/85/Statistics-5-320.jpg)
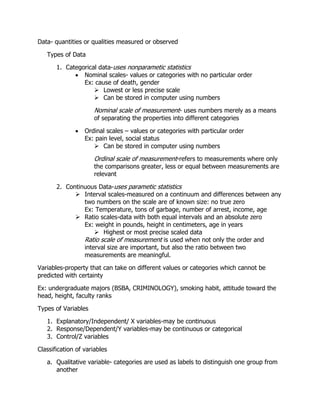
![ It is often less precise than other sampling plans because it disregards
any information already known about the population.
When to use
When the population is homogeneous with respect to the
characteristics understudy.
2. Systematic random sampling-selection of the desired sample in a list by
arranging them systematically
Formula: 𝑘 =
N
n
Where k=sampling interval
N=population size
n=sample size
Advantages:
Easier to apply and less likely to make mistakes.
It is possible to select a sample in the field without a sampling frame.
It could give more precise estimate than SRS when there is order in
the samples
Disadvantages:
If periodic regularities are found in the lists, a systematic sample may
consist only of similar types
If the population is not in random order, one cannot validly estimate
the variance of the mean from a single systematic sample
Could be less precise than SRS
When to use:
If the ordering of the population is essentially random
When stratification with numerous data is used
3. Stratified random sampling- population [N] is divided into a number
Advantages:
Gain in the precision of the estimates of characteristics of the
population
It allows for more comprehensive data analysis since information is
provided for each stratum
Accommodate administrative convenience, fieldwork is organized by
strata, which usually result in saving in cost](https://image.slidesharecdn.com/statistics-140804040259-phpapp01/85/Statistics-6-320.jpg)

This document provides an overview of statistics, including key concepts and terminology. It discusses the fields and branches of statistics, types of data and variables, sampling techniques, and descriptive statistics. Specifically, it defines statistics as dealing with numerical data collection, organization, analysis and presentation. It also outlines common probability and non-probability sampling methods, such as simple random sampling, stratified sampling, and convenience sampling. Finally, it discusses descriptive statistics and measures of central tendency and dispersion.


![BASIC CONCEPTS in STAT 1 [Autosaved].pptx](https://cdn.slidesharecdn.com/ss_thumbnails/basicconceptsinstat1autosaved-221027115944-55c11ebb-thumbnail.jpg?width=640&height=640&fit=bounds)


