Downloaded 306 times
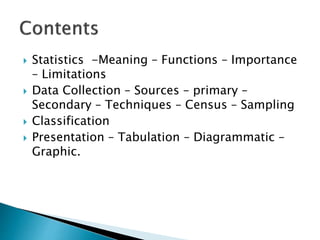


This document provides an overview of statistics as a field of study. It discusses the meaning and importance of statistics, as well as data collection methods like census and sampling. Classification, tabulation, and diagrammatic/graphic presentation of data are also covered. The document outlines key statistical concepts like estimation, hypothesis testing, and applications of statistics in various disciplines like industry, commerce, agriculture and more. Common statistical techniques like correlation, regression, probability distributions, and statistical quality control are also mentioned.