Download to read offline
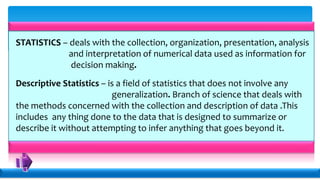


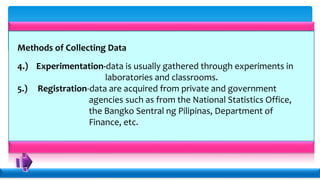
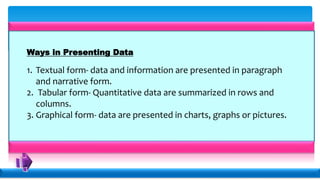
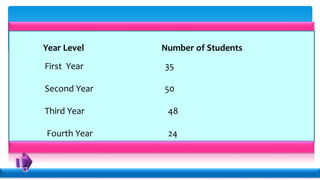
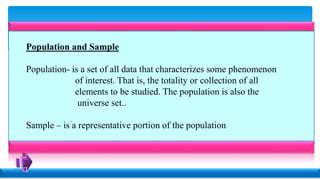
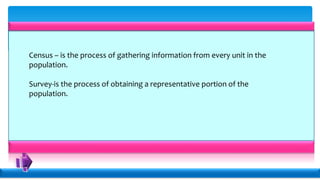
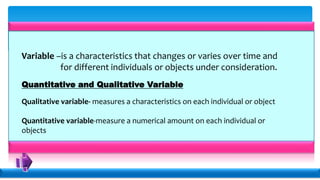
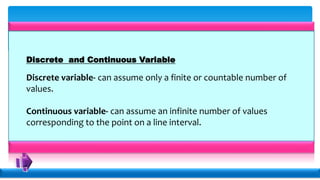
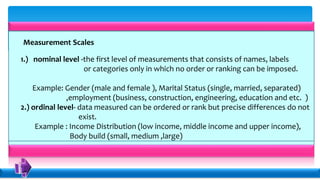
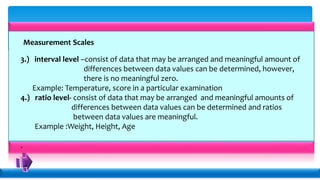
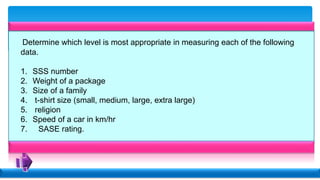
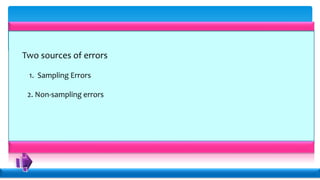
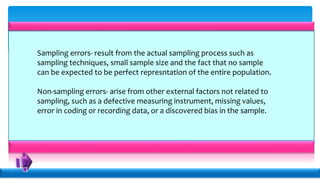

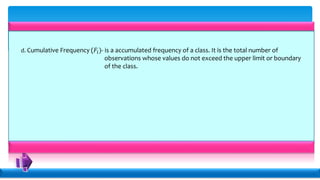


Statistics deals with the collection, organization, presentation, analysis, and interpretation of numerical data. Descriptive statistics summarize and describe data without generalizing, while inferential statistics makes generalizations using data. There are various methods for collecting data, including direct interviews, indirect questionnaires, observation, experimentation, and registration. Data can be presented textually, in tables, or graphically. Population is the total set of data, while a sample is a subset. A census collects all data while a survey uses a sample. Variables can be quantitative or qualitative, discrete or continuous. Measurement scales include nominal, ordinal, interval, and ratio levels. Sources of error include sampling errors from the sampling process and non-sampling errors from other factors.


![BASIC CONCEPTS in STAT 1 [Autosaved].pptx](https://cdn.slidesharecdn.com/ss_thumbnails/basicconceptsinstat1autosaved-221027115944-55c11ebb-thumbnail.jpg?width=640&height=640&fit=bounds)


![Principlles of statistics [amar mamusta amir]](https://cdn.slidesharecdn.com/ss_thumbnails/principllesofstatistics-190317152518-thumbnail.jpg?width=640&height=640&fit=bounds)