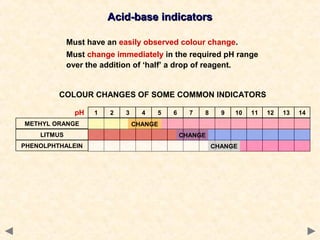
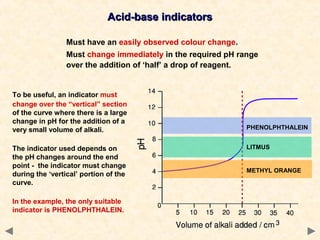
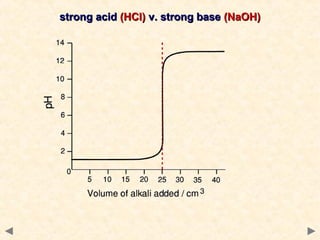
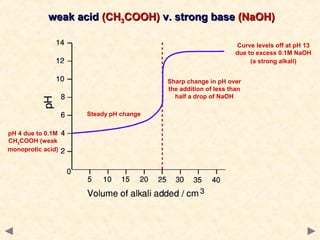
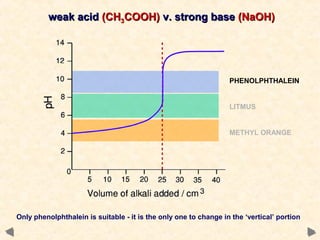
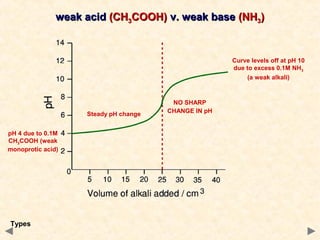
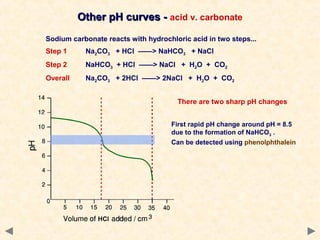
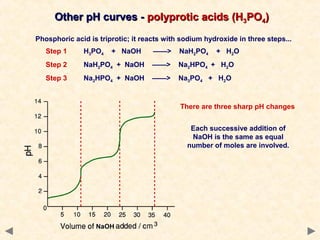
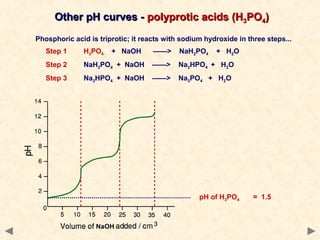
- Many acid-base indicators are weak acids that partially dissociate in solution, existing in both ionized and un-ionized forms which have different colors. In acidic solution, the equilibrium favors the un-ionized form which is typically red. In alkaline solution, the equilibrium favors the ionized blue form.
- Titration curves show characteristic shapes depending on whether the acid and base are strong or weak. A strong acid-strong base titration has an initial flat region followed by a sharp pH change at the equivalence point. A weak acid-strong base titration has a gradual pH change throughout.
- The suitable indicator for a titration must change color within the sharp pH change region near the
12 Conversion Rate Optimization Strategies for Ecommerce Websites.pdf
ย
Indicators
1. Indicators
CONTENTS
โข Acid-base indicators - theory
โข Titration curves - introduction
โข Titration curve; strong acid - strong base
โข Titration curve; strong acid - weak base
โข Titration curve; weak acid - strong base
โข Titration curve; weak acid - weak base
โข Titration curve; acid - carbonate
โข Titration curve; phosphoric acid
โข Check list
2. Acid-base indicators
General
Many indicators are weak acids and partially dissociate in aqueous solution
HIn(aq)
H+(aq) + Inยฏ(aq)
The un-ionised form (HIn) is a different colour to the anionic form (Inยฏ).
3. Acid-base indicators
General
Many indicators are weak acids and partially dissociate in aqueous solution
HIn(aq)
H+(aq) + Inยฏ(aq)
The un-ionised form (HIn) is a different colour to the anionic form (Inยฏ).
Apply Le Chatelierโs Principle to predict any colour change
In acid
- increase of [H+]
- equilibrium moves to the left to give red undissociated form
In alkali - increase of [OHยฏ]
- OHยฏ ions remove H+ ions to form water;
H+(aq) + OHยฏ(aq)
- equilibrium will move to the right to produce a blue colour
H2O(l)
4. Acid-base indicators
General
Many indicators are weak acids and partially dissociate in aqueous solution
HIn(aq)
H+(aq) + Inยฏ(aq)
The un-ionised form (HIn) is a different colour to the anionic form (Inยฏ).
Apply Le Chatelierโs Principle to predict any colour change
In acid
- increase of [H+]
- equilibrium moves to the left to give red undissociated form
In alkali - increase of [OHยฏ]
- OHยฏ ions remove H+ ions to form water;
H+(aq) + OHยฏ(aq)
- equilibrium will move to the right to produce a blue colour
Summary
In acidic solution
HIn(aq)
H+(aq) + Inยฏ(aq)
In alkaline solution
H2O(l)
5. Acid-base indicators
Must have an easily observed colour change.
Must change immediately in the required pH range
over the addition of โhalfโ a drop of reagent.
COLOUR CHANGES OF SOME COMMON INDICATORS
pH
METHYL ORANGE
LITMUS
PHENOLPHTHALEIN
1
2
3
4
5
6
7
8
9
10
CHANGE
CHANGE
CHANGE
11
12
13
14
6. Acid-base indicators
Must have an easily observed colour change.
Must change immediately in the required pH range
over the addition of โhalfโ a drop of reagent.
To be useful, an indicator must
change over the โverticalโ section
of the curve where there is a large
change in pH for the addition of a
very small volume of alkali.
The indicator used depends on
the pH changes around the end
point - the indicator must change
during the โverticalโ portion of the
curve.
In the example, the only suitable
indicator is PHENOLPHTHALEIN.
PHENOLPHTHALEIN
LITMUS
METHYL ORANGE
7. pH curves
Types
There are four types of acid-base titration; each has a characteristic curve.
strong acid (HCl) v. strong base (NaOH)
weak acid (CH3COOH) v. strong alkali (NaOH)
strong acid (HCl) v. weak base (NH3)
weak acid (CH3COOH) v. weak base (NH3)
In the following examples, alkali (0.1M) is added to 25cm3 of acid (0.1M)
End points need not be โneutralโ due to the phenomenon of salt hydrolysis
9. strong acid (HCl) v. strong base (NaOH)
pH 1 at the start
due to 0.1M HCl
(strong
monoprotic acid)
10. strong acid (HCl) v. strong base (NaOH)
Very little pH change
during the initial 20cm3
pH 1 at the start
due to 0.1M HCl
(strong
monoprotic acid)
11. strong acid (HCl) v. strong base (NaOH)
Very sharp change in pH
over the addition of less
than half a drop of
NaOH
Very little pH change
during the initial 20cm3
pH 1 at the start
due to 0.1M HCl
(strong
monoprotic acid)
12. strong acid (HCl) v. strong base (NaOH)
Curve levels off at pH 13
due to excess 0.1M NaOH
(a strong alkali)
Very sharp change in pH
over the addition of less
than half a drop of
NaOH
Very little pH change
during the initial 20cm3
pH 1 at the start
due to 0.1M HCl
(strong
monoprotic acid)
13. strong acid (HCl) v. strong base (NaOH)
PHENOLPHTHALEIN
LITMUS
METHYL ORANGE
Any of the indicators listed will be suitable - they all change in the โverticalโ portion
14. strong acid (HCl) v. weak base (NH3)
Curve levels off at pH 10
due to excess 0.1M NH3
(a weak alkali)
Sharp change in pH over
the addition of less than
half a drop of NH3
pH 1 at the start
due to 0.1M HCl
Very little pH change
during the initial 20cm3
15. strong acid (HCl) v. weak base (NH3)
PHENOLPHTHALEIN
LITMUS
METHYL ORANGE
Only methyl orange is suitable - it is the only one to change in the โverticalโ portion
16. weak acid (CH3COOH) v. strong base (NaOH)
Curve levels off at pH 13
due to excess 0.1M NaOH
(a strong alkali)
Sharp change in pH over
the addition of less than
half a drop of NaOH
Steady pH change
pH 4 due to 0.1M
CH3COOH (weak
monoprotic acid)
17. weak acid (CH3COOH) v. strong base (NaOH)
PHENOLPHTHALEIN
LITMUS
METHYL ORANGE
Only phenolphthalein is suitable - it is the only one to change in the โverticalโ portion
18. weak acid (CH3COOH) v. weak base (NH3)
Curve levels off at pH 10
due to excess 0.1M NH3
(a weak alkali)
Steady pH change
pH 4 due to 0.1M
CH3COOH (weak
monoprotic acid)
Types
NO SHARP
CHANGE IN pH
19. weak acid (CH3COOH) v. weak base (NH3)
PHENOLPHTHALEIN
LITMUS
METHYL ORANGE
NOTHING SUITABLE
There is no suitable indicator- none change in the โverticalโ portion.
The end point can be detected by plotting a curve using a pH meter.
20. Other pH curves - acid v. carbonate
Sodium carbonate reacts with hydrochloric acid in two steps...
Step 1
Na2CO3 + HCl โโ> NaHCO3 + NaCl
Step 2
NaHCO3 + HCl โโ> NaCl + H2O + CO2
Overall
Na2CO3 + 2HCl โโ> 2NaCl + H2O + CO2
21. Other pH curves - acid v. carbonate
Sodium carbonate reacts with hydrochloric acid in two steps...
Step 1
Na2CO3 + HCl โโ> NaHCO3 + NaCl
Step 2
NaHCO3 + HCl โโ> NaCl + H2O + CO2
Overall
Na2CO3 + 2HCl โโ> 2NaCl + H2O + CO2
There are two sharp pH changes
The second addition of HCl is exactly
the same as the first because the
number of moles of HCl which react
with the NaHCO3 is the same as that
reacting with the Na2CO3.
17.50cm3
35.00cm3
22. Other pH curves - acid v. carbonate
Sodium carbonate reacts with hydrochloric acid in two steps...
Step 1
Na2CO3 + HCl โโ> NaHCO3 + NaCl
Step 2
NaHCO3 + HCl โโ> NaCl + H2O + CO2
Overall
Na2CO3 + 2HCl โโ> 2NaCl + H2O + CO2
There are two sharp pH changes
First rapid pH change around pH = 8.5
due to the formation of NaHCO3 .
Can be detected using phenolphthalein
23. Other pH curves - acid v. carbonate
Sodium carbonate reacts with hydrochloric acid in two steps...
Step 1
Na2CO3 + HCl โโ> NaHCO3 + NaCl
Step 2
NaHCO3 + HCl โโ> NaCl + H2O + CO2
Overall
Na2CO3 + 2HCl โโ> 2NaCl + H2O + CO2
There are two sharp pH changes
First rapid pH change around pH = 8.5
due to the formation of NaHCO3 .
Can be detected using phenolphthalein
Second rapid pH change around pH = 4
due to the formation of acidic CO2 .
Can be detected using methyl orange.
24. Other pH curves - polyprotic acids (H3PO4)
Phosphoric acid is triprotic; it reacts with sodium hydroxide in three steps...
Step 1
H3PO4
Step 2
Step 3
+ NaOH
โโ>
NaH2PO4
+ H2O
NaH2PO4 + NaOH
โโ>
Na2HPO4 + H2O
Na2HPO4 + NaOH
โโ>
Na3PO4 + H2O
25. Other pH curves - polyprotic acids (H3PO4)
Phosphoric acid is triprotic; it reacts with sodium hydroxide in three steps...
Step 1
H3PO4
Step 2
Step 3
+ NaOH
โโ>
NaH2PO4
+ H2O
NaH2PO4 + NaOH
โโ>
Na2HPO4 + H2O
Na2HPO4 + NaOH
โโ>
Na3PO4 + H2O
There are three sharp pH changes
Each successive addition of
NaOH is the same as equal
number of moles are involved.
26. Other pH curves - polyprotic acids (H3PO4)
Phosphoric acid is triprotic; it reacts with sodium hydroxide in three steps...
Step 1
H3PO4
Step 2
Step 3
+ NaOH
โโ>
NaH2PO4
+ H2O
NaH2PO4 + NaOH
โโ>
Na2HPO4 + H2O
Na2HPO4 + NaOH
โโ>
Na3PO4 + H2O
pH of H3PO4
= 1.5
27. Other pH curves - polyprotic acids (H3PO4)
Phosphoric acid is triprotic; it reacts with sodium hydroxide in three steps...
Step 1
H3PO4
Step 2
Step 3
+ NaOH
โโ>
NaH2PO4
+ H2O
NaH2PO4 + NaOH
โโ>
Na2HPO4 + H2O
Na2HPO4 + NaOH
โโ>
Na3PO4 + H2O
pH of NaH2PO4 = 4.4
pH of H3PO4
= 1.5
28. Other pH curves - polyprotic acids (H3PO4)
Phosphoric acid is triprotic; it reacts with sodium hydroxide in three steps...
Step 1
H3PO4
Step 2
Step 3
+ NaOH
โโ>
NaH2PO4
+ H2O
NaH2PO4 + NaOH
โโ>
Na2HPO4 + H2O
Na2HPO4 + NaOH
โโ>
Na3PO4 + H2O
pH of Na2HPO4 = 9.6
pH of NaH2PO4 = 4.4
pH of H3PO4
= 1.5
29. Other pH curves - polyprotic acids (H3PO4)
Phosphoric acid is triprotic; it reacts with sodium hydroxide in three steps...
Step 1
H3PO4
Step 2
Step 3
+ NaOH
โโ>
NaH2PO4
+ H2O
NaH2PO4 + NaOH
โโ>
Na2HPO4 + H2O
Na2HPO4 + NaOH
โโ>
Na3PO4 + H2O
pH of Na3PO4
= 12
pH of Na2HPO4 = 9.6
pH of NaH2PO4 = 4.4
pH of H3PO4
= 1.5
30. REVISION CHECK
What should you be able to do?
Recall the definition of a weak acid
Understand why indicators can be made from weak acids
Understand why indicators must change colour quickly over a small pH range
Recall and explain the shape of titration curves involving acids and bases
Explain why particular indicators are used for certain titrations
Explain the shape of the titration curve for phosphoric acid
Explain the shape of the titration curve for acid -sodium carbonate reactions
CAN YOU DO ALL OF THESE?
YES
NO
31. You need to go over the
relevant topic(s) again
Click on the button to
return to the menu