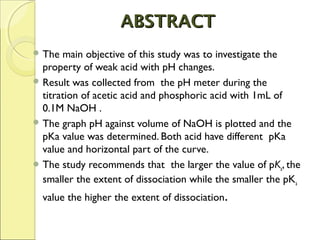
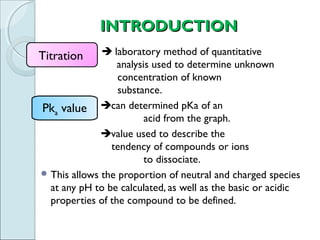
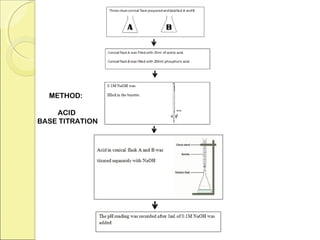
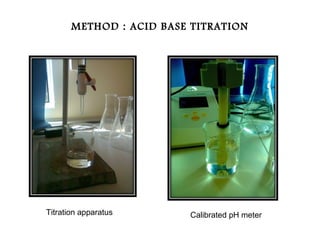
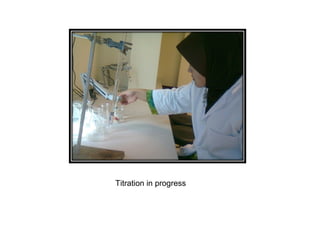
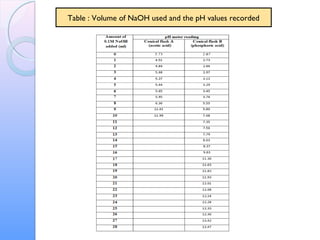
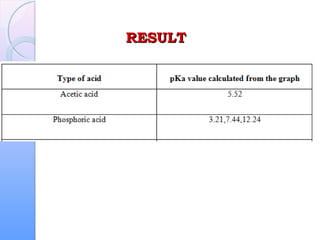
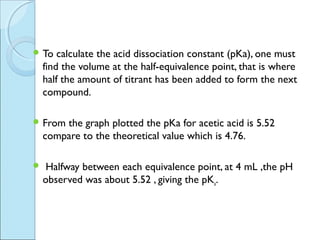
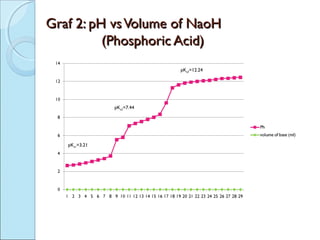
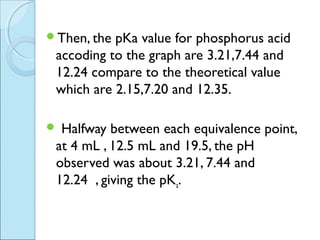
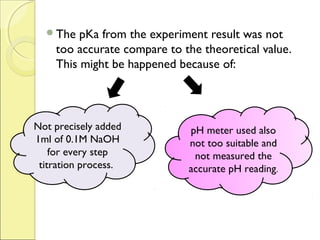
ACid-BAse TiTrATion reporT


         USER NAME :   TBC 3013


                       *********
         PASSWORD :


                           ENTER
                            ENTER


LECTURER : DR ROSMILA MISNAN
GROUP MEMBERS

            NAME                  MATRIC NO.


    UMI ABIBAH BT SULAIMAN         D20091034811


 SITI RAHAYU BT MOHAMED NOOR       D20091034855


                                   D20091034872
NUR AFIQAH BINTI MUHAMAD APANDI


                                   D20091034814
       AMEERA BT YAHYA
ABSTRACT
 The  main objective of this study was to investigate the
  property of weak acid with pH changes.
 Result was collected from the pH meter during the
  titration of acetic acid and phosphoric acid with 1mL of
  0.1M NaOH .
 The graph pH against volume of NaOH is plotted and the
  pKa value was determined. Both acid have different pKa
  value and horizontal part of the curve.
 The study recommends that the larger the value of pKa, the
  smaller the extent of dissociation while the smaller the pKa
  value the higher the extent of dissociation.
INTRODUCTION

Titration      laboratory method of quantitative
                  analysis used to determine unknown
                  concentration of known
                  substance.
Pka value can determined pKa of an
                         acid from the graph.
              value used to describe the
                tendency of compounds or ions
                         to dissociate.
 This allows the proportion of neutral and charged species
  at any pH to be calculated, as well as the basic or acidic
  properties of the compound to be defined.
METHOD:

    ACID
BASE TITRATION
METHOD : ACID BASE TITRATION


Titration apparatus      Calibrated pH meter
Titration in progress
Table : Volume of NaOH used and the pH values recorded
RESULT
Graf 1: pH vs Volume of NaoH
            (Acetic Acid)


        pKa1=5.52
 To    calculate the acid dissociation constant (pKa), one must
    find the volume at the half-equivalence point, that is where
    half the amount of titrant has been added to form the next
    compound.

 From  the graph plotted the pKa for acetic acid is 5.52
    compare to the theoretical value which is 4.76.

    Halfway between each equivalence point, at 4 mL ,the pH
    observed was about 5.52 , giving the pKa.
Graf 2: pH vs Volume of NaoH
          (Phosphoric Acid)
                            pKa3=12.24


                pKa2=7.44


   pKa1=3.21
Then, the pKa value for phosphorus acid
 accoding to the graph are 3.21,7.44 and
 12.24 compare to the theoretical value
 which are 2.15,7.20 and 12.35.

 Halfway between each equivalence point,
 at 4 mL , 12.5 mL and 19.5, the pH
 observed was about 3.21, 7.44 and
 12.24 , giving the pKa.
The   pKa from the experiment result was not
    too accurate compare to the theoretical value.
    This might be happened because of:


Not precisely added          pH meter used also
1ml of 0.1M NaOH             not too suitable and
    for every step            not measured the
 titration process.          accurate pH reading.
The  pKa of an acid can be determined from the
 part of the graph having flat or more horizontal
 part of the curve.

The  larger the value of pKa, the smaller the extent
 of dissociation while the smaller the pKa value
 the higher the extent of dissociation.
For   acetic acid  one horizontal part on the
                      curve
For phosphoric acid three horizontal parts


The   difference arise


     Due to acids having one or more than one
  dissociation constant in order for all the H+ ions
   can react completely with the OH- ions being
         added during the titration process.
CONCLUSION

As   a conclusion,
able to identidy the pKa of an acid by
 using titration.
 learn how to use pH meter correctly.
REFERENCES
 https://docs.google.com/viewer?
  a=v&q=cache:hWqGYixWkLsJ:www2.chem.ubc.ca/courseware/330/pKa.pd
  f+&hl=en&gl=my&pid=bl&srcid=ADGEESi0c85vsFbBU4uwyfTNi2oMOBB8
  prpi05jtfiPOheSrjLORUpXTvhvoLAAALjoQweS1utzrEGWeJkbUGBuwsix
  CBSHf3ULXuzjHyDGhG4MAQNjL86hdoGlCTWzD0Hc6v12ZMAI0&sig=
  AHIEtbTBuPkVBPk4IcMmhHj7n0u1hNGnXw
 https://docs.google.com/viewer?
  a=v&q=cache:oOMX3c6_bfoJ:www.deltacollege.edu/emp/ckim/Labs_PDF/
  AcidBaseTitrationCurveLab.pdf+&hl=en&gl=my&pid=bl&srcid=ADGEESjl3
  hlEXLOO2UI_DXZGy35s8xAPURLrBVvoCgc7WH8O1lWP4yTZuSvdNh
  oEgwdMKoVoXJsSIFhktON_PWOttJPKukddWLfQGe7UChJESb0bPka_sP
  mk81gIvaAQE8o7lrIa1CAl&sig=AHIEtbRprjL5NExSdDjM_UtF5F-LJ4hdvQ
THANK YOU!!!!

Lab acid titrate

  • 1.
    ACid-BAse TiTrATion reporT USER NAME : TBC 3013 ********* PASSWORD : ENTER ENTER LECTURER : DR ROSMILA MISNAN
  • 2.
    GROUP MEMBERS NAME MATRIC NO. UMI ABIBAH BT SULAIMAN D20091034811 SITI RAHAYU BT MOHAMED NOOR D20091034855 D20091034872 NUR AFIQAH BINTI MUHAMAD APANDI D20091034814 AMEERA BT YAHYA
  • 3.
    ABSTRACT  The main objective of this study was to investigate the property of weak acid with pH changes.  Result was collected from the pH meter during the titration of acetic acid and phosphoric acid with 1mL of 0.1M NaOH .  The graph pH against volume of NaOH is plotted and the pKa value was determined. Both acid have different pKa value and horizontal part of the curve.  The study recommends that the larger the value of pKa, the smaller the extent of dissociation while the smaller the pKa value the higher the extent of dissociation.
  • 4.
    INTRODUCTION  Titration  laboratory method of quantitative analysis used to determine unknown concentration of known substance. Pka value can determined pKa of an acid from the graph. value used to describe the tendency of compounds or ions to dissociate.  This allows the proportion of neutral and charged species at any pH to be calculated, as well as the basic or acidic properties of the compound to be defined.
  • 5.
    METHOD: ACID BASE TITRATION
  • 6.
    METHOD : ACIDBASE TITRATION Titration apparatus Calibrated pH meter
  • 7.
  • 8.
    Table : Volumeof NaOH used and the pH values recorded
  • 9.
  • 10.
    Graf 1: pH vsVolume of NaoH (Acetic Acid) pKa1=5.52
  • 11.
     To calculate the acid dissociation constant (pKa), one must find the volume at the half-equivalence point, that is where half the amount of titrant has been added to form the next compound.  From the graph plotted the pKa for acetic acid is 5.52 compare to the theoretical value which is 4.76.  Halfway between each equivalence point, at 4 mL ,the pH observed was about 5.52 , giving the pKa.
  • 12.
    Graf 2: pH vsVolume of NaoH (Phosphoric Acid) pKa3=12.24  pKa2=7.44 pKa1=3.21
  • 13.
    Then, the pKavalue for phosphorus acid accoding to the graph are 3.21,7.44 and 12.24 compare to the theoretical value which are 2.15,7.20 and 12.35.  Halfway between each equivalence point, at 4 mL , 12.5 mL and 19.5, the pH observed was about 3.21, 7.44 and 12.24 , giving the pKa.
  • 14.
    The pKa from the experiment result was not too accurate compare to the theoretical value. This might be happened because of: Not precisely added pH meter used also 1ml of 0.1M NaOH not too suitable and for every step not measured the titration process. accurate pH reading.
  • 15.
    The pKaof an acid can be determined from the part of the graph having flat or more horizontal part of the curve. The larger the value of pKa, the smaller the extent of dissociation while the smaller the pKa value the higher the extent of dissociation.
  • 16.
    For acetic acid one horizontal part on the curve For phosphoric acid three horizontal parts The difference arise Due to acids having one or more than one dissociation constant in order for all the H+ ions can react completely with the OH- ions being added during the titration process.
  • 17.
    CONCLUSION As a conclusion, able to identidy the pKa of an acid by using titration.  learn how to use pH meter correctly.
  • 18.
    REFERENCES  https://docs.google.com/viewer? a=v&q=cache:hWqGYixWkLsJ:www2.chem.ubc.ca/courseware/330/pKa.pd f+&hl=en&gl=my&pid=bl&srcid=ADGEESi0c85vsFbBU4uwyfTNi2oMOBB8 prpi05jtfiPOheSrjLORUpXTvhvoLAAALjoQweS1utzrEGWeJkbUGBuwsix CBSHf3ULXuzjHyDGhG4MAQNjL86hdoGlCTWzD0Hc6v12ZMAI0&sig= AHIEtbTBuPkVBPk4IcMmhHj7n0u1hNGnXw  https://docs.google.com/viewer? a=v&q=cache:oOMX3c6_bfoJ:www.deltacollege.edu/emp/ckim/Labs_PDF/ AcidBaseTitrationCurveLab.pdf+&hl=en&gl=my&pid=bl&srcid=ADGEESjl3 hlEXLOO2UI_DXZGy35s8xAPURLrBVvoCgc7WH8O1lWP4yTZuSvdNh oEgwdMKoVoXJsSIFhktON_PWOttJPKukddWLfQGe7UChJESb0bPka_sP mk81gIvaAQE8o7lrIa1CAl&sig=AHIEtbRprjL5NExSdDjM_UtF5F-LJ4hdvQ
  • 19.