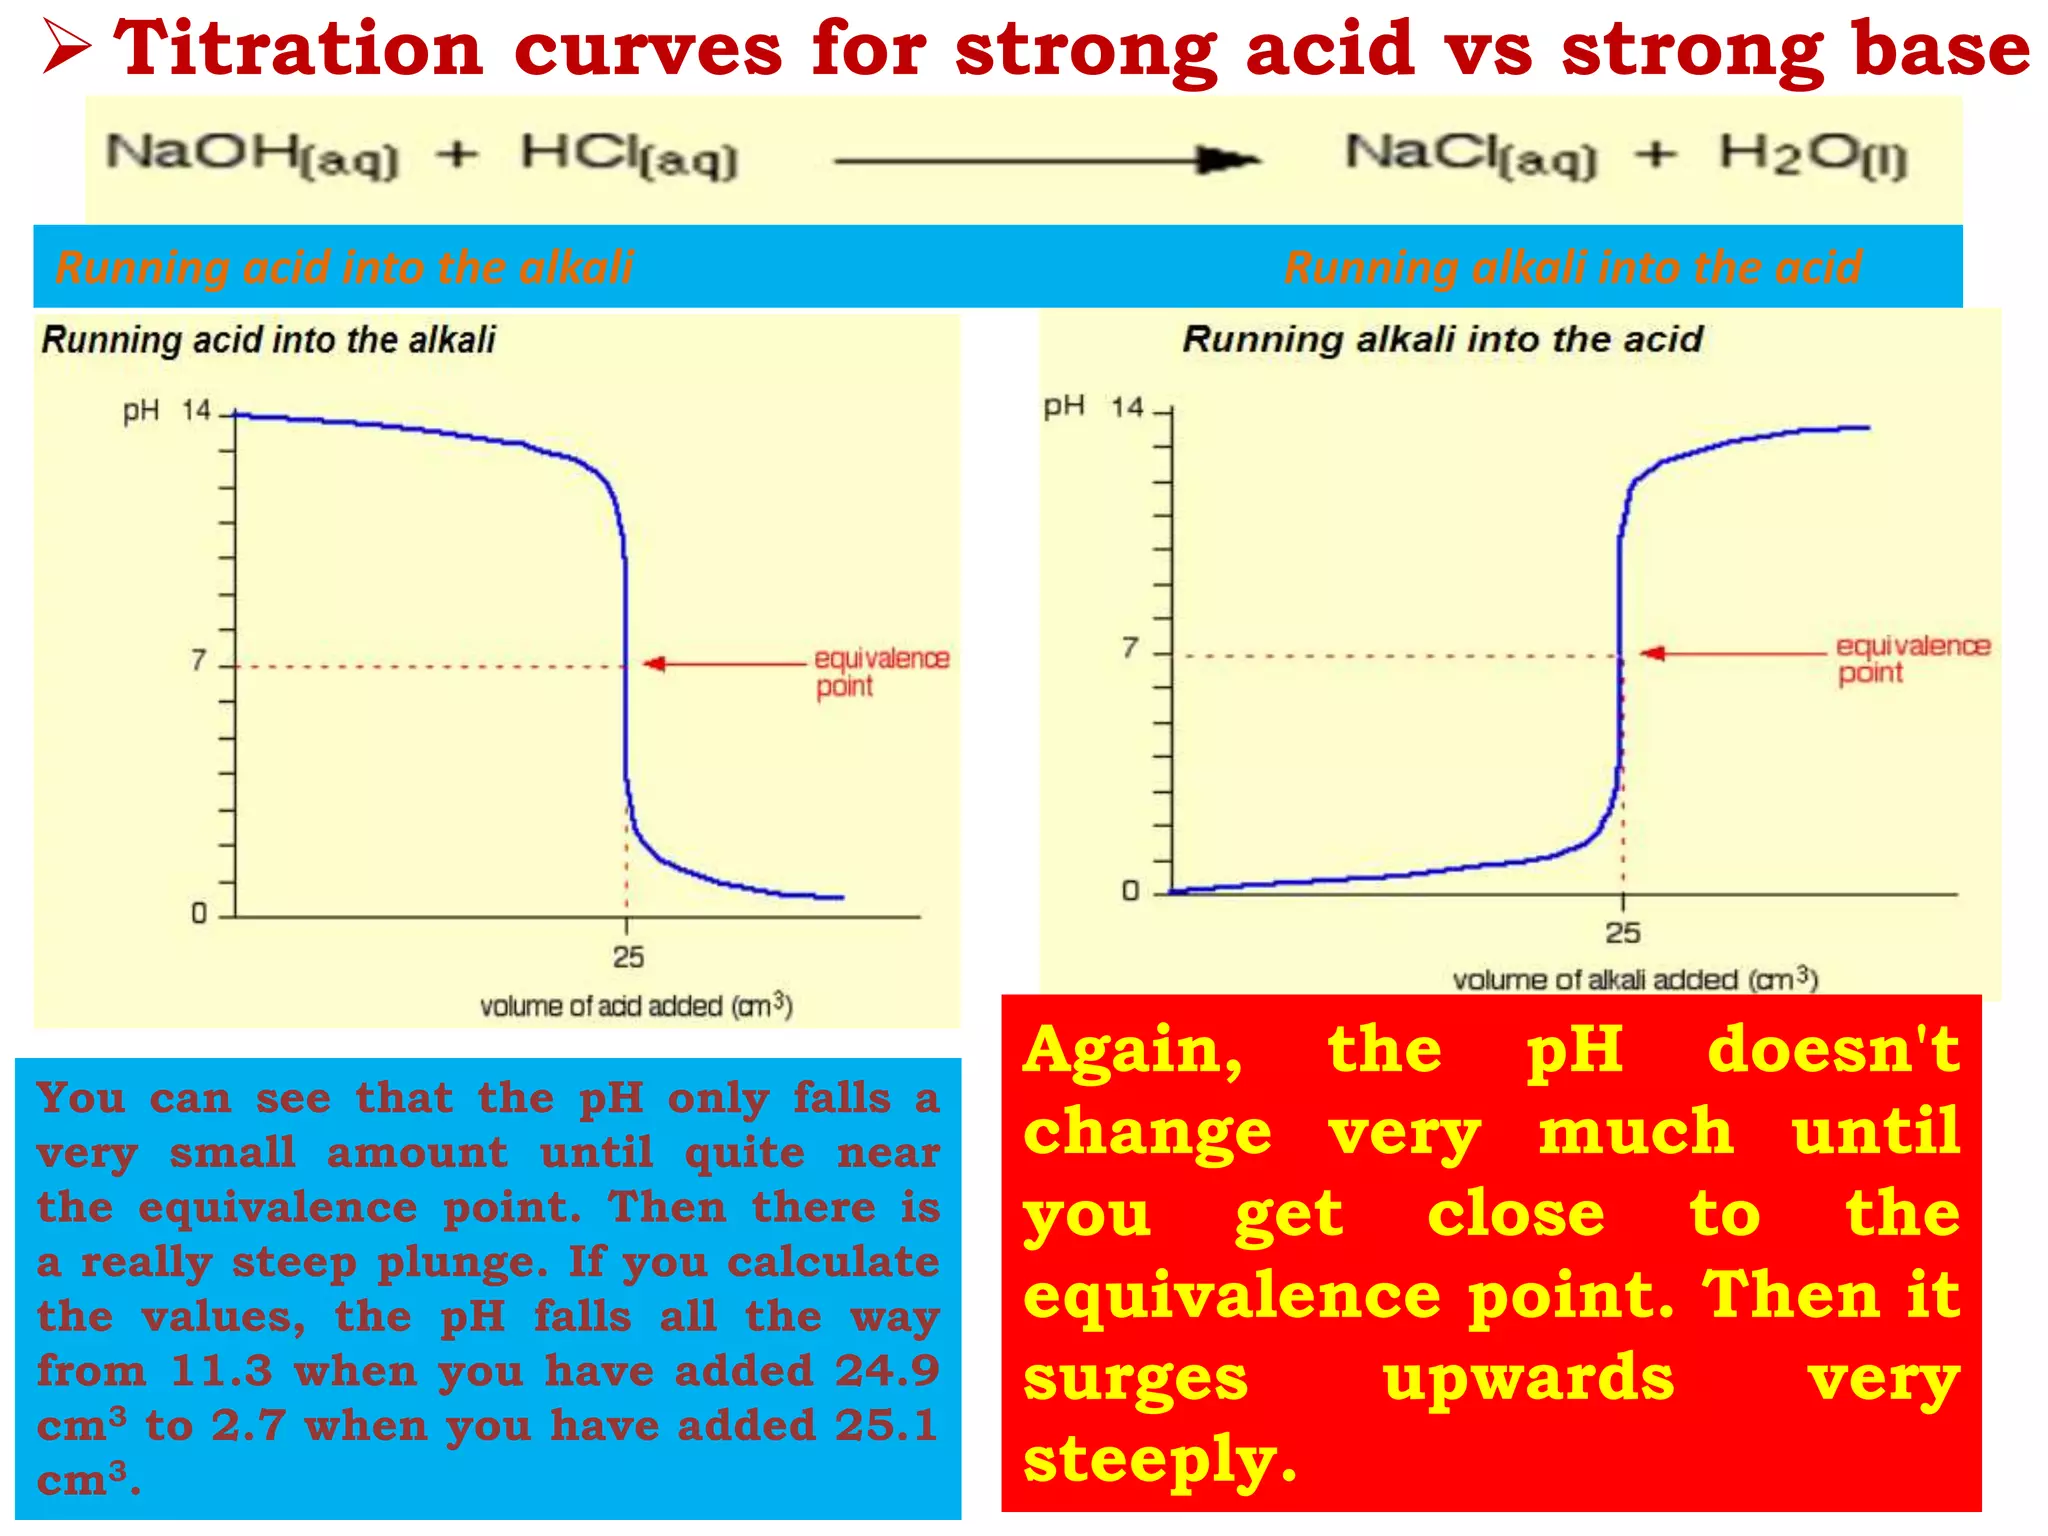
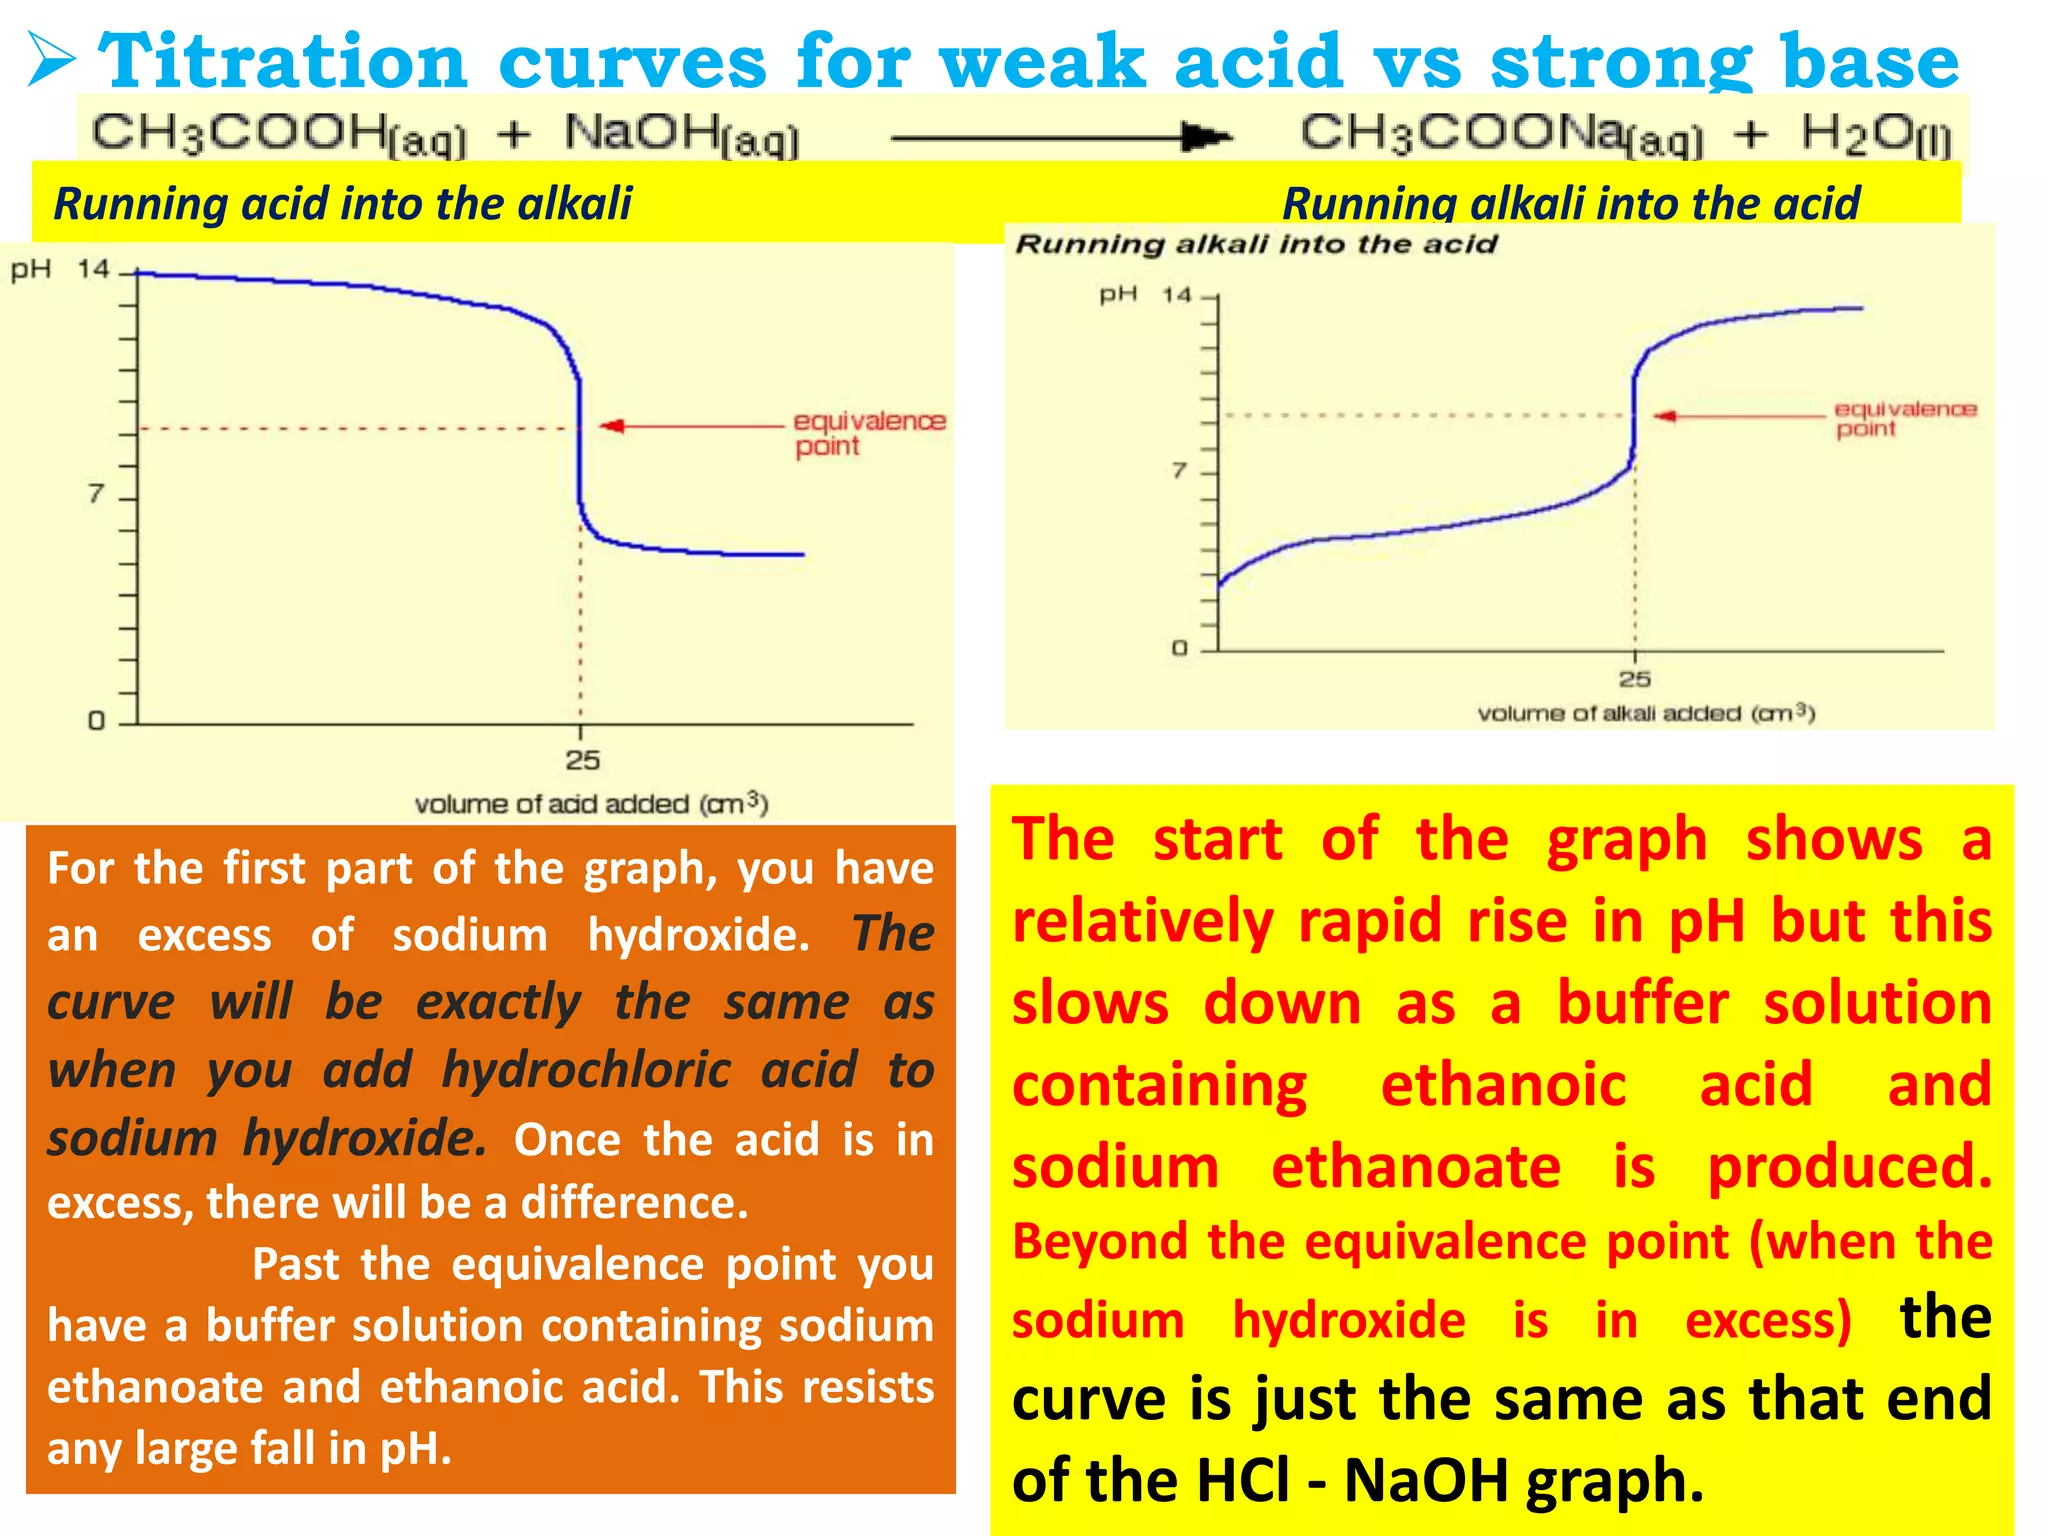
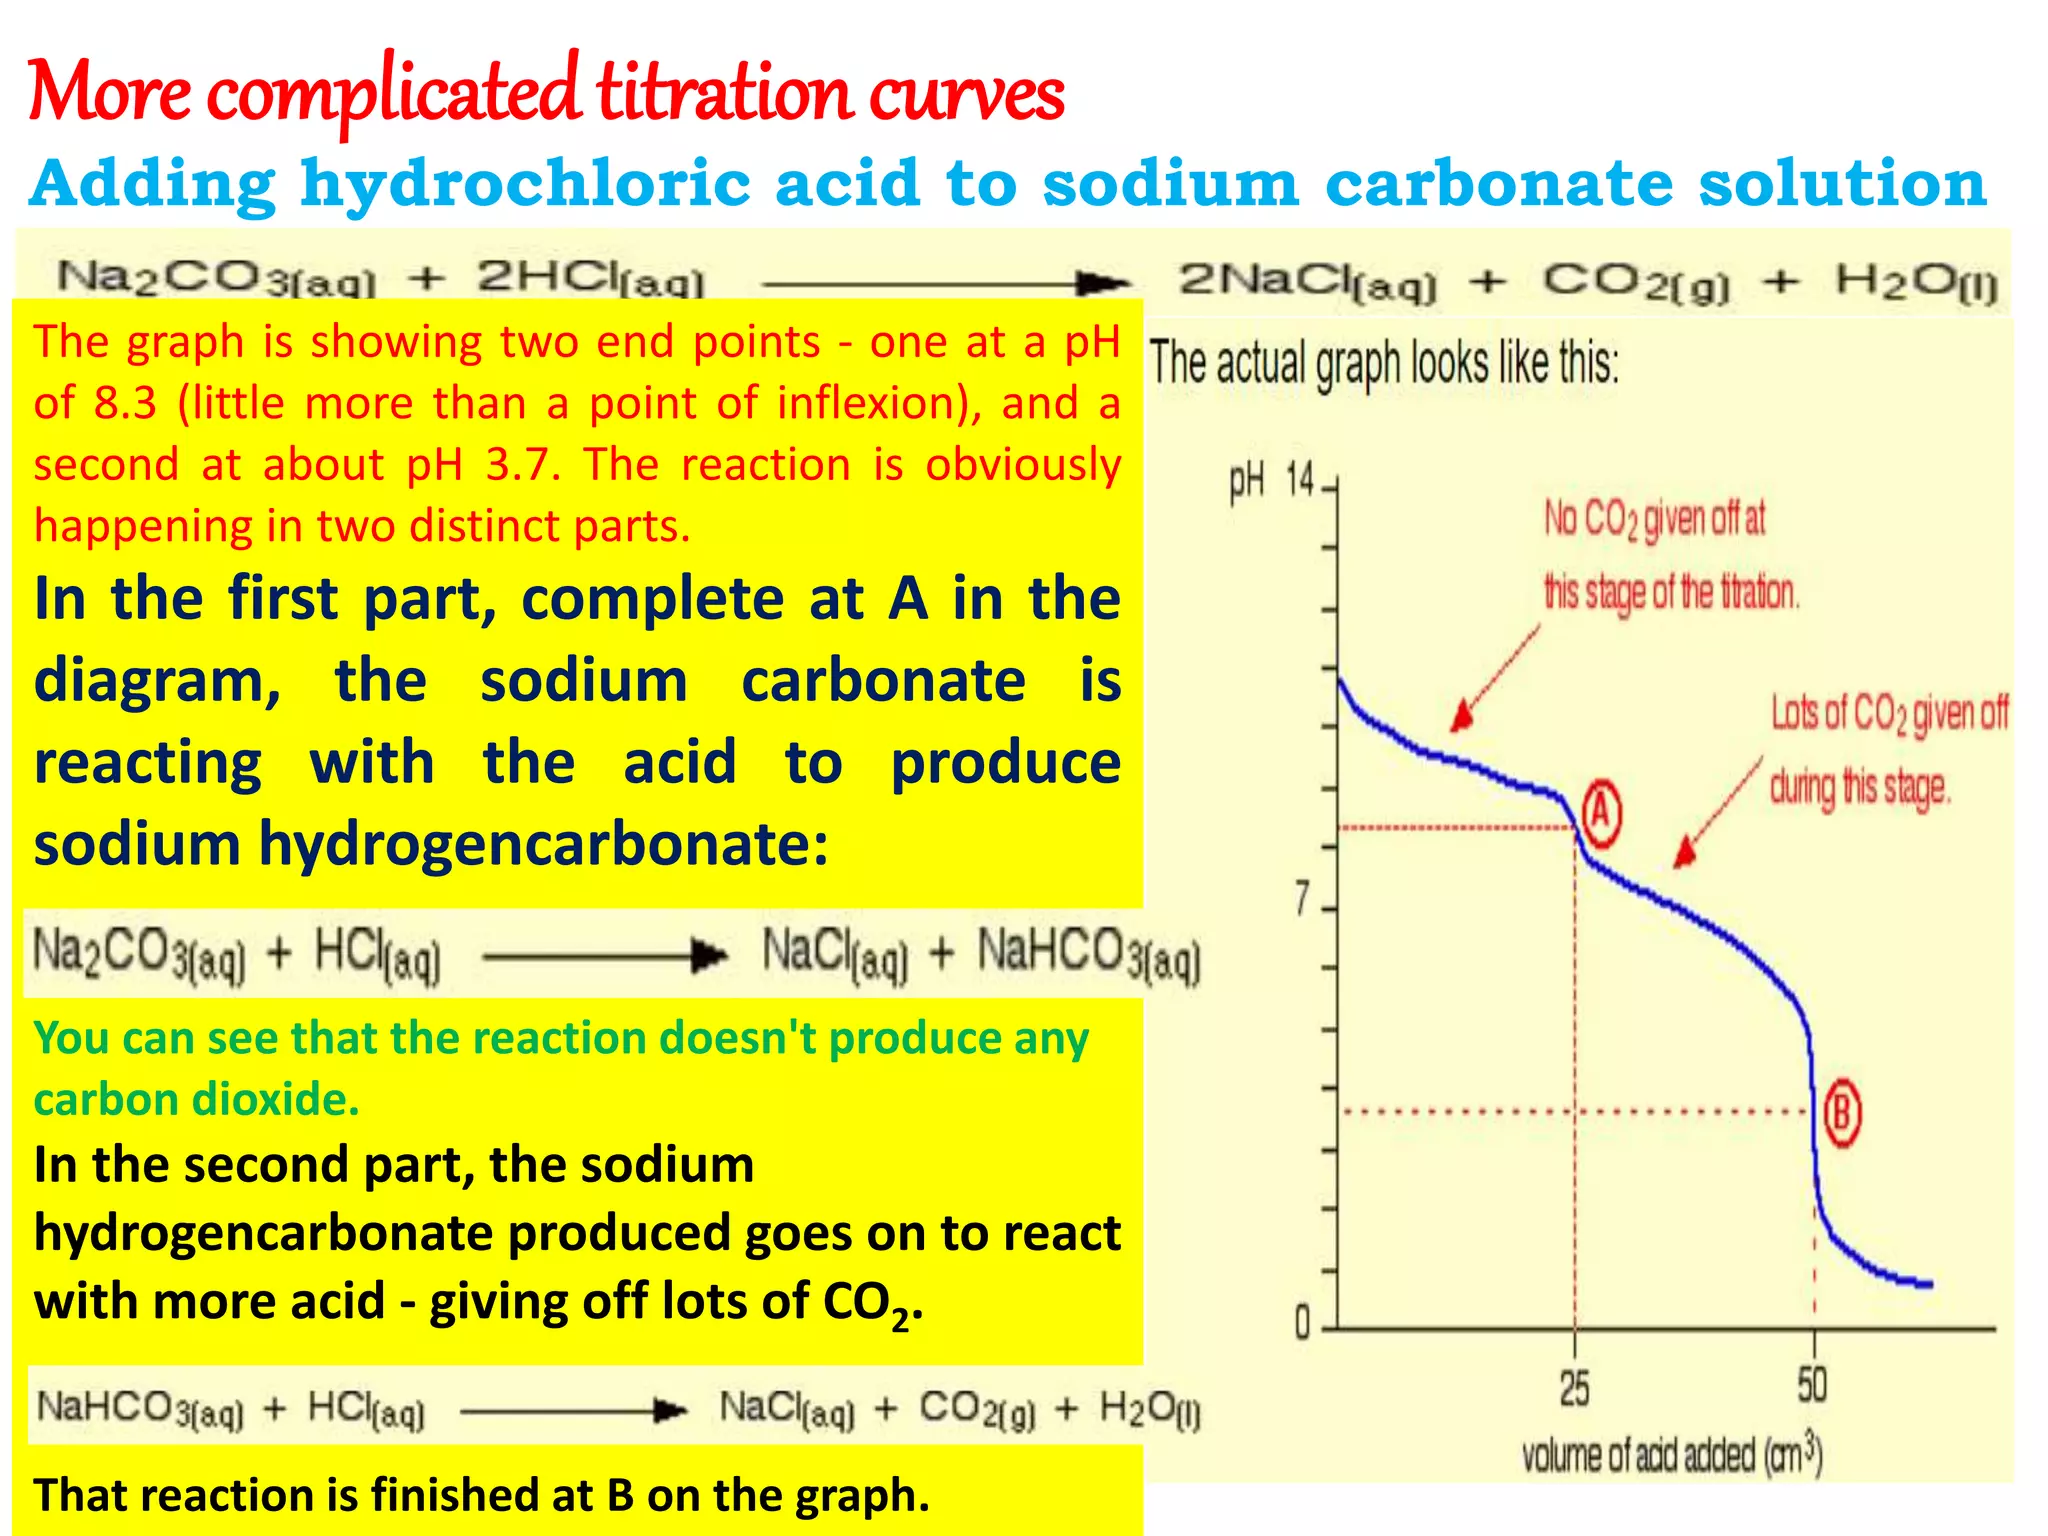
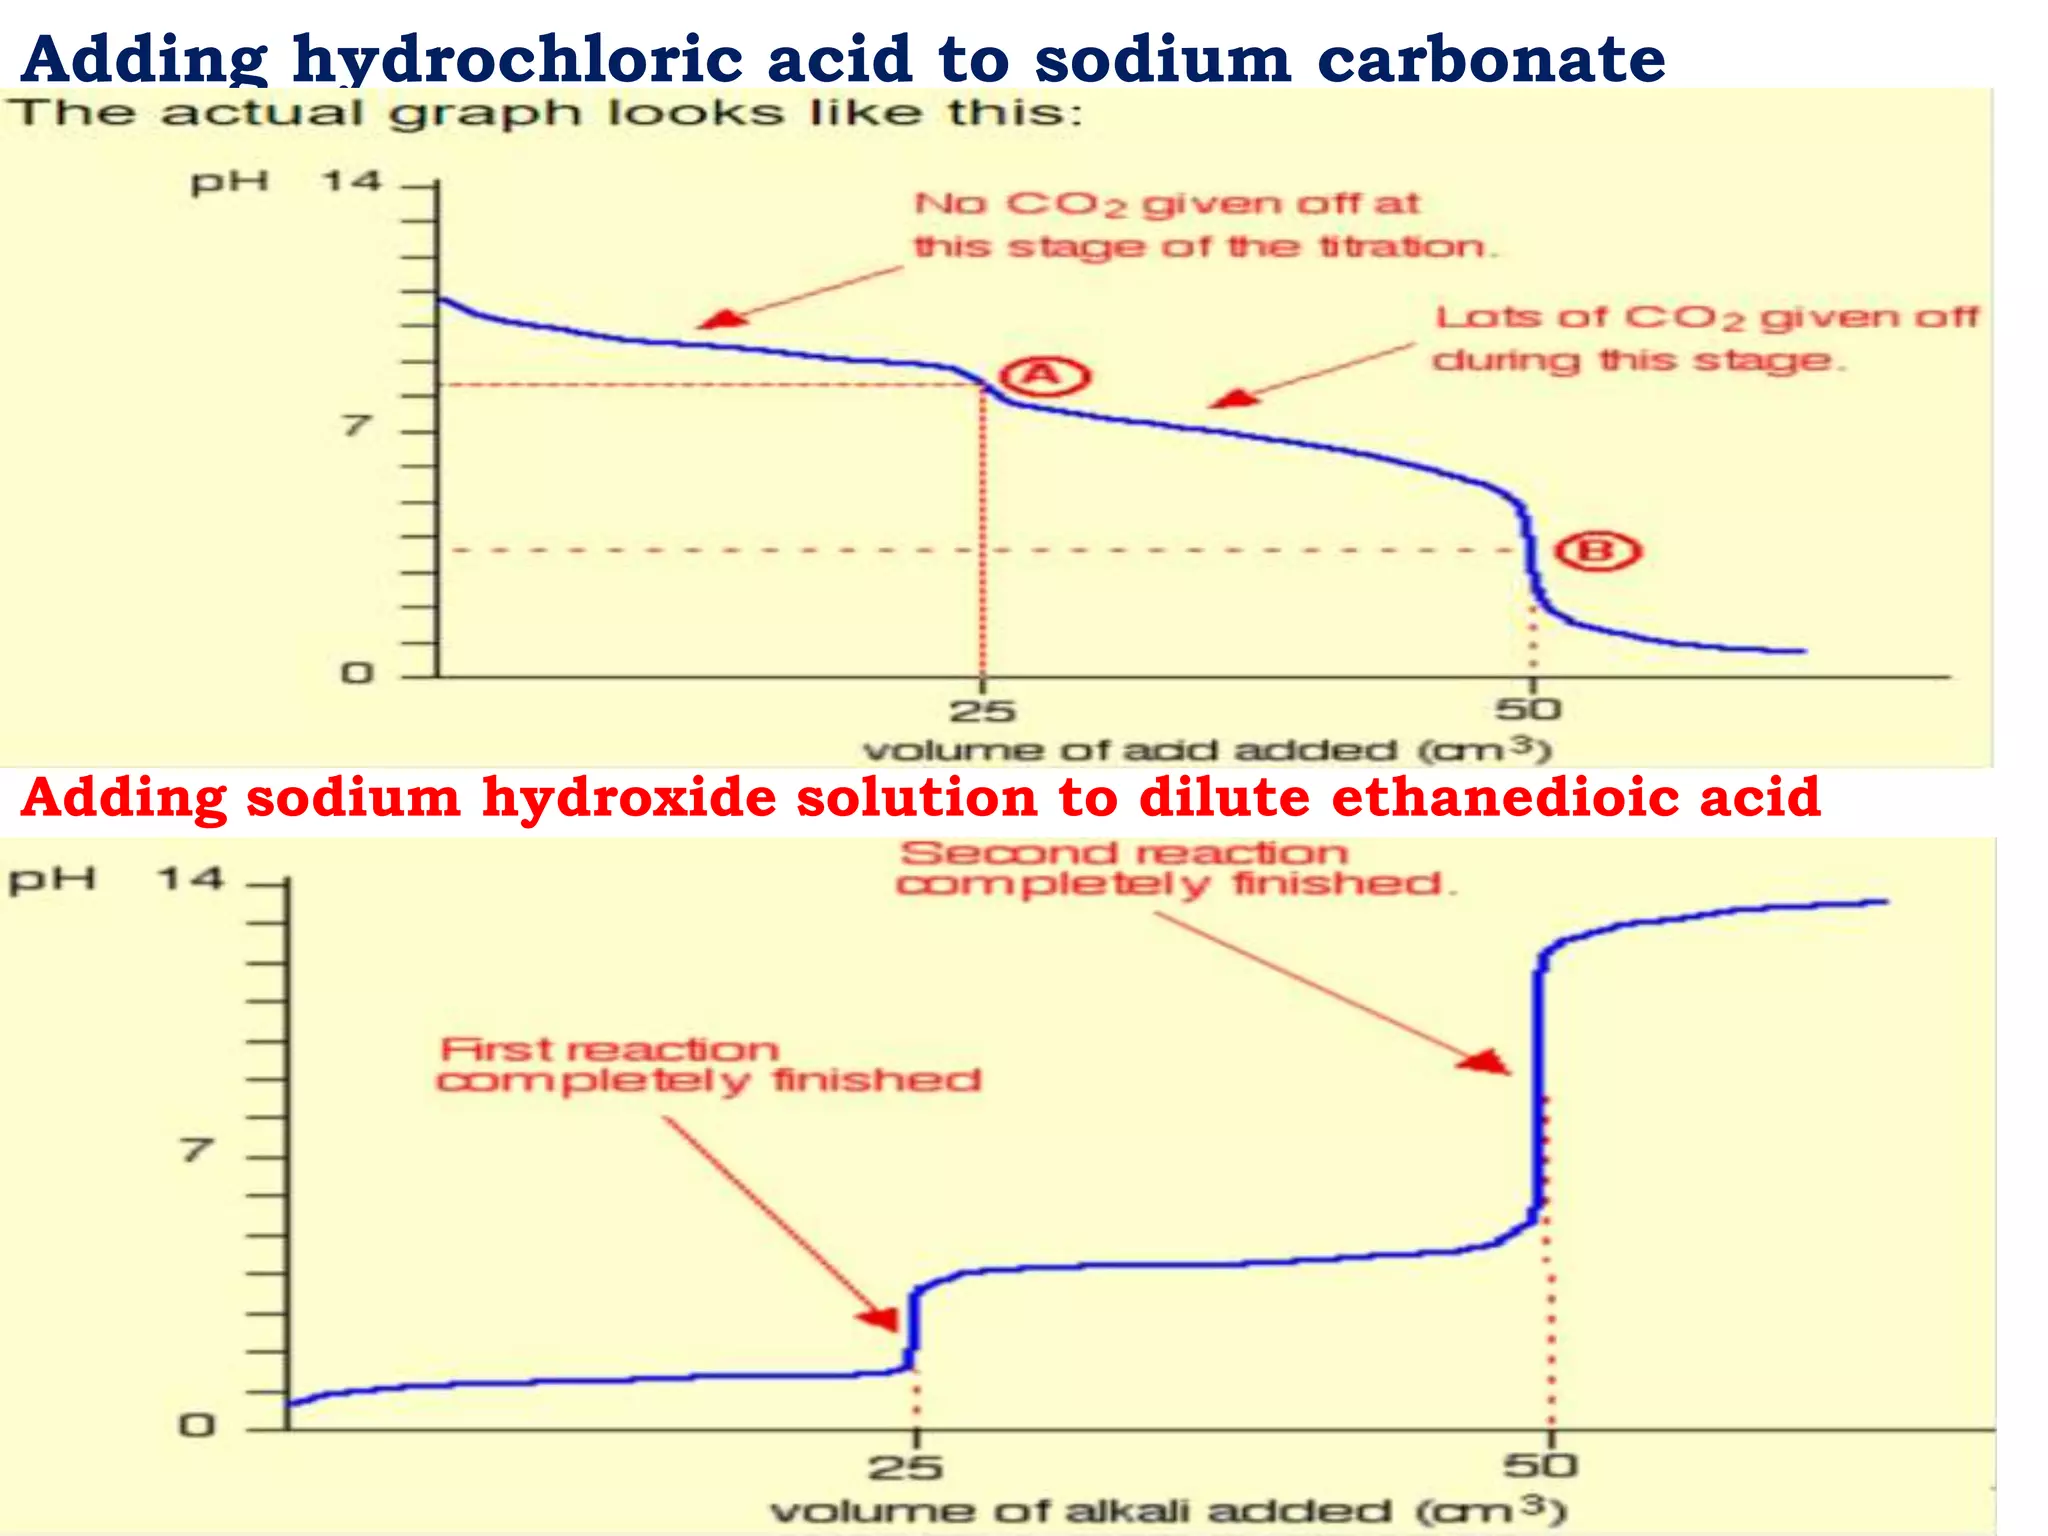
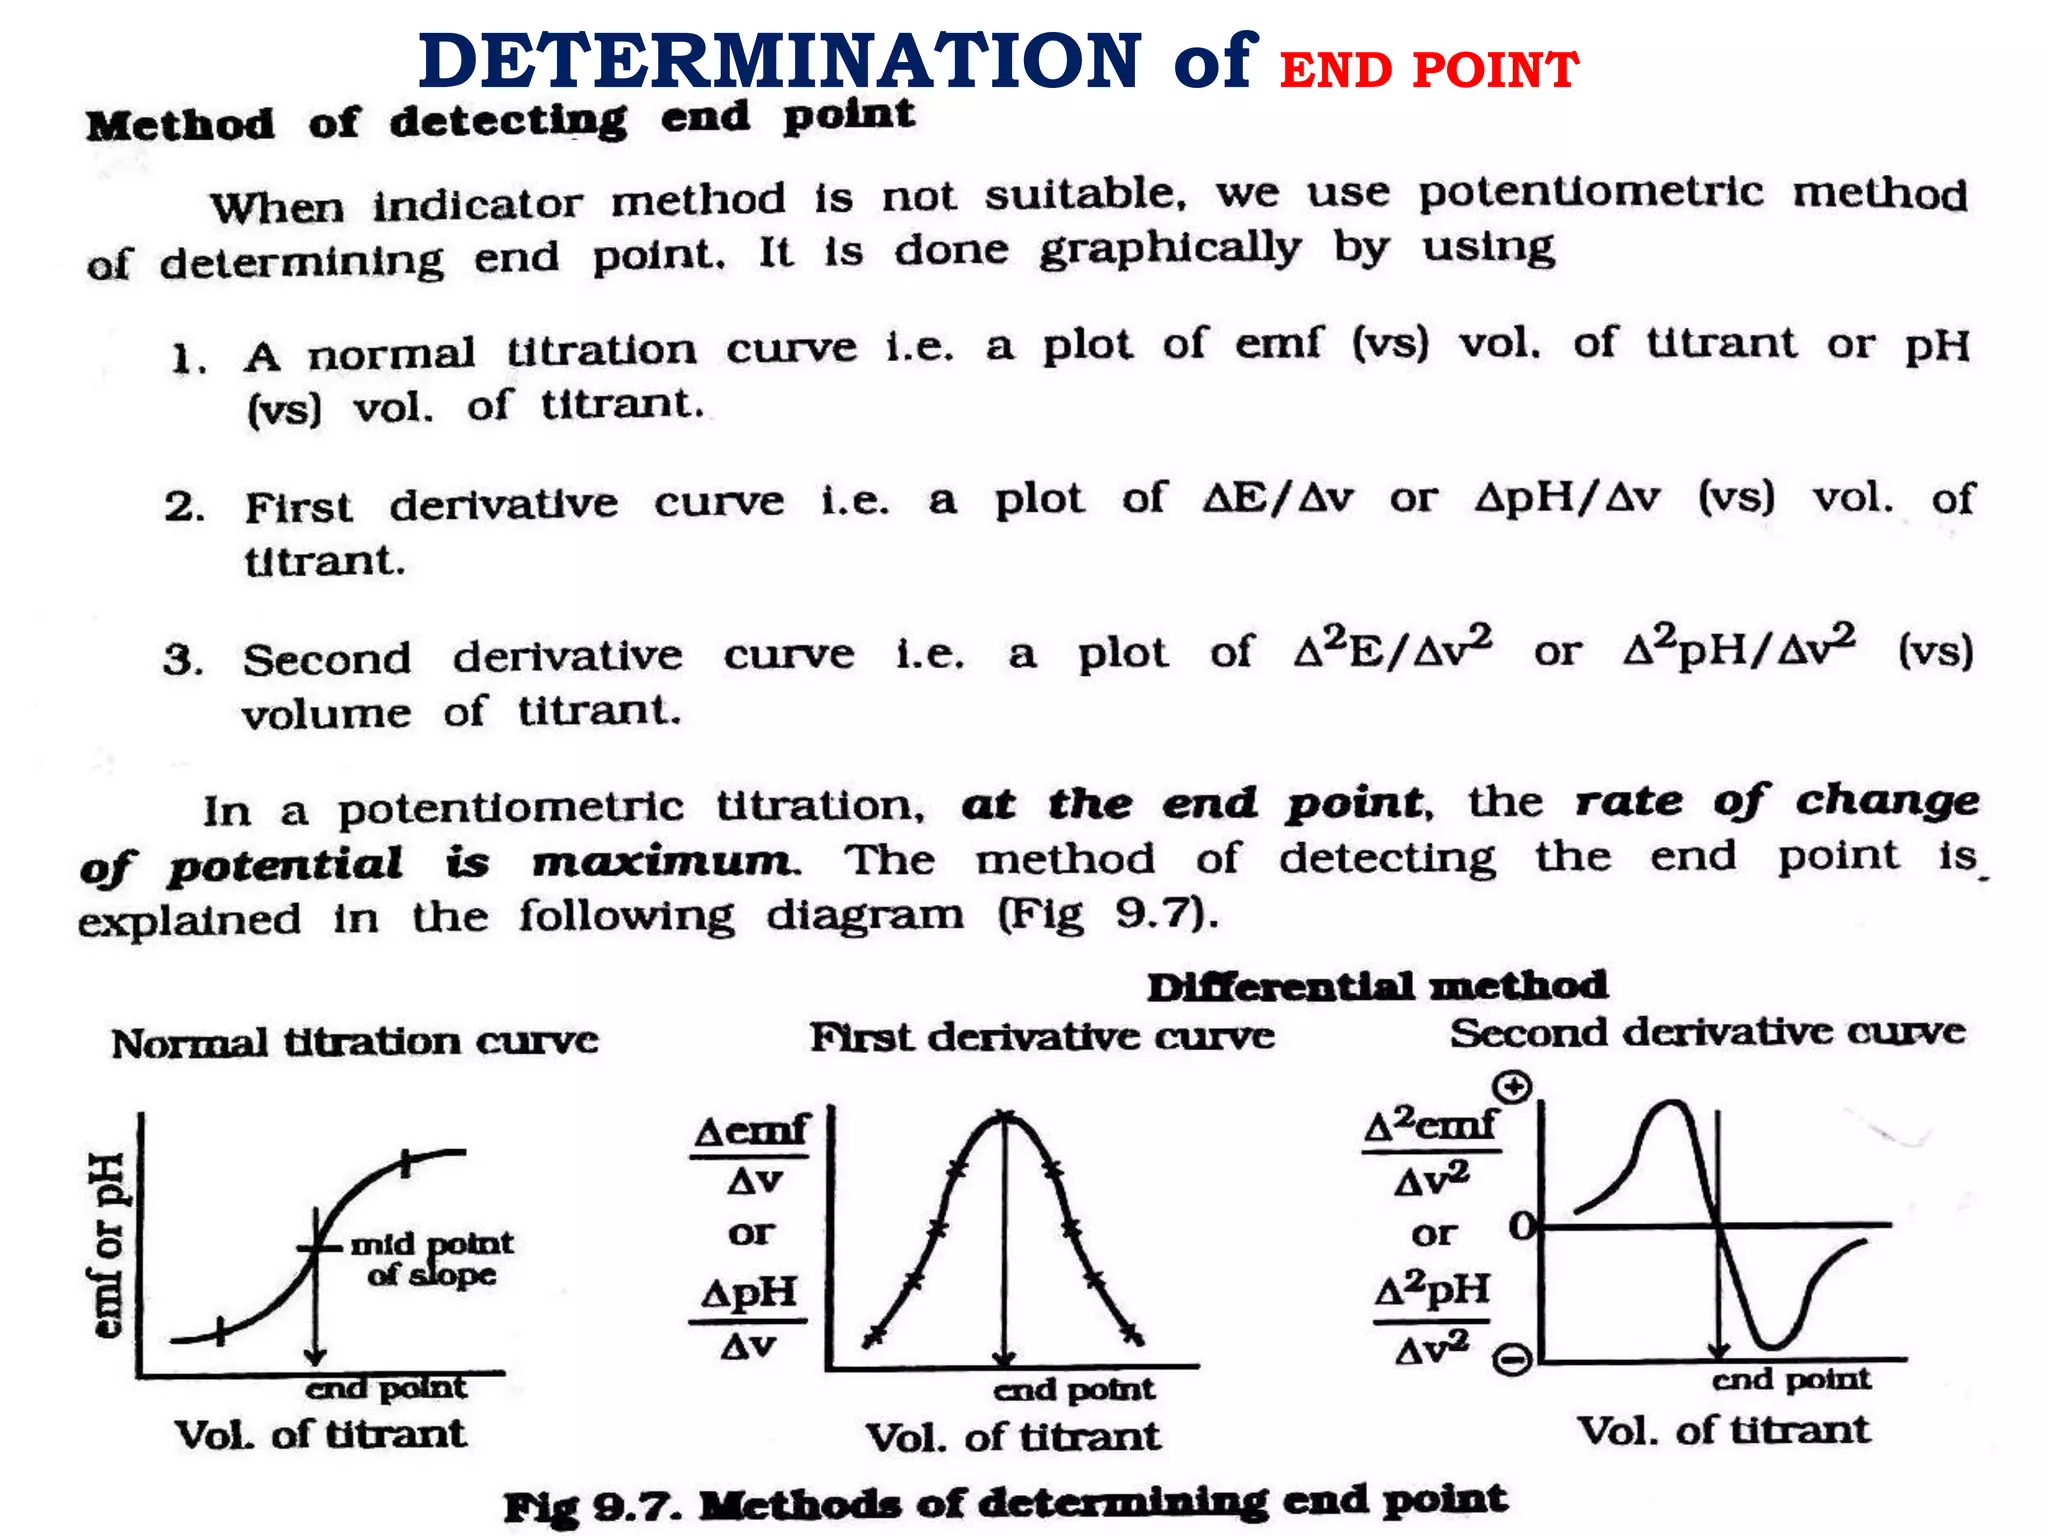
Contents
• Introduction to pH (TITRATION) CURVES
• Types of simple pH CURVES
 Titration curves for strong acid vs strong base
 Titration curves for strong acid vs weak base
 Titration curves for weak acid vs strong base
 Titration curves for weak acid vs weak base
 SUMMARY
• More complicated titration curves
 Adding hydrochloric acid to sodium carbonate
solution
 Adding sodium hydroxide solution to dilute
ethanedioic acid.
• END POINT DETERMINATION (DERIVATIVE CURVES)
• Determination of PH & EMF
pH (TITRATION) CURVES
When you carry out a simple acid-base titration, you use an indicator to tell you when
you have the acid and alkali mixed in exactly the right proportions to "neutralise" each
other. When the indicator changes colour, this is often described as the end point of the
titration.
In an ideal world, the colour change would happen when you mix the two solutions
together in exactly equation proportions. That particular mixture is known as
the equivalence point.
For example, if you were titrating sodium hydroxide solution with hydrochloric acid, both
with a concentration of 1 mol dm-3, 25 cm3 of sodium hydroxide solution would need
exactly the same volume of the acid - because they react 1 : 1 according to the equation.
In this particular instance, this would also be the neutral point of the titration, because
sodium chloride solution has a pH of 7.
But that isn't necessarily true of all the salts you might get formed.
For example, if you titrate ammonia solution with hydrochloric acid, you
would get ammonium chloride formed. The ammonium ion is slightly acidic,
and so pure ammonium chloride has a slightly acidic pH.
That means that at the equivalence point (where you had mixed the solutions
in the correct proportions according to the equation), the solution wouldn't actually be neutral.
To use the term "neutral point" in this context would be misleading.
Similarly, if you titrate sodium hydroxide solution with ethanoic acid, at the
equivalence point the pure sodium ethanoate formed has a slightly
alkaline pH because the ethanoate ion is slightly basic.
To summarise:
• The term "neutral point" is best
avoided.
• The term "equivalence point"
means that the solutions have
been mixed in exactly the right
proportions according to the
equation.
• The term "end point" is where
the indicator changes colour.
TYPES OF Simple PH curves
 Titration curves for strong acid vs strong
base
• Running acid into the alkali
• Running alkali into the acid
 Titration curves for strong acid vs weak
base
 Titration curves for weak acid vs strong
base
 Titration curves for weak acid vs weak base
• Running acid into the alkali
***More complicated titration curves
 Adding hydrochloric acid to sodium carbonate
solution
 Adding sodium hydroxide solution to dilute
ethanedioic acid.
 Titration curves for strong acid vs strong base
Running acid into the alkali Running alkali into the acid
You can see that the pH only falls a
very small amount until quite near
the equivalence point. Then there is
a really steep plunge. If you calculate
the values, the pH falls all the way
from 11.3 when you have added 24.9
cm3 to 2.7 when you have added 25.1
cm3.
Again, the pH doesn't
change very much until
you get close to the
equivalence point. Then it
surges upwards very
steeply.
 Titration curves for strong acid vs weak base
Running acid into the alkali Running alkali into the acid
Because you have got a weak base, the beginning
of the curve is obviously going to be different.
However, once you have got an excess of acid, the
curve is essentially the same as before.
At the very beginning of the curve,
the pH starts by falling quite quickly as
the acid is added, but the curve very soon
gets less steep. This is because a buffer solution
is being set up - composed of the excess
ammonia and the ammonium chloride being
formed.
At the beginning of this titration, you have an
excess of hydrochloric acid. The shape of the
curve will be the same as when you had an
excess of acid at the start of a titration running
sodium hydroxide solution into the acid.
It is only after the equivalence point
that things become different.
A buffer solution is formed containing excess
ammonia and ammonium chloride. This resists
any large increase in pH - not that you would
expect a very large increase anyway, because
ammonia is only a weak base.
 Titration curves for weak acid vs strong base
Running acid into the alkali Running alkali into the acid
For the first part of the graph, you have
an excess of sodium hydroxide. The
curve will be exactly the same as
when you add hydrochloric acid to
sodium hydroxide. Once the acid is in
excess, there will be a difference.
Past the equivalence point you
have a buffer solution containing sodium
ethanoate and ethanoic acid. This resists
any large fall in pH.
The start of the graph shows a
relatively rapid rise in pH but this
slows down as a buffer solution
containing ethanoic acid and
sodium ethanoate is produced.
Beyond the equivalence point (when the
sodium hydroxide is in excess) the
curve is just the same as that end
of the HCl - NaOH graph.
 Titration curves for weak acid vs weak base
This is really just a combination of graphs you have already seen. Up to the equivalence
point it is similar to the ammonia - HCl case. After the equivalence point it is like the end of
the ethanoic acid - NaOH curve.
Notice that there isn't any steep bit on this graph. Instead, there is just what is known as a "point of
inflexion". That lack of a steep bit means that it is difficult to do a titration of a weak
acid against a weak base.
Running acid into the alkali
The way you normally carry out a titration involves adding the acid to the alkali. Here are
reduced versions of the graphs described above so that you can see them all together.
A summary of the important curves
More complicatedtitration curves
Adding hydrochloric acid to sodium carbonate solution
The graph is showing two end points - one at a pH
of 8.3 (little more than a point of inflexion), and a
second at about pH 3.7. The reaction is obviously
happening in two distinct parts.
In the first part, complete at A in the
diagram, the sodium carbonate is
reacting with the acid to produce
sodium hydrogencarbonate:
You can see that the reaction doesn't produce any
carbon dioxide.
In the second part, the sodium
hydrogencarbonate produced goes on to react
with more acid - giving off lots of CO2.
That reaction is finished at B on the graph.
Ethanedioic acid was previously known as oxalic acid. It is a diprotic acid, which means that
it can give away 2 protons (hydrogen ions) to a base. Something which can only give away
one (like HCl) is known as a monoprotic acid.
Adding sodium hydroxide solution to dilute ethanedioic acid
The reaction with sodium hydroxide takes place in two stages because one of the hydrogens
is easier to remove than the other. The two successive reactions are:
If you run sodium hydroxide
solution into ethanedioic
acid solution, the pH curve
shows the end points for
both of these reactions.
The curve is for
the reaction between
sodium hydroxide and
ethanedioic acid solutions
of equal concentrations.
Adding hydrochloric acid to sodium carbonate
solution
Adding sodium hydroxide solution to dilute ethanedioic acid
DETERMINATION
of
END POINT, PH &
EMF
(DERIVATIVE CURVES)
DETERMINATION of END POINT
DETERMINATION of PH
DEFINITION OF emf (electromotive force)
Derivative curve for EMF
Ph curves
Ph curves
Ph curves

Ph curves

  • 2.
    Contents • Introduction topH (TITRATION) CURVES • Types of simple pH CURVES  Titration curves for strong acid vs strong base  Titration curves for strong acid vs weak base  Titration curves for weak acid vs strong base  Titration curves for weak acid vs weak base  SUMMARY • More complicated titration curves  Adding hydrochloric acid to sodium carbonate solution  Adding sodium hydroxide solution to dilute ethanedioic acid. • END POINT DETERMINATION (DERIVATIVE CURVES) • Determination of PH & EMF
  • 3.
    pH (TITRATION) CURVES Whenyou carry out a simple acid-base titration, you use an indicator to tell you when you have the acid and alkali mixed in exactly the right proportions to "neutralise" each other. When the indicator changes colour, this is often described as the end point of the titration. In an ideal world, the colour change would happen when you mix the two solutions together in exactly equation proportions. That particular mixture is known as the equivalence point. For example, if you were titrating sodium hydroxide solution with hydrochloric acid, both with a concentration of 1 mol dm-3, 25 cm3 of sodium hydroxide solution would need exactly the same volume of the acid - because they react 1 : 1 according to the equation. In this particular instance, this would also be the neutral point of the titration, because sodium chloride solution has a pH of 7. But that isn't necessarily true of all the salts you might get formed. For example, if you titrate ammonia solution with hydrochloric acid, you would get ammonium chloride formed. The ammonium ion is slightly acidic, and so pure ammonium chloride has a slightly acidic pH. That means that at the equivalence point (where you had mixed the solutions in the correct proportions according to the equation), the solution wouldn't actually be neutral. To use the term "neutral point" in this context would be misleading. Similarly, if you titrate sodium hydroxide solution with ethanoic acid, at the equivalence point the pure sodium ethanoate formed has a slightly alkaline pH because the ethanoate ion is slightly basic.
  • 4.
    To summarise: • Theterm "neutral point" is best avoided. • The term "equivalence point" means that the solutions have been mixed in exactly the right proportions according to the equation. • The term "end point" is where the indicator changes colour.
  • 5.
    TYPES OF SimplePH curves  Titration curves for strong acid vs strong base • Running acid into the alkali • Running alkali into the acid  Titration curves for strong acid vs weak base  Titration curves for weak acid vs strong base  Titration curves for weak acid vs weak base • Running acid into the alkali ***More complicated titration curves  Adding hydrochloric acid to sodium carbonate solution  Adding sodium hydroxide solution to dilute ethanedioic acid.
  • 6.
     Titration curvesfor strong acid vs strong base Running acid into the alkali Running alkali into the acid You can see that the pH only falls a very small amount until quite near the equivalence point. Then there is a really steep plunge. If you calculate the values, the pH falls all the way from 11.3 when you have added 24.9 cm3 to 2.7 when you have added 25.1 cm3. Again, the pH doesn't change very much until you get close to the equivalence point. Then it surges upwards very steeply.
  • 7.
     Titration curvesfor strong acid vs weak base Running acid into the alkali Running alkali into the acid Because you have got a weak base, the beginning of the curve is obviously going to be different. However, once you have got an excess of acid, the curve is essentially the same as before. At the very beginning of the curve, the pH starts by falling quite quickly as the acid is added, but the curve very soon gets less steep. This is because a buffer solution is being set up - composed of the excess ammonia and the ammonium chloride being formed. At the beginning of this titration, you have an excess of hydrochloric acid. The shape of the curve will be the same as when you had an excess of acid at the start of a titration running sodium hydroxide solution into the acid. It is only after the equivalence point that things become different. A buffer solution is formed containing excess ammonia and ammonium chloride. This resists any large increase in pH - not that you would expect a very large increase anyway, because ammonia is only a weak base.
  • 8.
     Titration curvesfor weak acid vs strong base Running acid into the alkali Running alkali into the acid For the first part of the graph, you have an excess of sodium hydroxide. The curve will be exactly the same as when you add hydrochloric acid to sodium hydroxide. Once the acid is in excess, there will be a difference. Past the equivalence point you have a buffer solution containing sodium ethanoate and ethanoic acid. This resists any large fall in pH. The start of the graph shows a relatively rapid rise in pH but this slows down as a buffer solution containing ethanoic acid and sodium ethanoate is produced. Beyond the equivalence point (when the sodium hydroxide is in excess) the curve is just the same as that end of the HCl - NaOH graph.
  • 9.
     Titration curvesfor weak acid vs weak base This is really just a combination of graphs you have already seen. Up to the equivalence point it is similar to the ammonia - HCl case. After the equivalence point it is like the end of the ethanoic acid - NaOH curve. Notice that there isn't any steep bit on this graph. Instead, there is just what is known as a "point of inflexion". That lack of a steep bit means that it is difficult to do a titration of a weak acid against a weak base. Running acid into the alkali
  • 10.
    The way younormally carry out a titration involves adding the acid to the alkali. Here are reduced versions of the graphs described above so that you can see them all together. A summary of the important curves
  • 11.
    More complicatedtitration curves Addinghydrochloric acid to sodium carbonate solution The graph is showing two end points - one at a pH of 8.3 (little more than a point of inflexion), and a second at about pH 3.7. The reaction is obviously happening in two distinct parts. In the first part, complete at A in the diagram, the sodium carbonate is reacting with the acid to produce sodium hydrogencarbonate: You can see that the reaction doesn't produce any carbon dioxide. In the second part, the sodium hydrogencarbonate produced goes on to react with more acid - giving off lots of CO2. That reaction is finished at B on the graph.
  • 12.
    Ethanedioic acid waspreviously known as oxalic acid. It is a diprotic acid, which means that it can give away 2 protons (hydrogen ions) to a base. Something which can only give away one (like HCl) is known as a monoprotic acid. Adding sodium hydroxide solution to dilute ethanedioic acid The reaction with sodium hydroxide takes place in two stages because one of the hydrogens is easier to remove than the other. The two successive reactions are: If you run sodium hydroxide solution into ethanedioic acid solution, the pH curve shows the end points for both of these reactions. The curve is for the reaction between sodium hydroxide and ethanedioic acid solutions of equal concentrations.
  • 13.
    Adding hydrochloric acidto sodium carbonate solution Adding sodium hydroxide solution to dilute ethanedioic acid
  • 14.
    DETERMINATION of END POINT, PH& EMF (DERIVATIVE CURVES)
  • 15.
  • 16.
  • 18.
    DEFINITION OF emf(electromotive force)
  • 25.