Downloaded 438 times
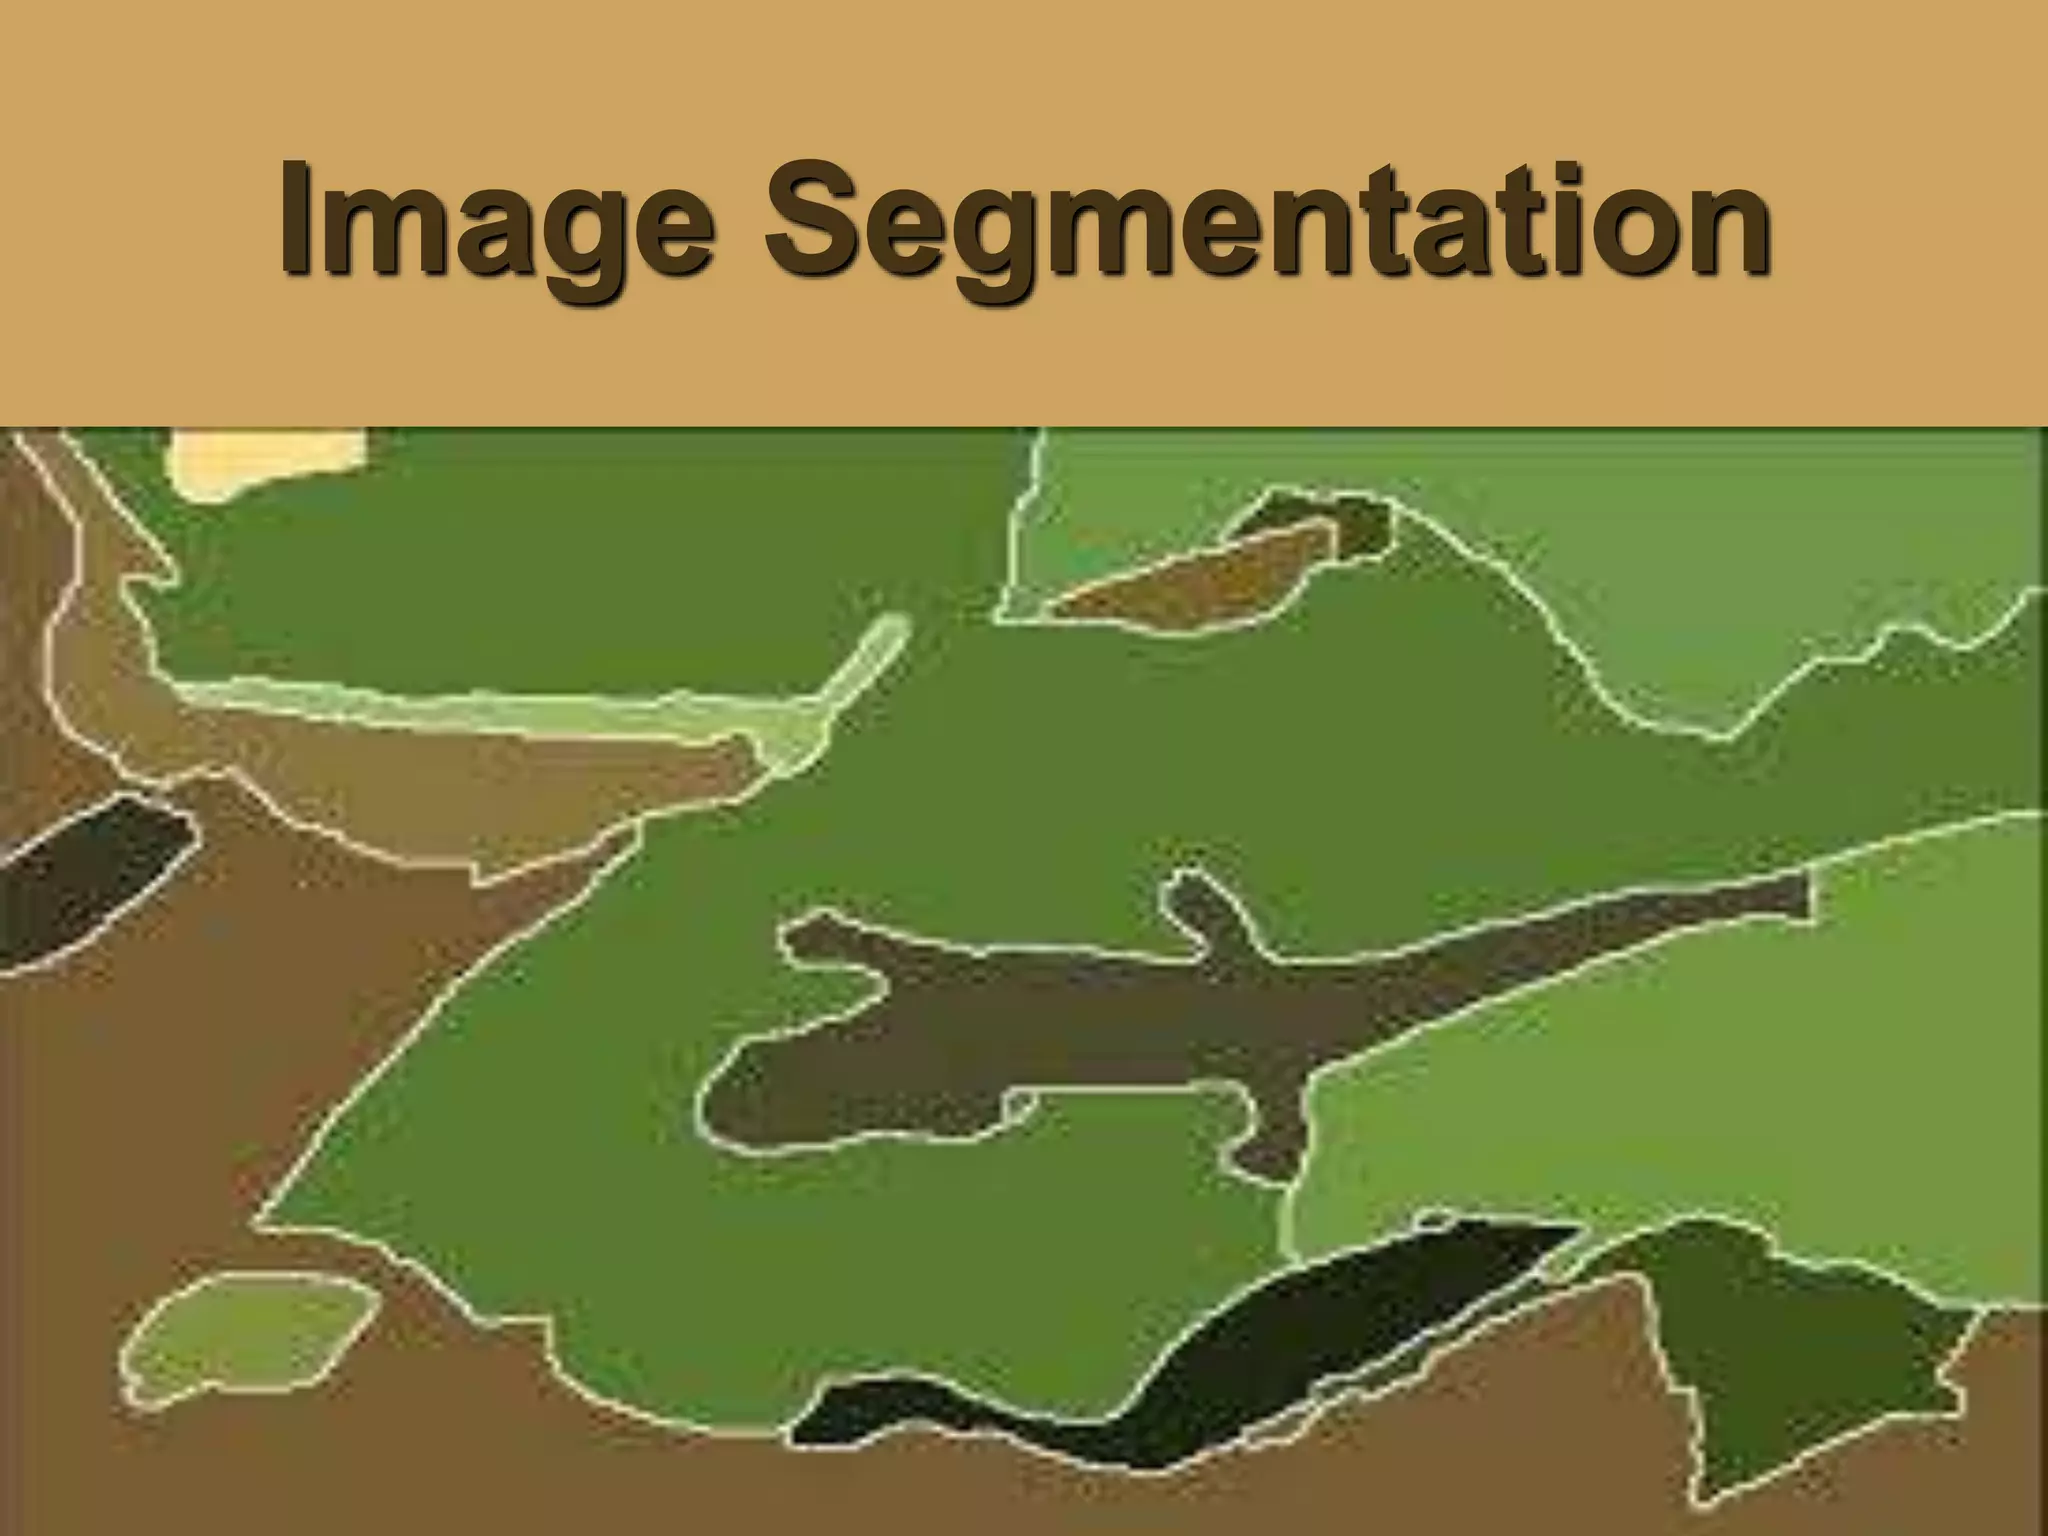


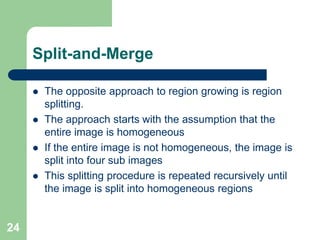

The document discusses various methods of image segmentation, which is the process of partitioning an image into homogenous regions. It covers edge-based and region-based segmentation techniques such as region growing and split-and-merge, as well as active contour models (snakes) and their applications in medical imaging. The conclusion emphasizes the complexity of image analysis in medical contexts and the necessity of incorporating prior knowledge to improve segmentation outcomes.