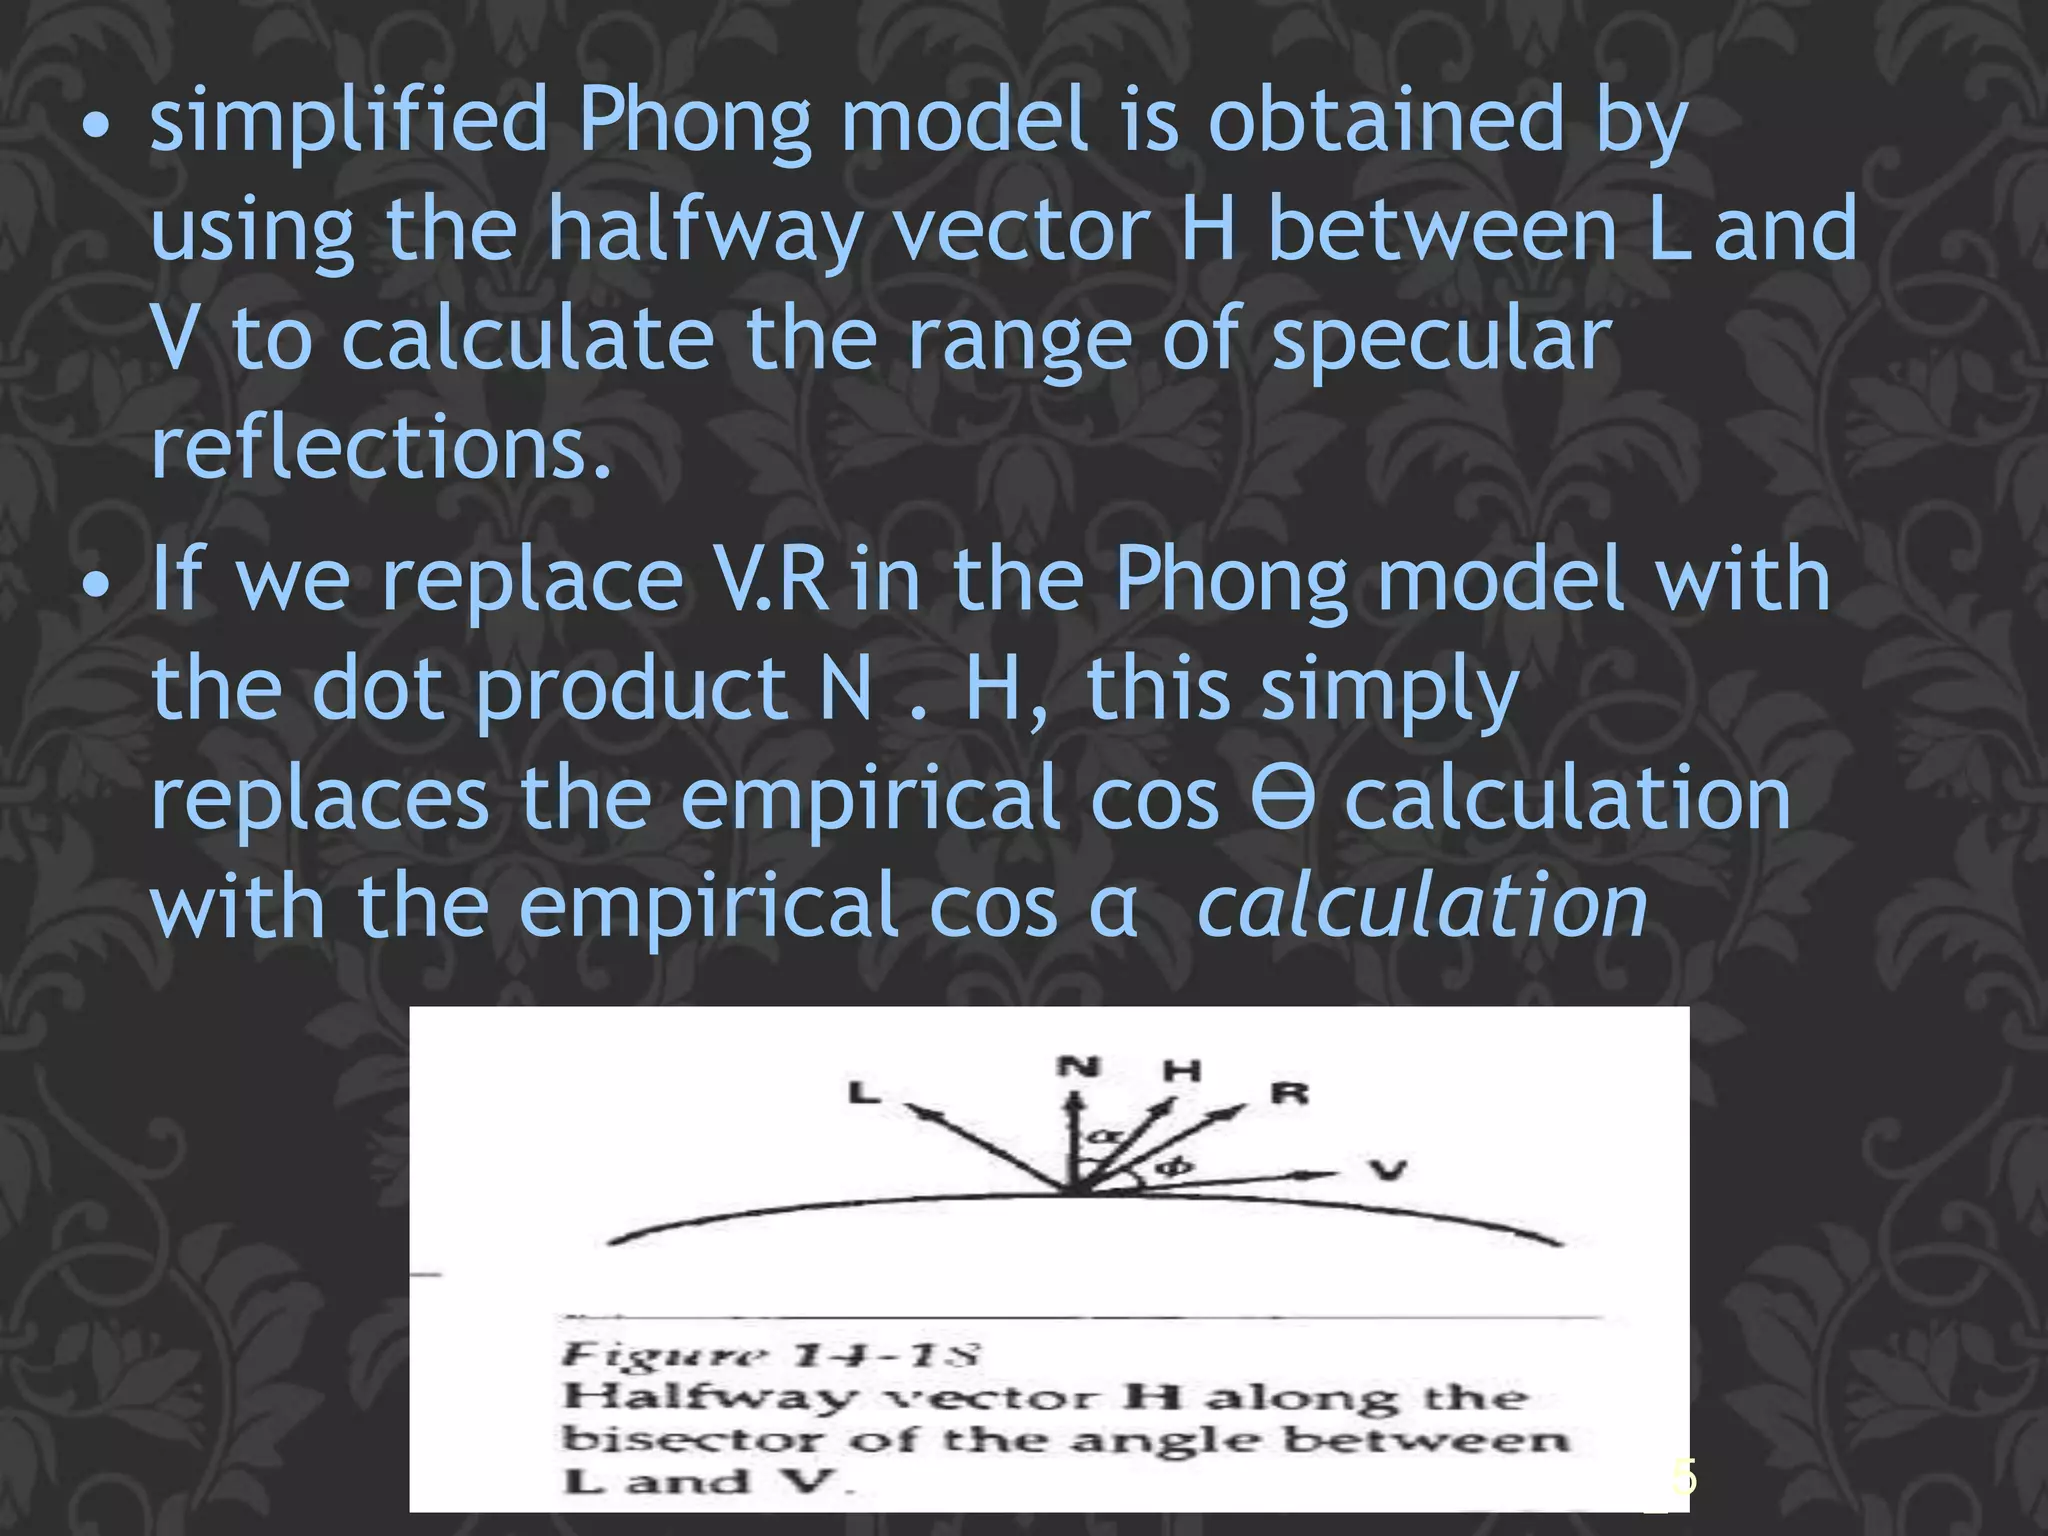
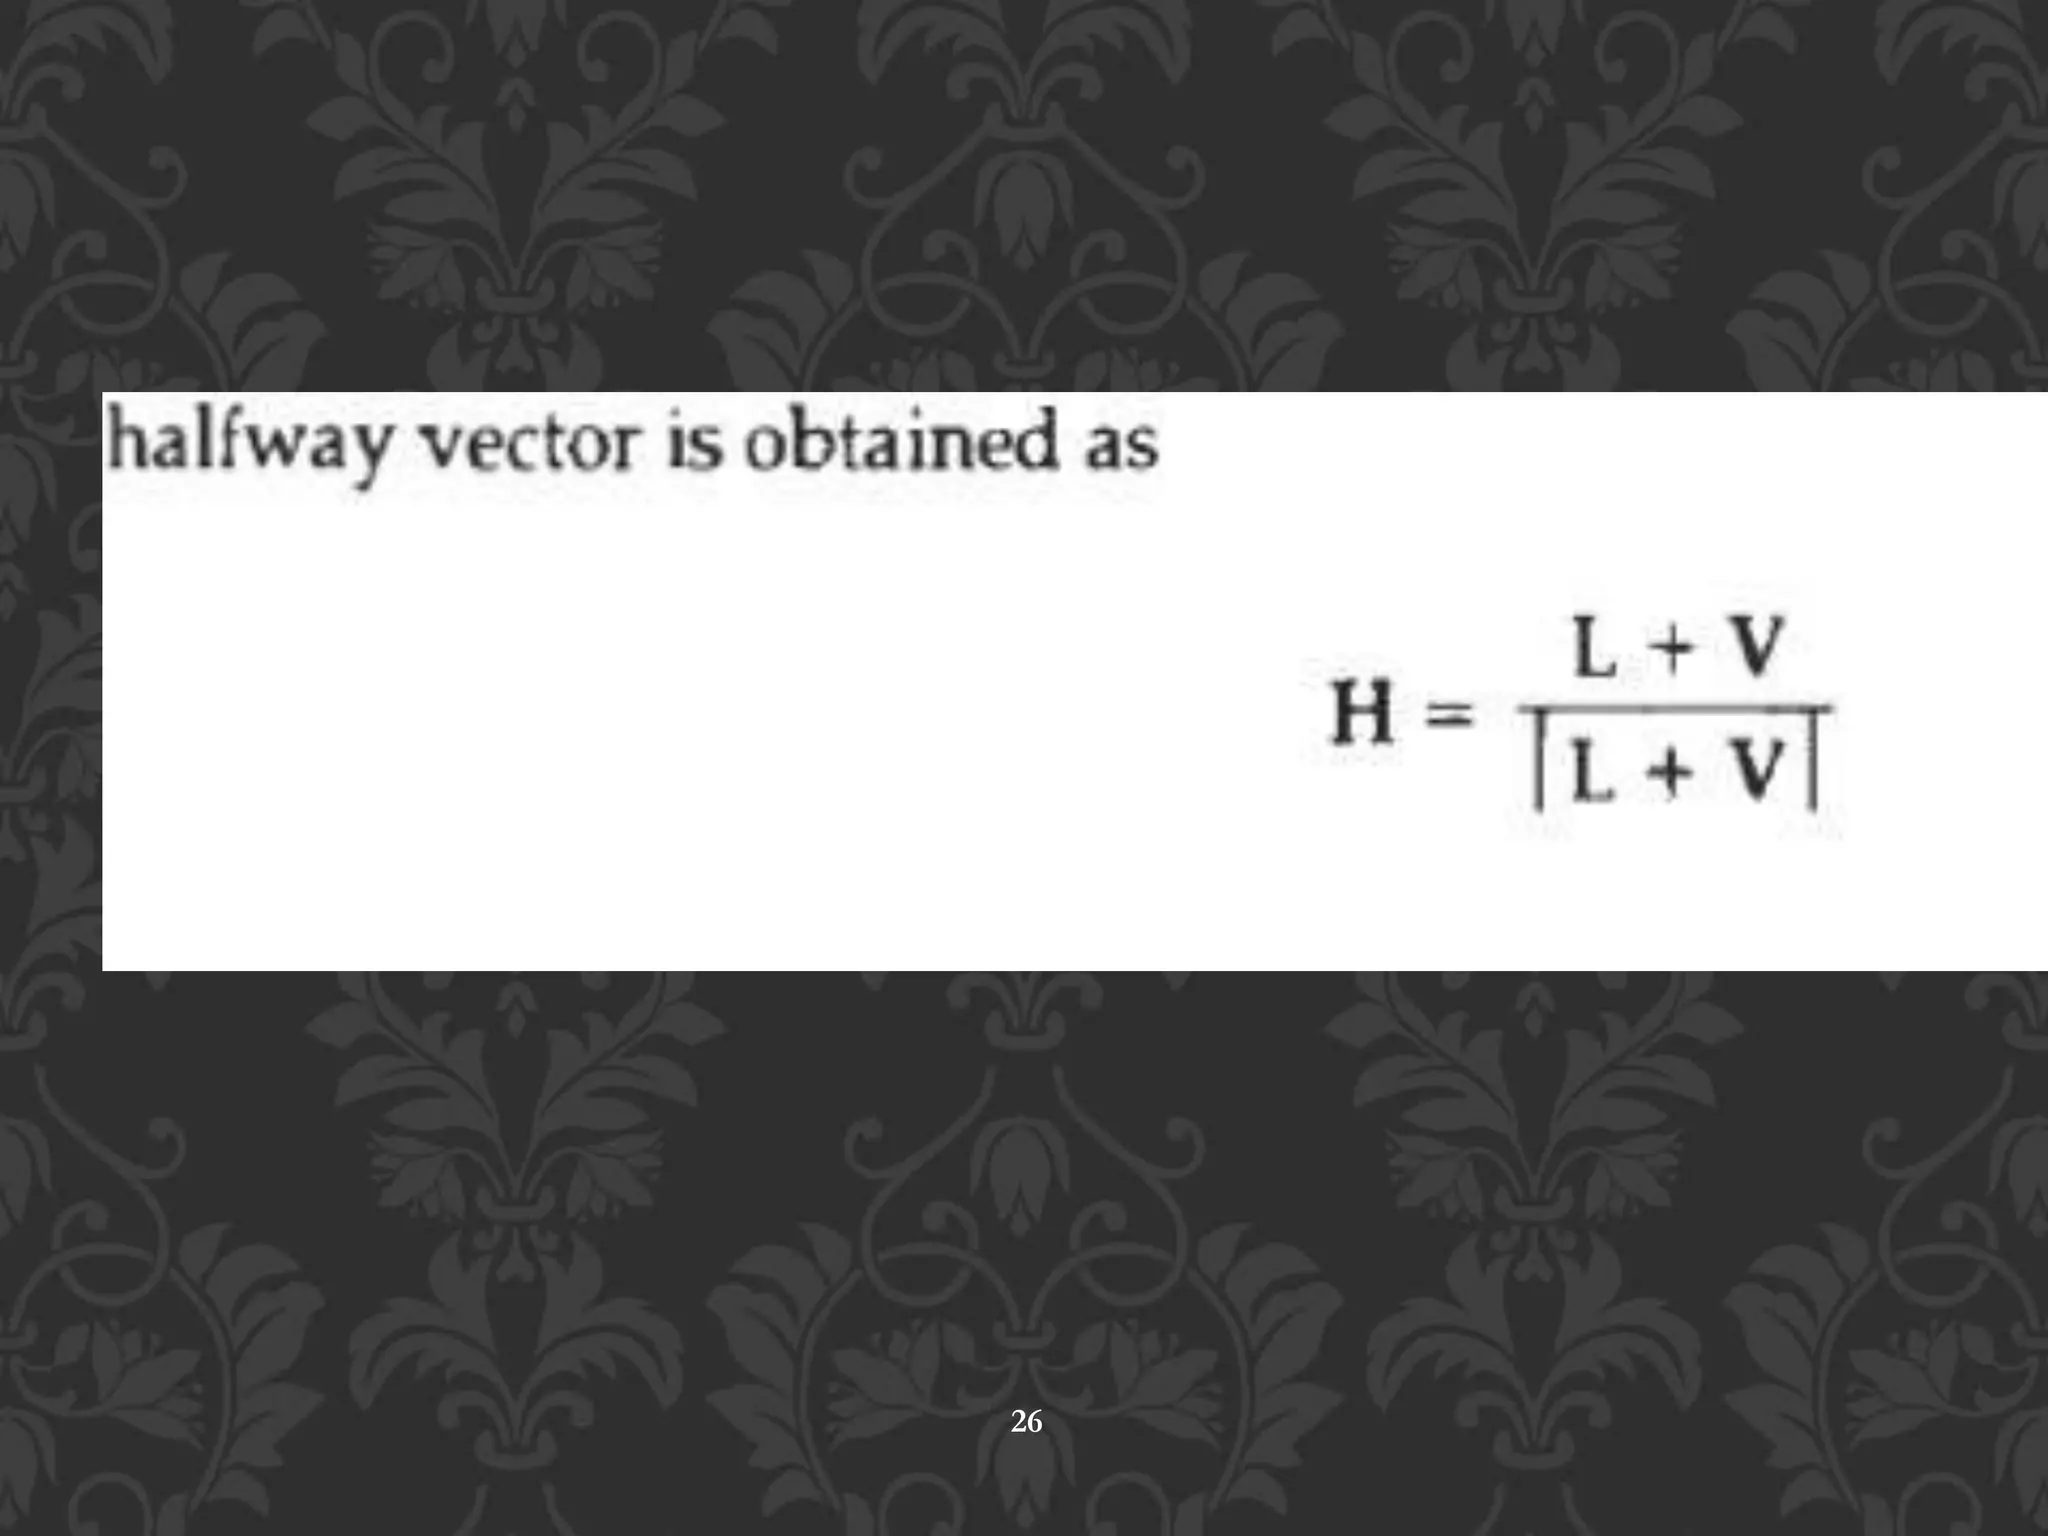
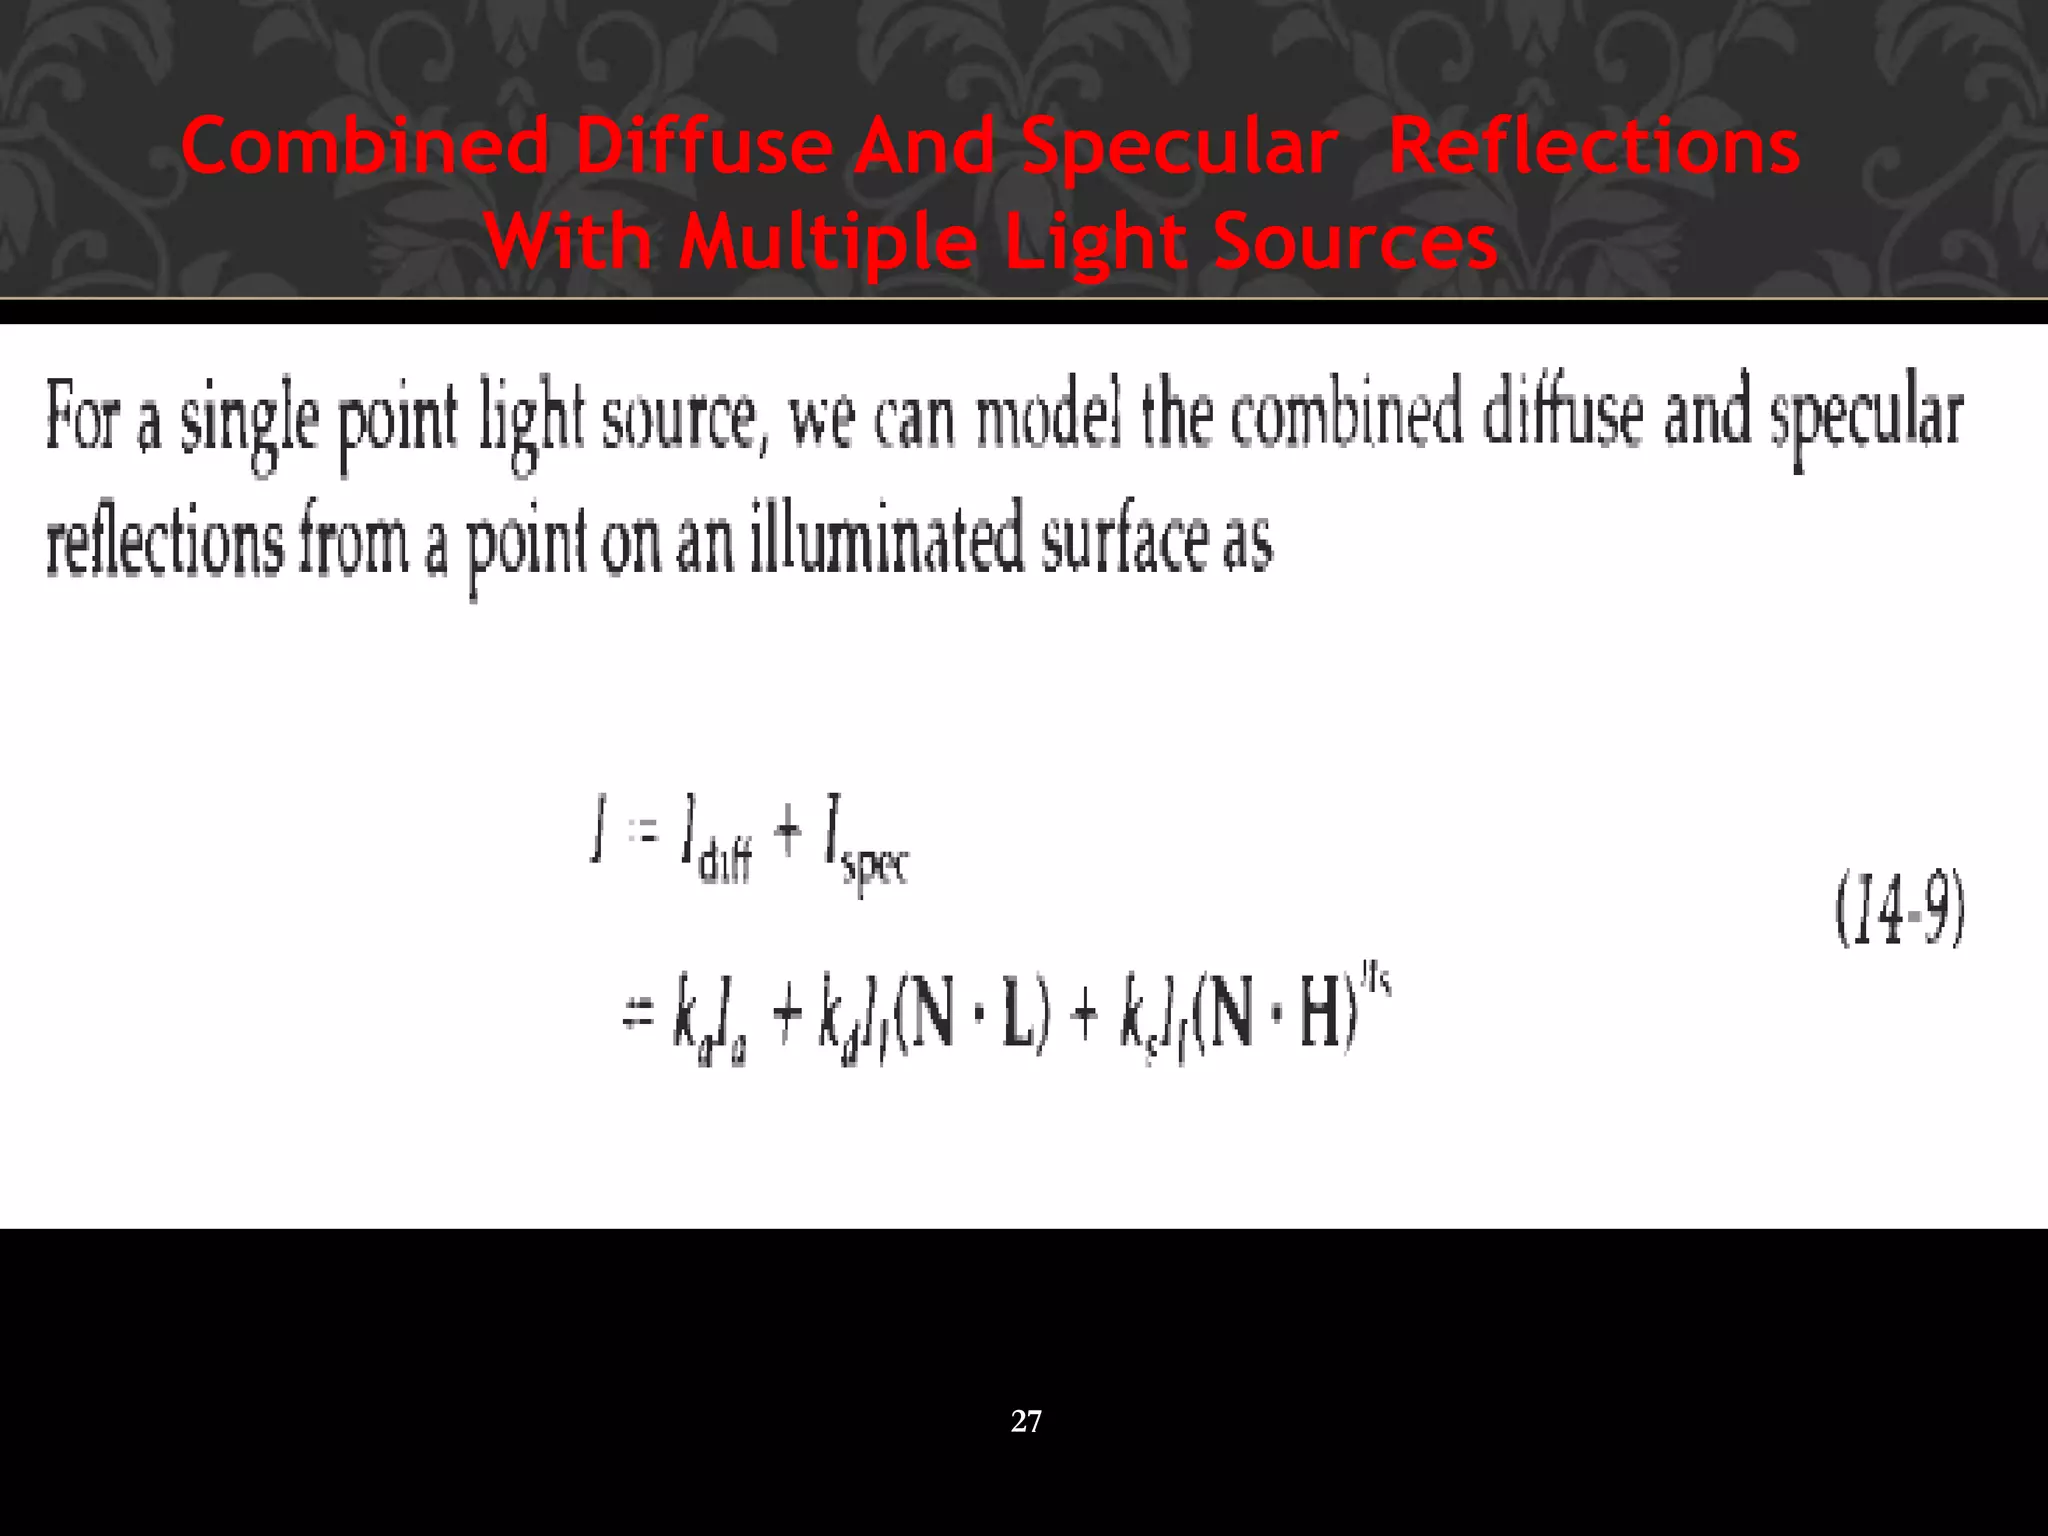
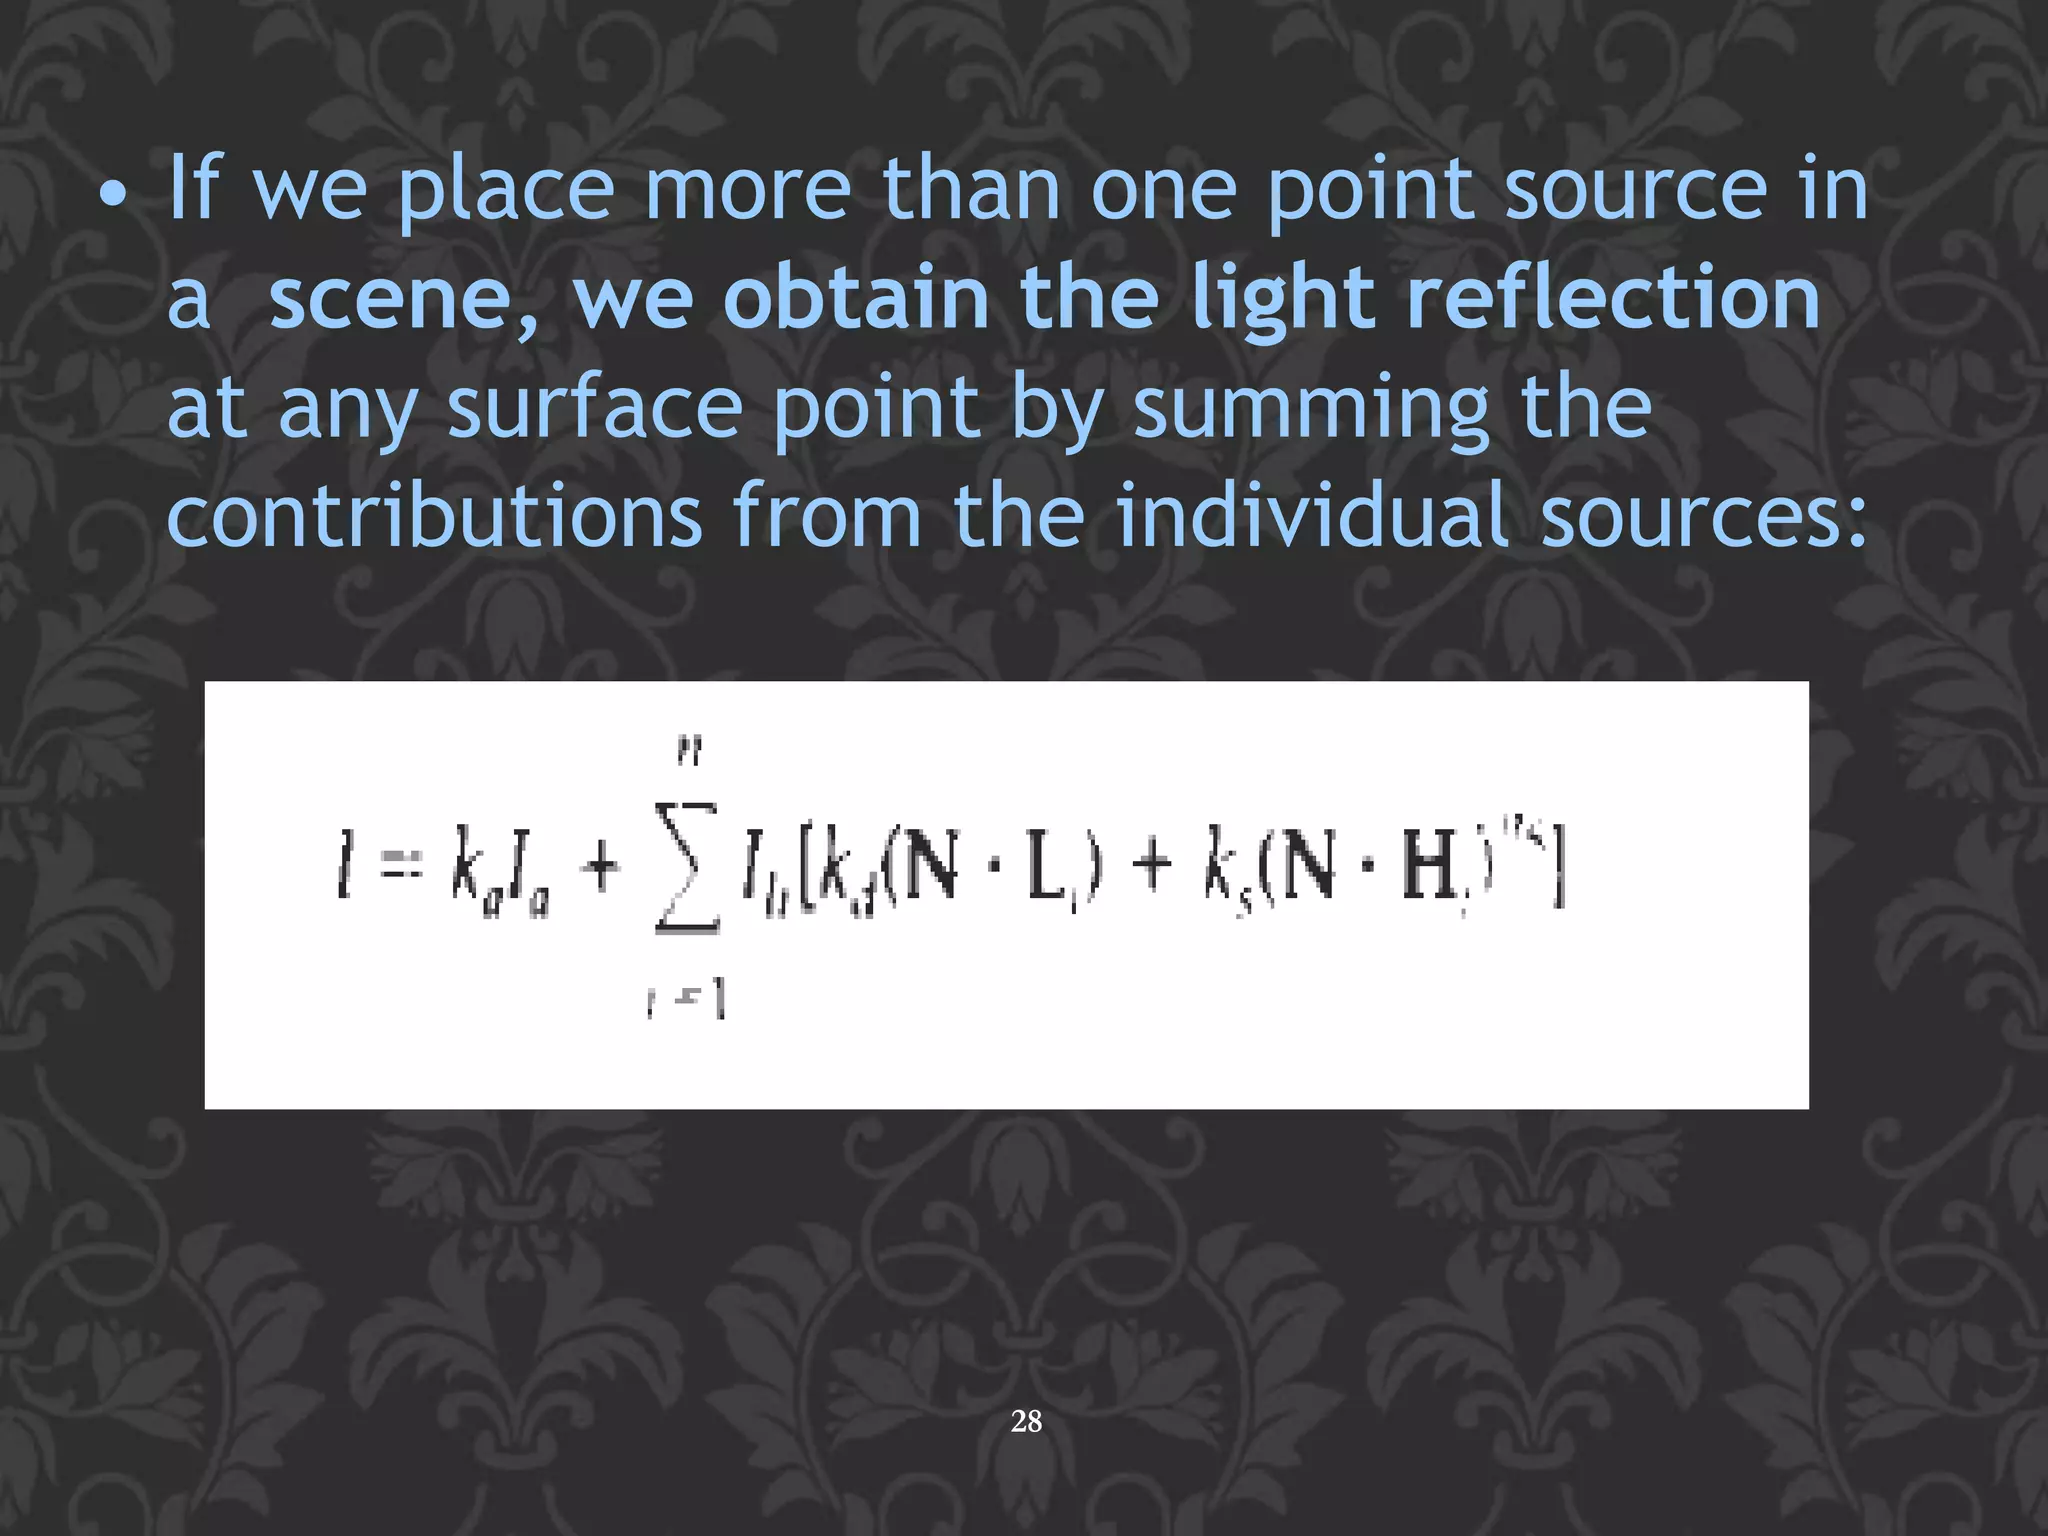
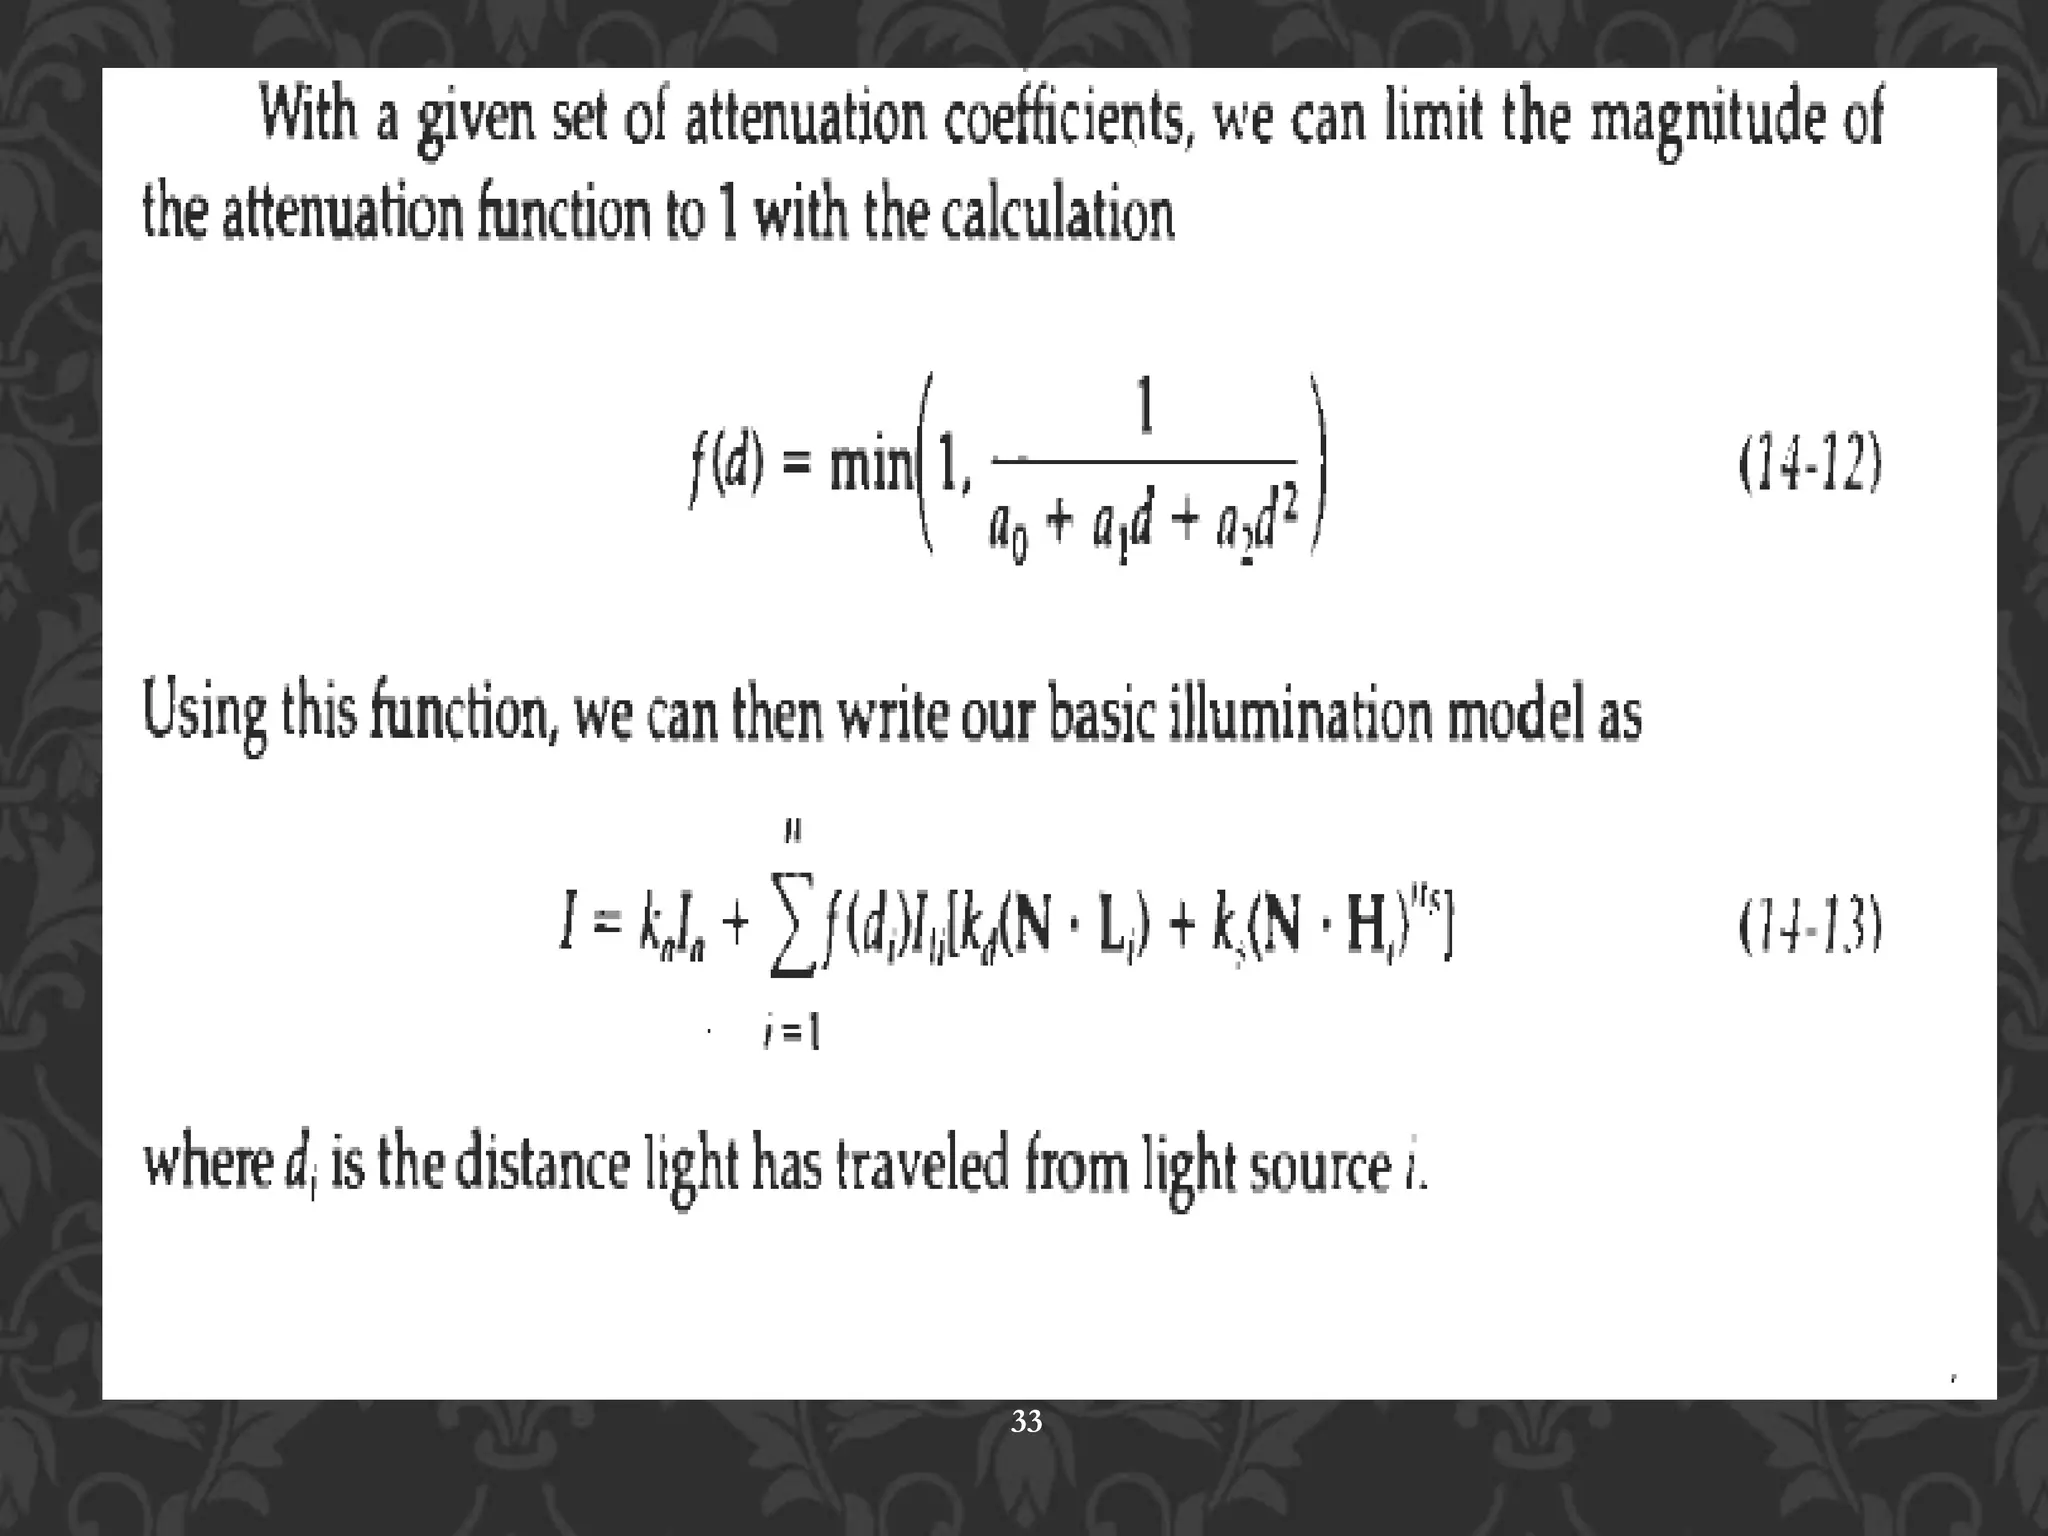
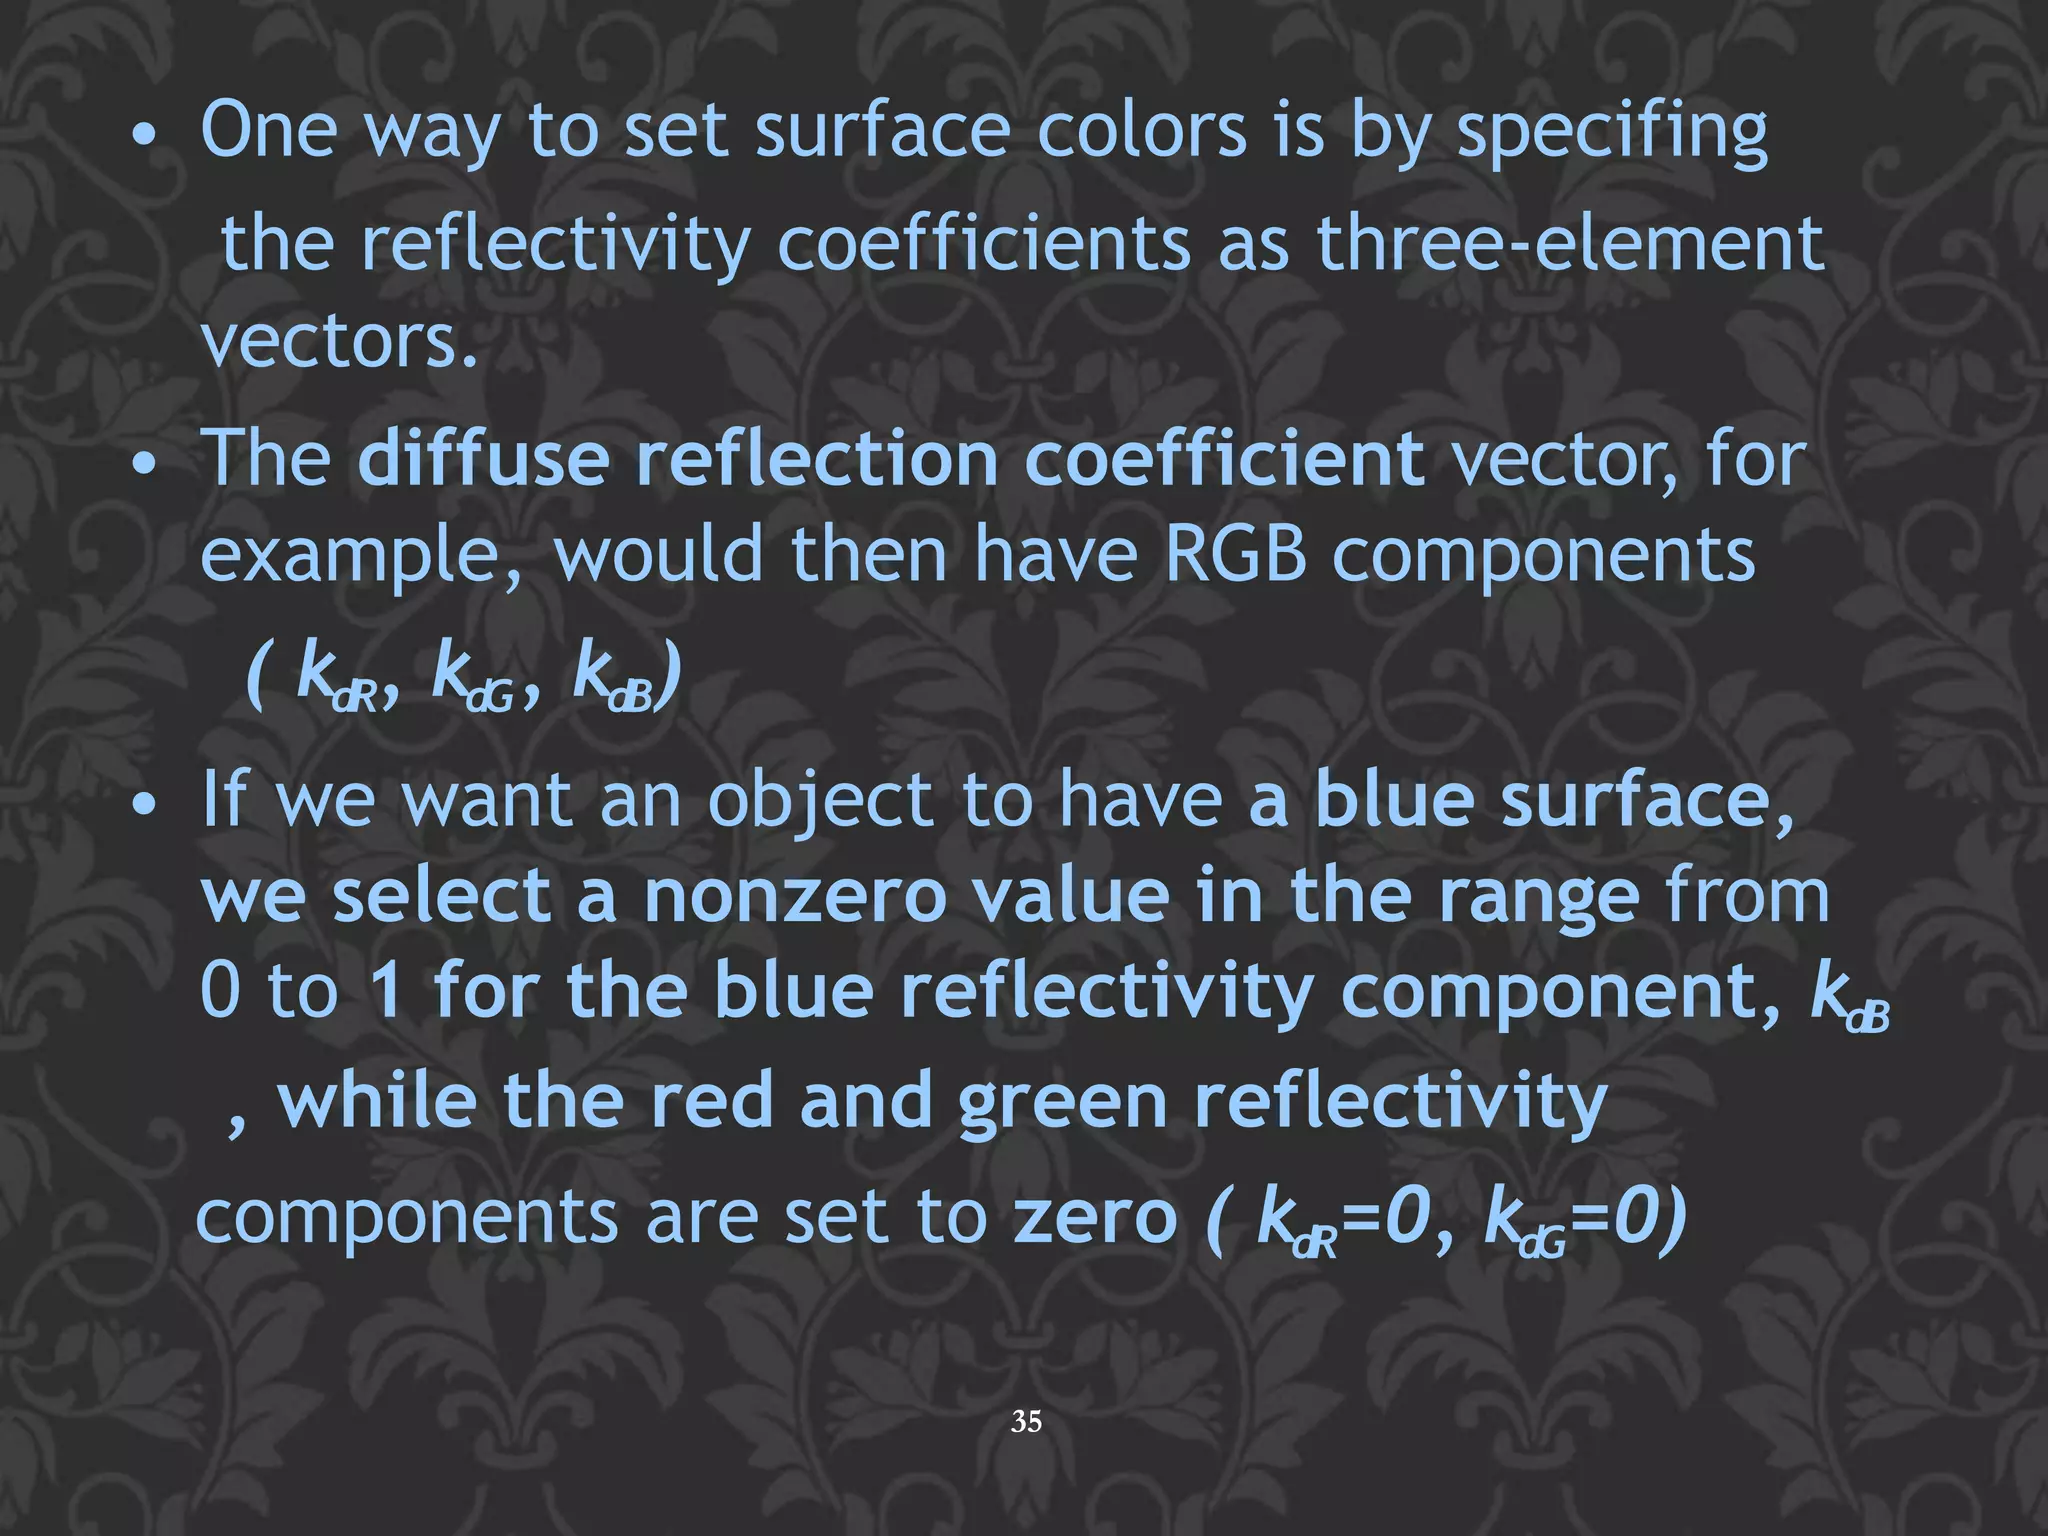
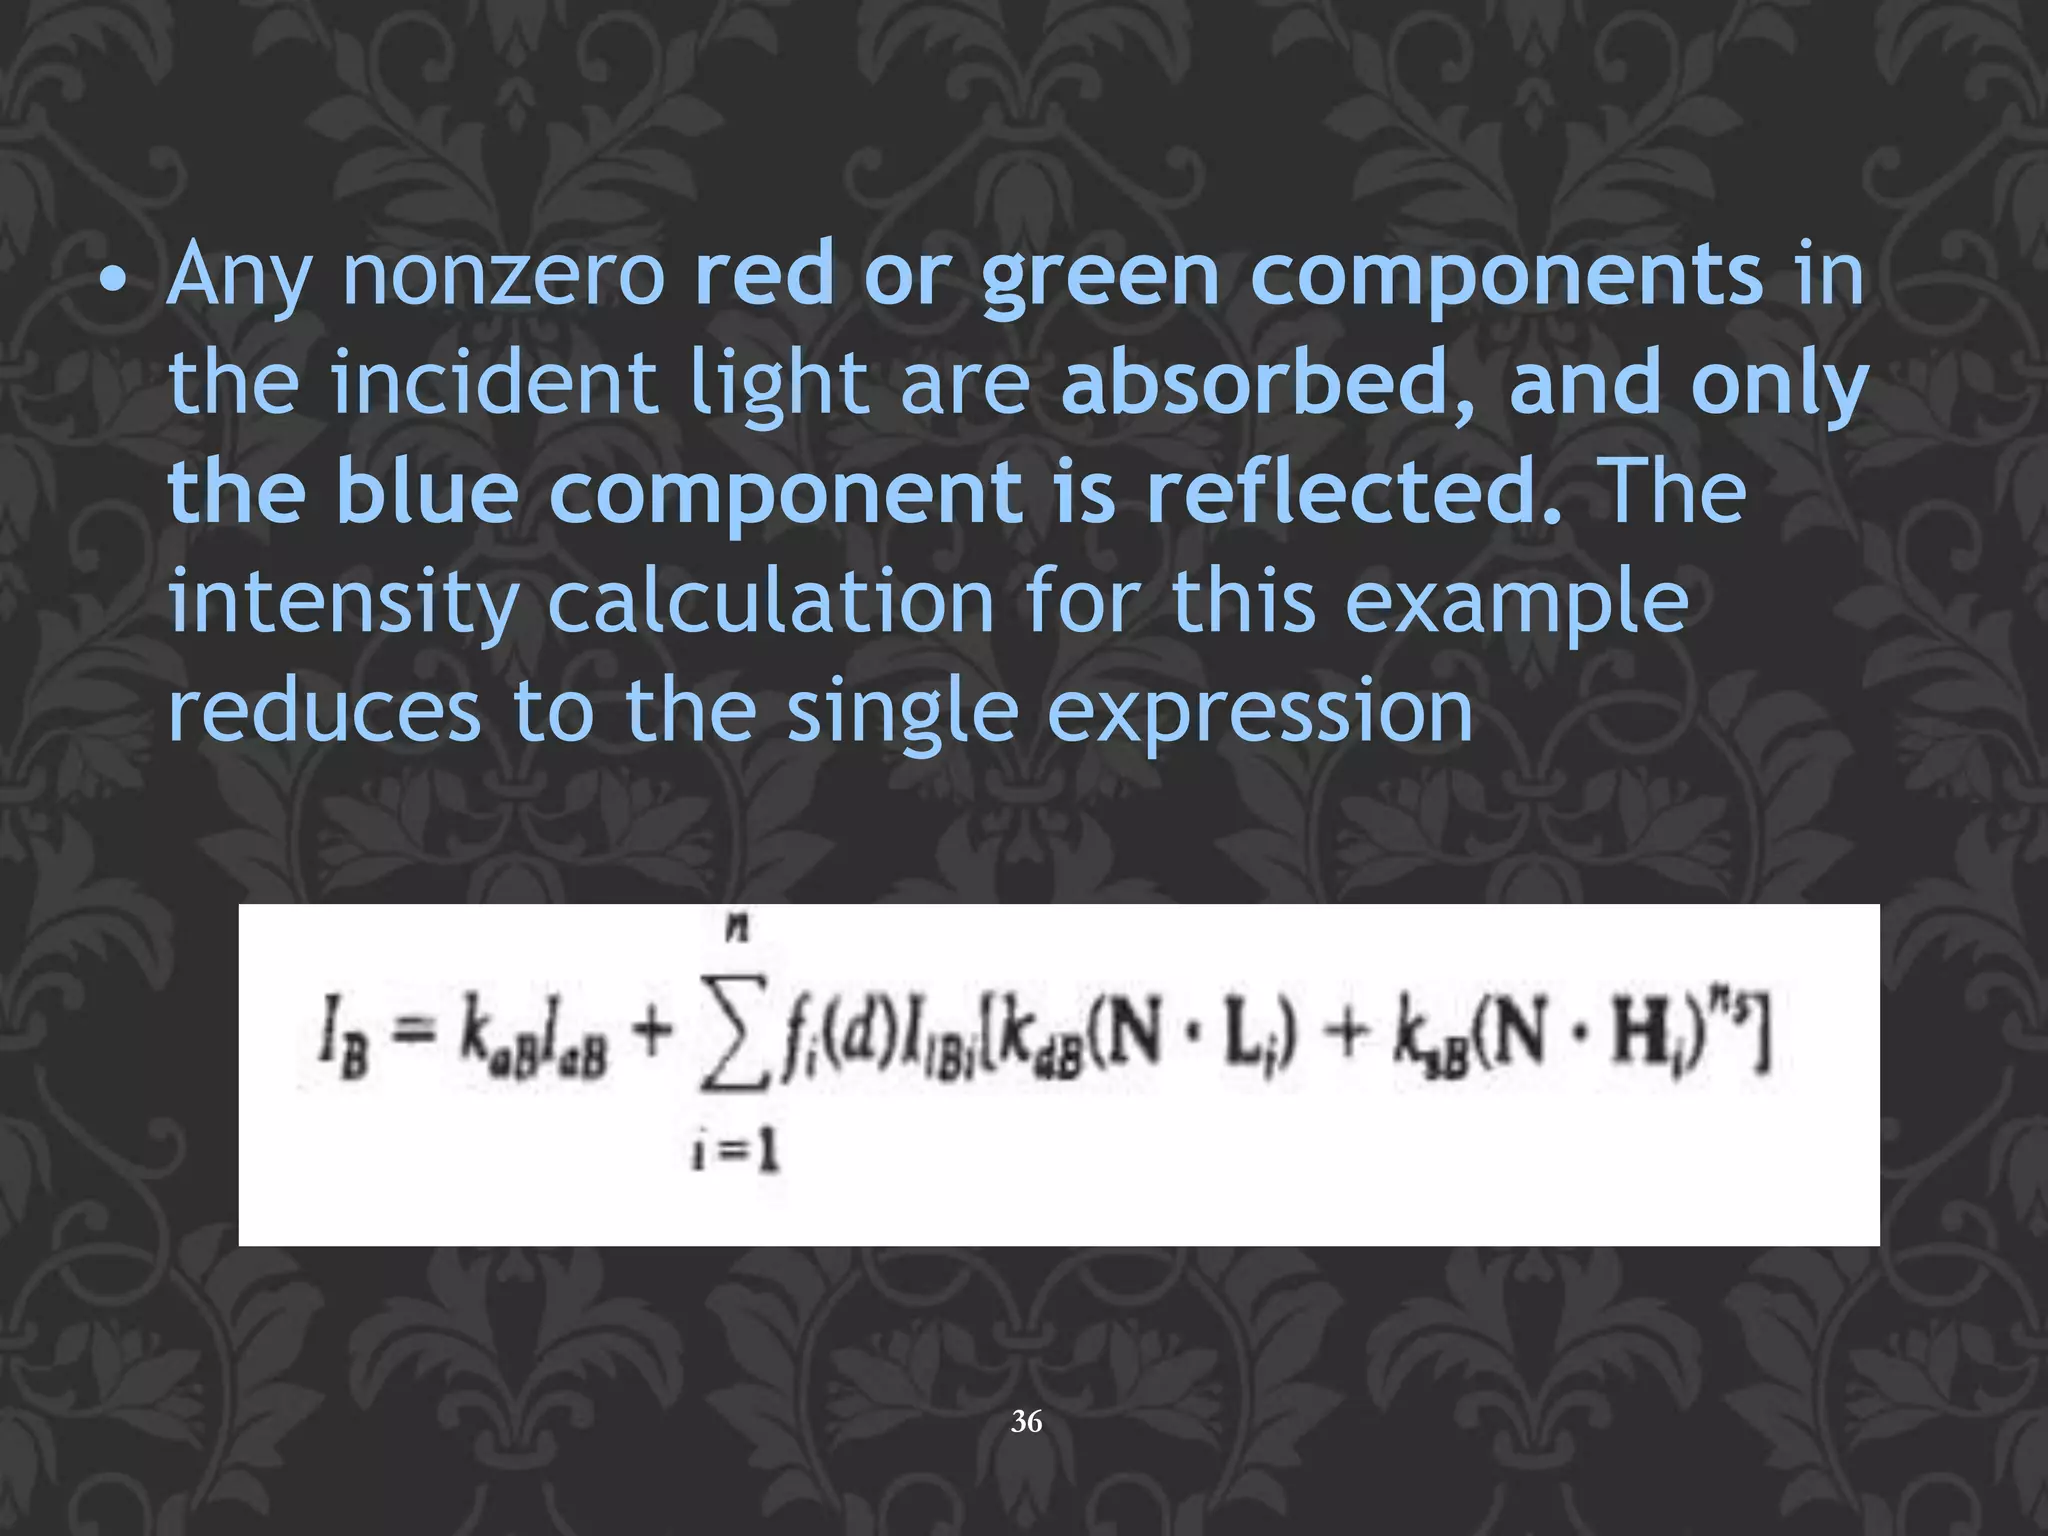
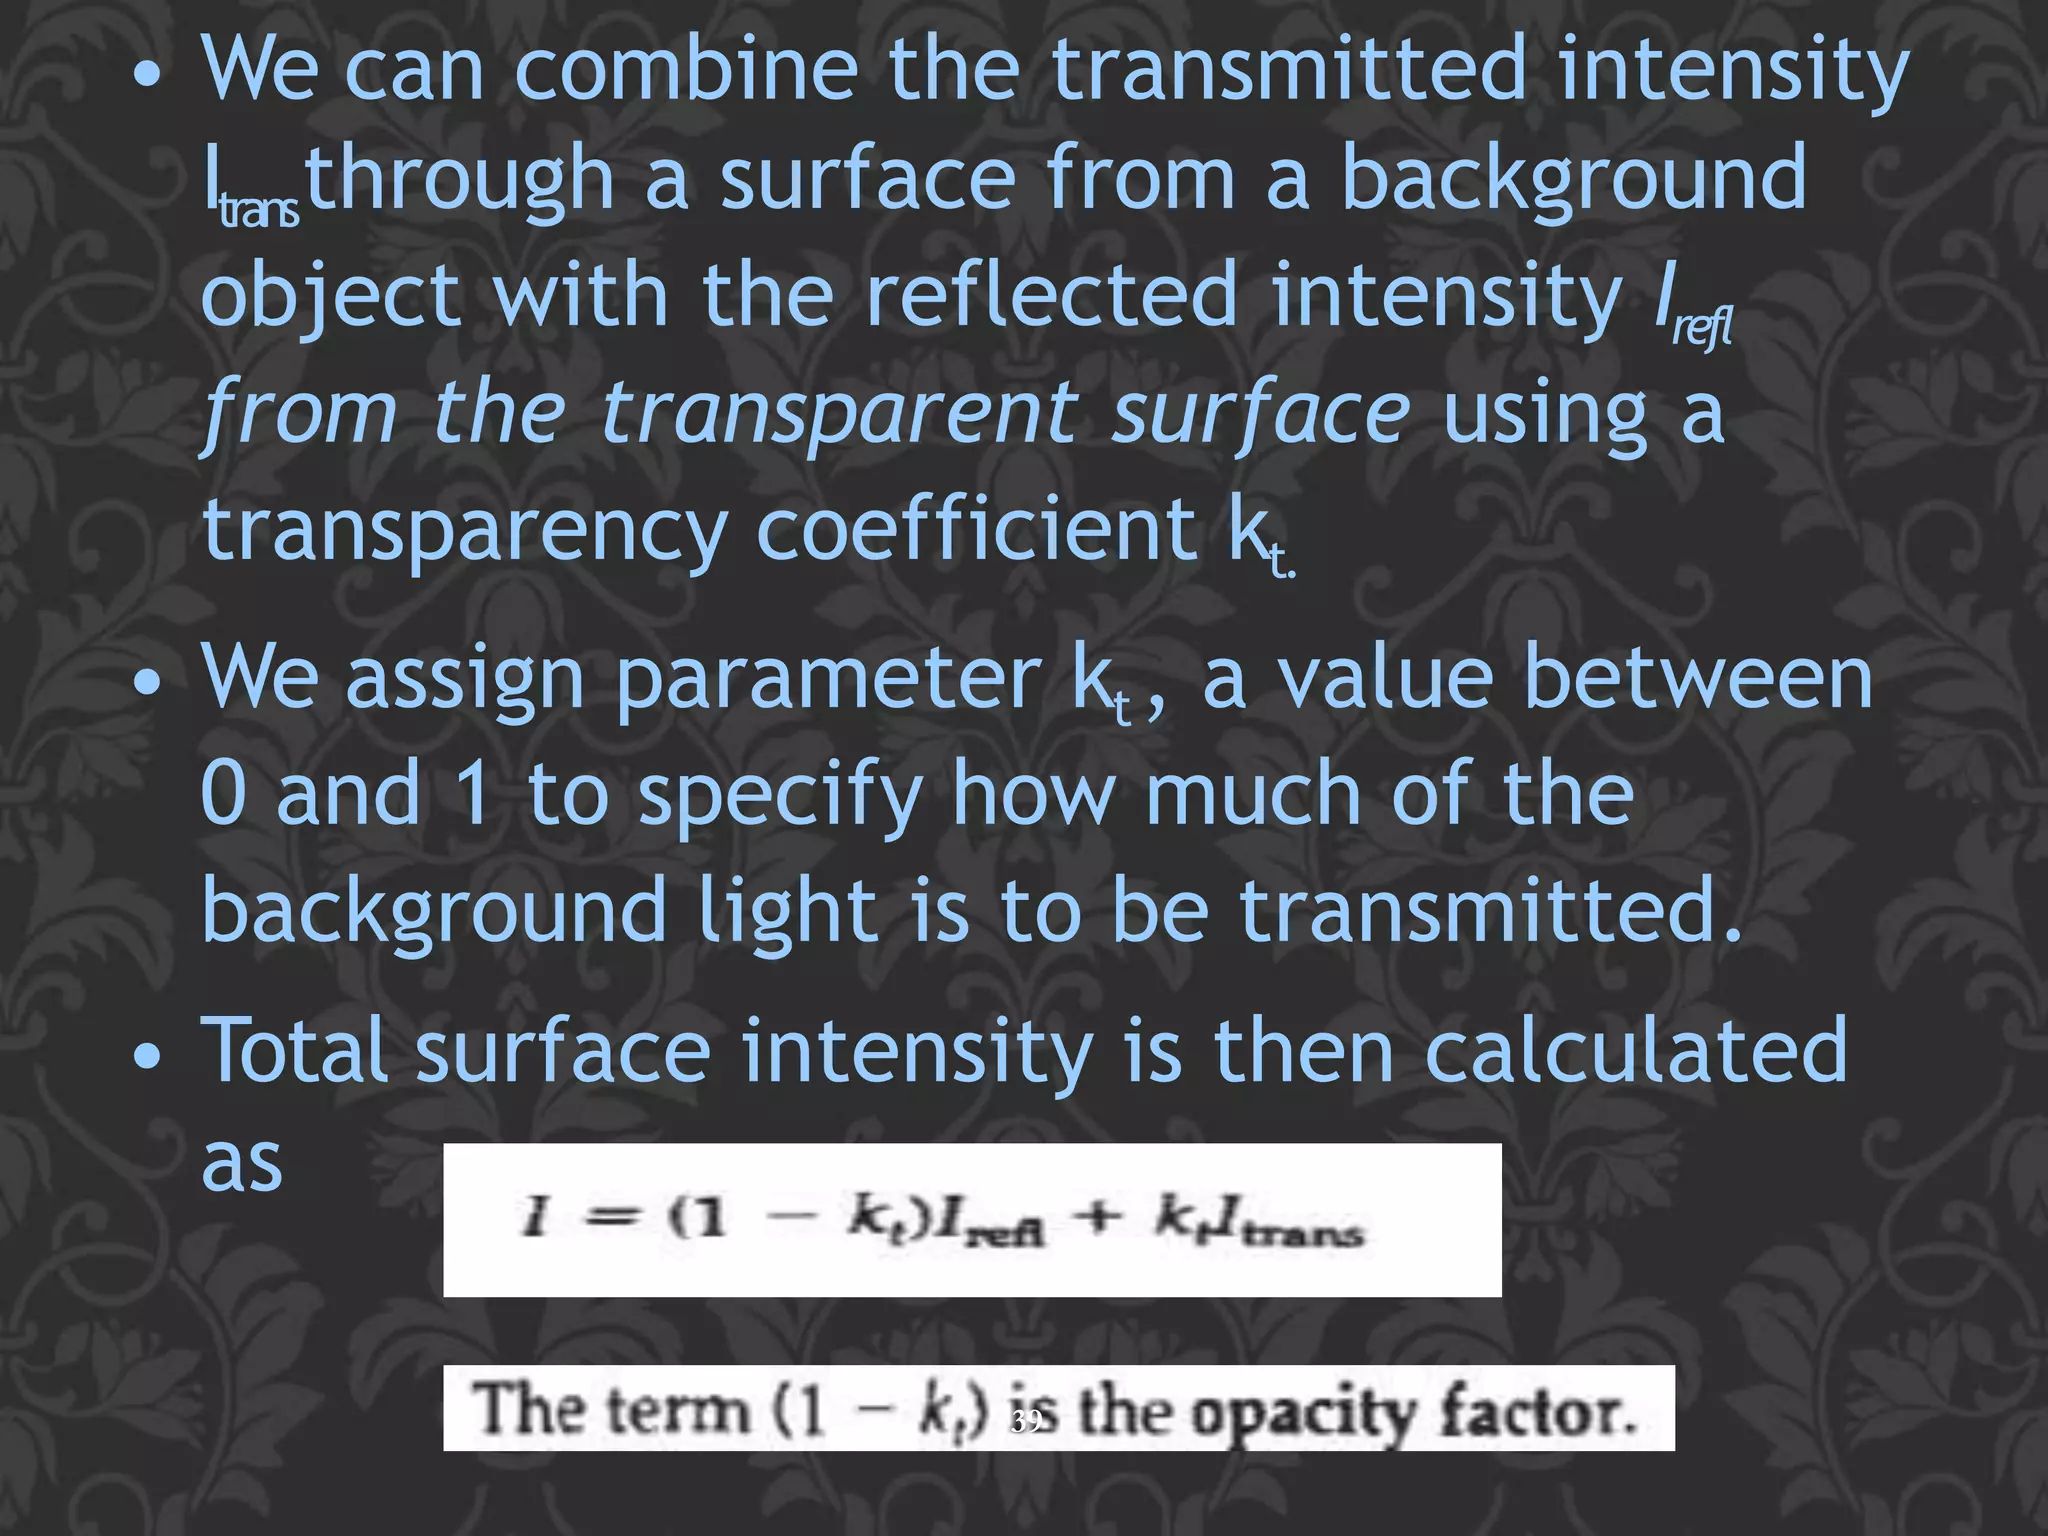
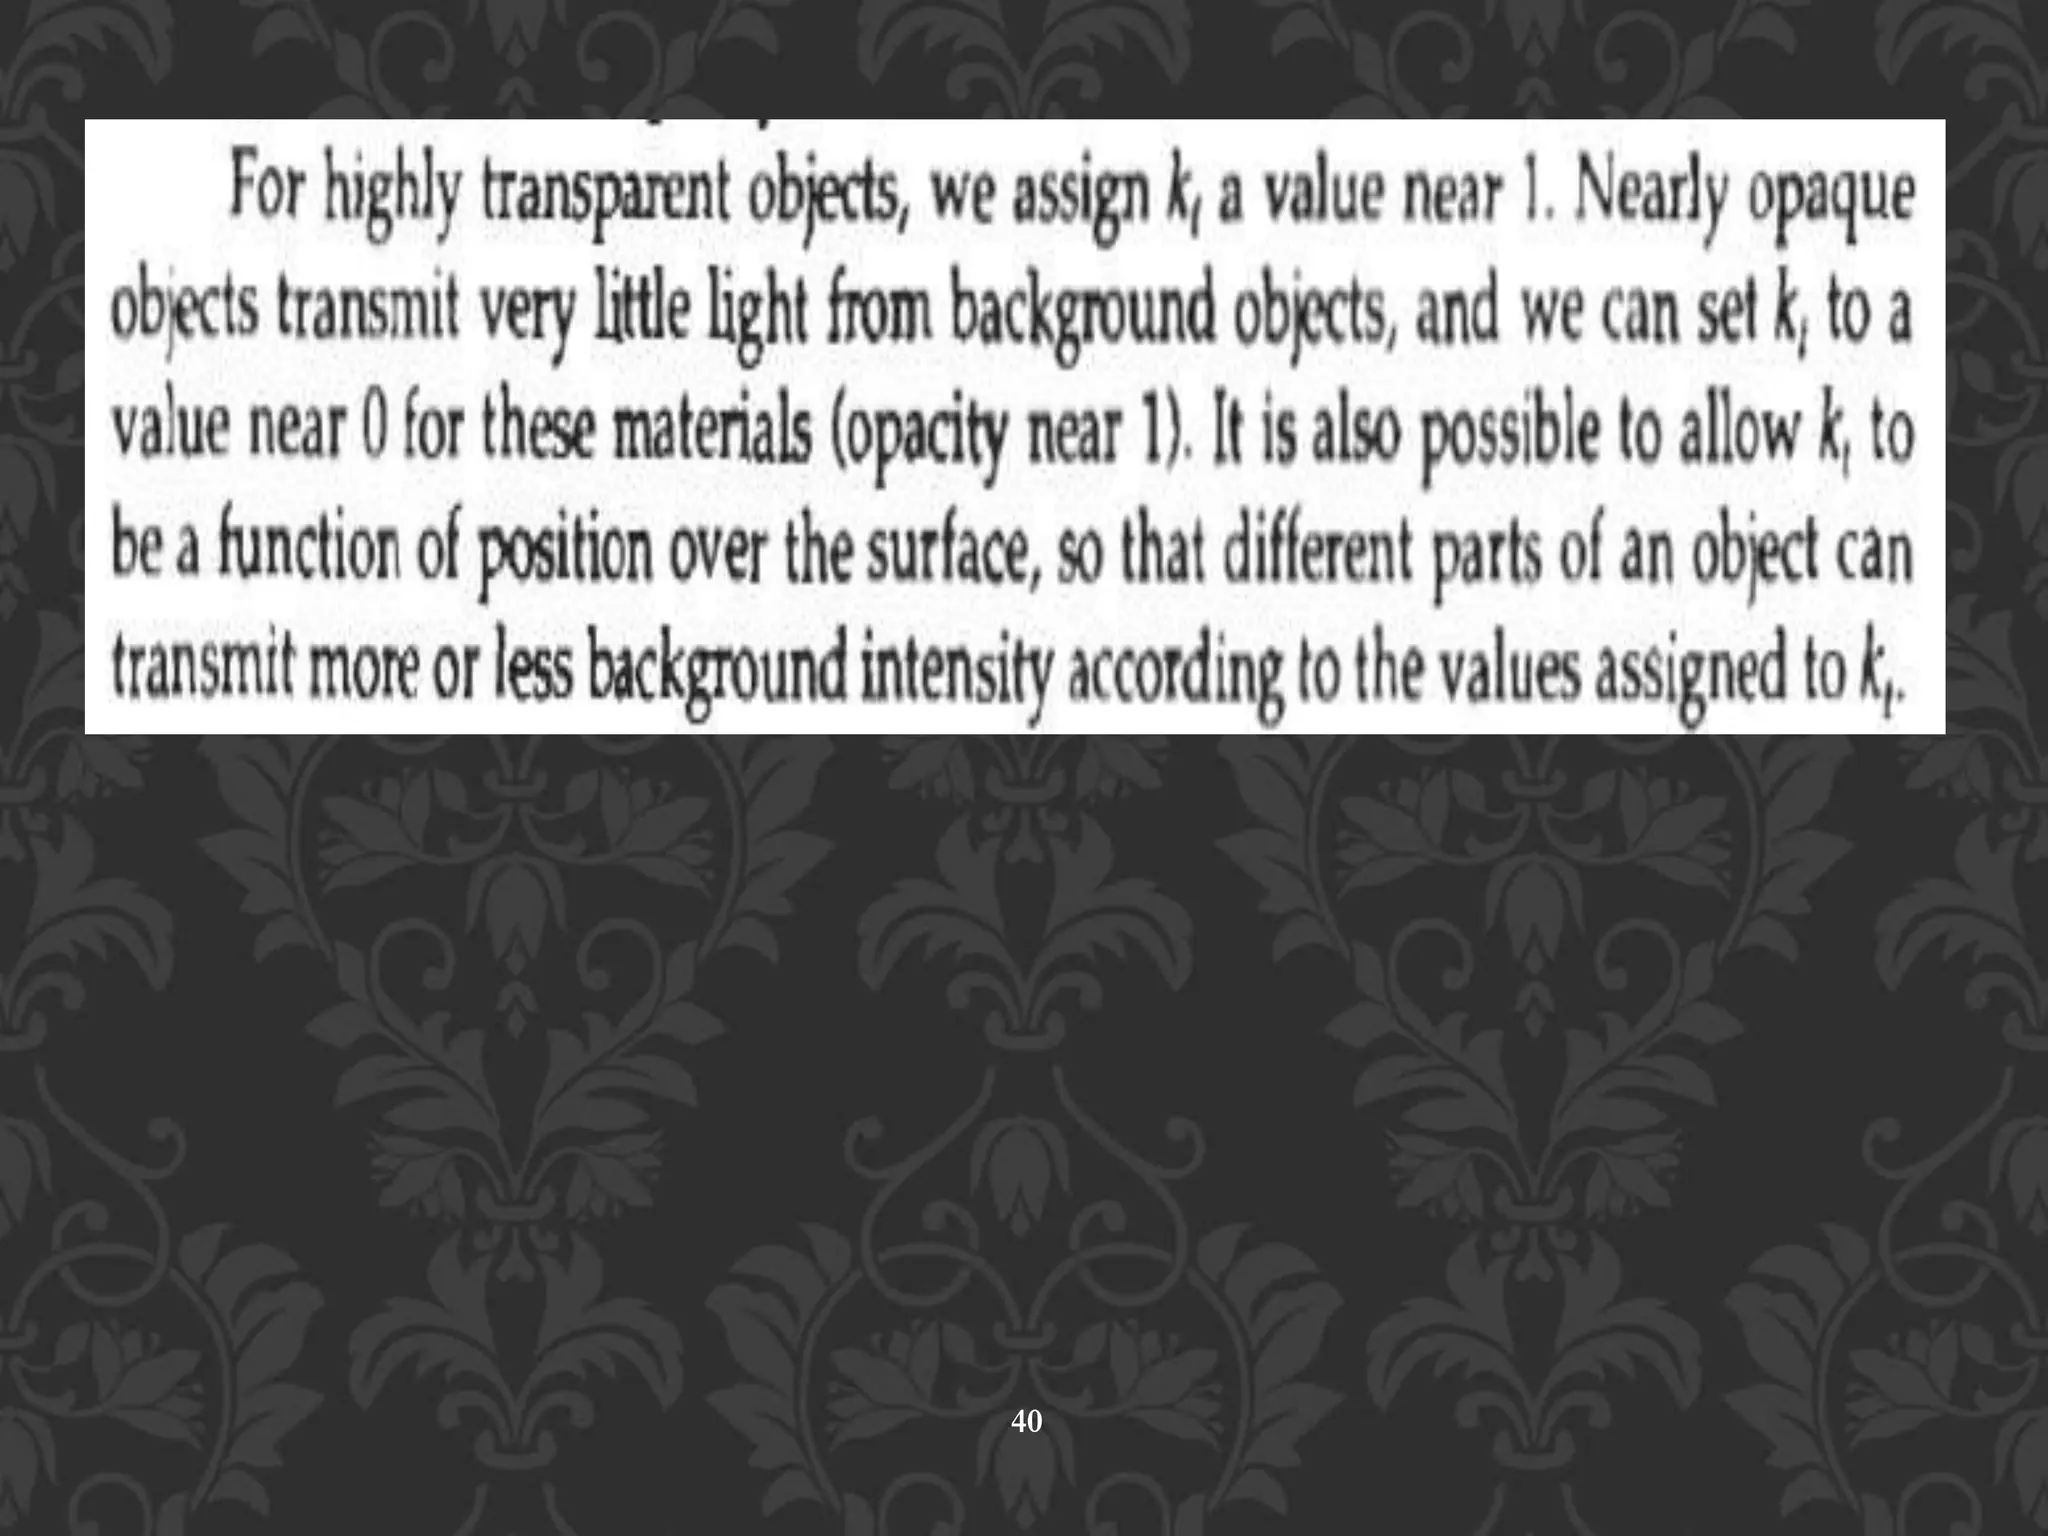
The document discusses illumination models used to calculate light intensity on object surfaces in 3D scenes. It describes how surface rendering uses illumination models to determine pixel intensities. Diffuse and specular reflection are explained along with parameters like ambient light, material properties, number of light sources, attenuation, and shadows. Color considerations and transparent surfaces are also covered at a high level.
An illumination model, also called a lighting model and sometimes referred to as a shading model, is used to calculate the intensity of light that we should see at a given point on the surface of an object.
Surface rendering means a procedure for applying a lighting model to obtain pixel intensities for all the projected surface positions in a scene.
A surface-rendering algorithm uses the intensity calculations from an illumination model to determine the light intensity for all projected pixel positions for the various surfaces in a scene.
Surface rendering can be performed by applying the illumination model to every visible surface point.
It gives the detailed information about Three Dimensional Display Methods, Three dimensional Graphics Package, Interactive Input Methods and Graphical User Interface, Input of Graphical Data, Graphical Data: Input Functions, Interactive Picture-Construction
a spline is a flexible strip used to produce a smooth curve through a designated set of points.
Polynomial sections are fitted so that the curve passes through each control point, Resulting curve is said to interpolate the set of control points.
Color fundamentals and color models - Digital Image ProcessingAmna
This presentation is based on Color fundamentals and Color models.
~ Introduction to Colors
~ Color in Image Processing
~ Color Fundamentals
~ Color Models
~ RGB Model
~ CMY Model
~ CMYK Model
~ HSI Model
~ HSI and RGB
~ RGB To HSI
~ HSI To RGB
Saudi Arabia stands as a titan in the global energy landscape, renowned for its abundant oil and gas resources. It's the largest exporter of petroleum and holds some of the world's most significant reserves. Let's delve into the top 10 oil and gas projects shaping Saudi Arabia's energy future in 2024.
Hybrid optimization of pumped hydro system and solar- Engr. Abdul-Azeez.pdffxintegritypublishin
Advancements in technology unveil a myriad of electrical and electronic breakthroughs geared towards efficiently harnessing limited resources to meet human energy demands. The optimization of hybrid solar PV panels and pumped hydro energy supply systems plays a pivotal role in utilizing natural resources effectively. This initiative not only benefits humanity but also fosters environmental sustainability. The study investigated the design optimization of these hybrid systems, focusing on understanding solar radiation patterns, identifying geographical influences on solar radiation, formulating a mathematical model for system optimization, and determining the optimal configuration of PV panels and pumped hydro storage. Through a comparative analysis approach and eight weeks of data collection, the study addressed key research questions related to solar radiation patterns and optimal system design. The findings highlighted regions with heightened solar radiation levels, showcasing substantial potential for power generation and emphasizing the system's efficiency. Optimizing system design significantly boosted power generation, promoted renewable energy utilization, and enhanced energy storage capacity. The study underscored the benefits of optimizing hybrid solar PV panels and pumped hydro energy supply systems for sustainable energy usage. Optimizing the design of solar PV panels and pumped hydro energy supply systems as examined across diverse climatic conditions in a developing country, not only enhances power generation but also improves the integration of renewable energy sources and boosts energy storage capacities, particularly beneficial for less economically prosperous regions. Additionally, the study provides valuable insights for advancing energy research in economically viable areas. Recommendations included conducting site-specific assessments, utilizing advanced modeling tools, implementing regular maintenance protocols, and enhancing communication among system components.
Automobile Management System Project Report.pdfKamal Acharya
The proposed project is developed to manage the automobile in the automobile dealer company. The main module in this project is login, automobile management, customer management, sales, complaints and reports. The first module is the login. The automobile showroom owner should login to the project for usage. The username and password are verified and if it is correct, next form opens. If the username and password are not correct, it shows the error message.
When a customer search for a automobile, if the automobile is available, they will be taken to a page that shows the details of the automobile including automobile name, automobile ID, quantity, price etc. “Automobile Management System” is useful for maintaining automobiles, customers effectively and hence helps for establishing good relation between customer and automobile organization. It contains various customized modules for effectively maintaining automobiles and stock information accurately and safely.
When the automobile is sold to the customer, stock will be reduced automatically. When a new purchase is made, stock will be increased automatically. While selecting automobiles for sale, the proposed software will automatically check for total number of available stock of that particular item, if the total stock of that particular item is less than 5, software will notify the user to purchase the particular item.
Also when the user tries to sale items which are not in stock, the system will prompt the user that the stock is not enough. Customers of this system can search for a automobile; can purchase a automobile easily by selecting fast. On the other hand the stock of automobiles can be maintained perfectly by the automobile shop manager overcoming the drawbacks of existing system.
CFD Simulation of By-pass Flow in a HRSG module by R&R Consult.pptxR&R Consult
CFD analysis is incredibly effective at solving mysteries and improving the performance of complex systems!
Here's a great example: At a large natural gas-fired power plant, where they use waste heat to generate steam and energy, they were puzzled that their boiler wasn't producing as much steam as expected.
R&R and Tetra Engineering Group Inc. were asked to solve the issue with reduced steam production.
An inspection had shown that a significant amount of hot flue gas was bypassing the boiler tubes, where the heat was supposed to be transferred.
R&R Consult conducted a CFD analysis, which revealed that 6.3% of the flue gas was bypassing the boiler tubes without transferring heat. The analysis also showed that the flue gas was instead being directed along the sides of the boiler and between the modules that were supposed to capture the heat. This was the cause of the reduced performance.
Based on our results, Tetra Engineering installed covering plates to reduce the bypass flow. This improved the boiler's performance and increased electricity production.
It is always satisfying when we can help solve complex challenges like this. Do your systems also need a check-up or optimization? Give us a call!
Work done in cooperation with James Malloy and David Moelling from Tetra Engineering.
More examples of our work https://www.r-r-consult.dk/en/cases-en/
Democratizing Fuzzing at Scale by Abhishek Aryaabh.arya
Presented at NUS: Fuzzing and Software Security Summer School 2024
This keynote talks about the democratization of fuzzing at scale, highlighting the collaboration between open source communities, academia, and industry to advance the field of fuzzing. It delves into the history of fuzzing, the development of scalable fuzzing platforms, and the empowerment of community-driven research. The talk will further discuss recent advancements leveraging AI/ML and offer insights into the future evolution of the fuzzing landscape.
Sachpazis:Terzaghi Bearing Capacity Estimation in simple terms with Calculati...Dr.Costas Sachpazis
Terzaghi's soil bearing capacity theory, developed by Karl Terzaghi, is a fundamental principle in geotechnical engineering used to determine the bearing capacity of shallow foundations. This theory provides a method to calculate the ultimate bearing capacity of soil, which is the maximum load per unit area that the soil can support without undergoing shear failure. The Calculation HTML Code included.
COLLEGE BUS MANAGEMENT SYSTEM PROJECT REPORT.pdfKamal Acharya
The College Bus Management system is completely developed by Visual Basic .NET Version. The application is connect with most secured database language MS SQL Server. The application is develop by using best combination of front-end and back-end languages. The application is totally design like flat user interface. This flat user interface is more attractive user interface in 2017. The application is gives more important to the system functionality. The application is to manage the student’s details, driver’s details, bus details, bus route details, bus fees details and more. The application has only one unit for admin. The admin can manage the entire application. The admin can login into the application by using username and password of the admin. The application is develop for big and small colleges. It is more user friendly for non-computer person. Even they can easily learn how to manage the application within hours. The application is more secure by the admin. The system will give an effective output for the VB.Net and SQL Server given as input to the system. The compiled java program given as input to the system, after scanning the program will generate different reports. The application generates the report for users. The admin can view and download the report of the data. The application deliver the excel format reports. Because, excel formatted reports is very easy to understand the income and expense of the college bus. This application is mainly develop for windows operating system users. In 2017, 73% of people enterprises are using windows operating system. So the application will easily install for all the windows operating system users. The application-developed size is very low. The application consumes very low space in disk. Therefore, the user can allocate very minimum local disk space for this application.
Student information management system project report ii.pdfKamal Acharya
Our project explains about the student management. This project mainly explains the various actions related to student details. This project shows some ease in adding, editing and deleting the student details. It also provides a less time consuming process for viewing, adding, editing and deleting the marks of the students.
Vaccine management system project report documentation..pdfKamal Acharya
The Division of Vaccine and Immunization is facing increasing difficulty monitoring vaccines and other commodities distribution once they have been distributed from the national stores. With the introduction of new vaccines, more challenges have been anticipated with this additions posing serious threat to the already over strained vaccine supply chain system in Kenya.
2. • An illumination model, also called a
lighting model and sometimes referred to
as a shading model, is used to calculate
the intensity of light that we should see
at a given point on the surface of an
object.
• Surface rendering means a procedure for
applying a lighting model to obtain
pixel intensities for all the projected
surface positions in a scene.
2
3. • A surface-rendering algorithm uses the
intensity calculations from an
illumination model to determine the light
intensity for all projected pixel positions
for the various surfaces in a scene.
• Surface rendering can be performed by
applying the illumination model to every
visible surface point
3
4. 4
• light sources are referred to as light-
emitting
sources; and reflecting surfaces, such as the
walls of a room, are termed light-
reflecting sources
• A luminous object, in general, can be both
a light source and a light reflector.
• The simplest model for a light emitter is a
point source.
Light Sources
5. • When light is incident on an opaque
surface, part of it is reflected and part is
absorbed.
• The amount of incident light reflected by
a surface depends on the type of
material. Shiny materials reflect more
of the incident light, and dull surfaces
absorb more of the incident light.
• for an illuminated transparent surface,
some of the incident light will be
reflected and some will be transmitted
through the material 5
6. • Surfaces that are rough, or grainy, tend
to scatter the reflected light in all
directions.
This scattered light is called diffuse
reflection.
• In addition to diffuse reflection, light
sources create highlights, or bright spots,
called specular reflection.
• This highlighting effect is more
pronounced on shiny surfaces than o6n dull
7. Ambient Light
7
• In our basic illumination model, we can set a
general level of brightness for a scene. This is a
simple way to model the combination of light
reflections from various surfaces to produce a
uniform illumination called the ambient light,
or background light.
• Ambient light has no spatial or directional
characteristics. The amount of ambient light
incident on each object is a constant for all
surfaces and over all directions.
8. DIFFUSE REFLECTION
8
• Diffuse reflections are constant over each
surface in a scene
• The fractional amount of the incident light
that is diffusely reflected can be set for
each surface with parameter kd, the
diffuse-reflection coefficient, or diffuse
reflectivity.
9. • Parameter kdis assigned a constant
value in the interval 0 to 1.
• we want a highly reflective surface, we
set the value of kdnear 1. This produces
a bright surface with the intensity of the
reflected light near that of the incident
light.
• To simulate a surface that absorbs most
of the incident light, we set the
reflectivity to a value near 0. 9
10. • If a surface is exposed only to ambient
light, we can express the intensity of the
diffuse reflection at any point on the
surface as
10
I ambdiff= k d I a
11. • we assume that the diffuse reflections
from the surface are scattered with equal
intensity in all directions, independent of
the viewing directions.
• Such surfaces are sometimes referred to
as ideal diffuse reflectors. They are also
called Lambertian reflectors, since
radiated light energy from any point on
the surface is governed by Lambert’s
cosine law.
11
12. • If we denote the angle of incidence
between the incoming light direction and
the surface normal as ϴ, then the
projected area of a
surface patch perpendicular to the light
direction is proportional to cos ϴ .
12
13. Thus, the amount of illumination (or the
"number of incident light rays" cutting across
the projected surface patch) depends on cos ϴ.
• If the incoming light from the source is
perpendicular to the surface at a particular
point, that point is fully illuminated.
• As the angle of illumination moves away from
the surface normal, the brightness of the point
drops off. 13
14. • If Il, is the intensity of the point light source,
then the diffuse reflection equation for a point
on the surface can be written as
I l ,diff= k d I lcos ϴ
• A surface is illuminated by a point source
only if the angle of incidence is in the
range 0° to 90 ° (cos 0 is in the interval
from 0 to 1).
• When cos ϴ is negative, the light source
is "behind" the surface.
14
16. • If N is the unit normal vector to a surface
and L is the unit direction vector to the
point light source from a position on the
surface, then
cos ϴ = N . L
and the diffuse reflection equation for
single point-source illumination is
16
I l ,diff= k d I lN. L
17. • We can combine the ambient and point
source intensity calculations to obtain an
expression for the total diffuse
reflection.
• In addition, many graphics packages
introduce an ambient-reflection
coefficient kato modify the ambient
light intensity I, for each surface. This
simply provides us with an additional
parameter to adjust the light conditions
in a scene. 17
18. • Using parameter kawe can write the total
diffuse reflection equation as
18
I l,diff= k a I a + k dI l( N. L)
• where both k aand k ddepend on surface
material properties and are assigned
values
in the range from 0 to 1
19. SPECULAR REFLECTION AND THE
PHONG MODEL
19
• we see a highlight, or bright spot, at
certain viewing directions. This
phenomenon, called specular reflection,
is the result of total, or near total
reflection of the incident light in a
concentrated region around the specular
reflection angle.
• The specular-reflection angle equals the
angle of the incident light.
21. • In this figure, we use R to represent the unit
vector in the direction of ideal specular
reflection; L to represent the unit vector
directed toward the point light source; and V as
the unit vector pointing to the viewer from the
surface position.
• Angle ϴ is the viewing angle relative to the
specular-reflection direction R.
• For an ideal reflector (perfect mirror), incident
light is reflected only in the specular-reflection
direction. In this case, we would only see
reflected light when vectors V and R coincide
(ϴ = 0).
21
22. • Phong model, sets the intensity of specular
reflection proportional to cos nsϴ.
• Angle ϴ can be assigned values in the range 0
to 90, so that cos ϴ varies from 0 to 1.
• The value assigned to specular-reflection
parameter nsis determined by the type of
surface that we want to display.
• A very shiny surface is modeled with a large
value for ns(say, 100 or more), and smaller
values (down to 1) are used for duller
surfaces.
• For a perfect reflector, nsis infinite.
22
23. • We can approximately model
monochromatic
specular intensity variations using a specular-
reflection coefficient, W(ϴ) for each surface.
• In general, W(ϴ) tends to increase as the
angle of incidence increases.
• Using the spectral-reflection function W(ϴ),
lar-
Reflection we can write the Phong specu on
model as
23
24. • Since V and R are unit vectors in the
viewing and specular-reflection
directions,
we can calculate the value of cos ϴ with
V . R
• Assuming the specular-reflection
coefficient is a constant, we can
determine the intensity of
the specular reflection at a surface point
with the calculation
I spec= ksIl( V.R ) ns
24
25. • simplified Phong model is obtained by
using the halfway vector H between L and
V to calculate the range of specular
reflections.
• If we replace V.R in the Phong model with
the dot product N . H, this simply
replaces the empirical cos ϴ calculation
with the empirical cos α calculation
25
28. • If we place more than one point source in
a scene, we obtain the light reflection
at any surface point by summing the
contributions from the individual sources:
28
29. Warn Model
29
• The Warn model provides a method for
simulating studio lighting effects by
controlling light intensity in different
directions.
• Light sources are modeled as points on a
reflecting surface, using the Phong model
for the surface points.
• Then the intensity in different directions
is controlled by selecting values for the
Phong exponent
30. • In addition, light controls and
spotlighting, used by studio
photographers can be simulated in the
Warn model.
• Flaps are used to control the amount of
light emitted by a source In various
directions
30
31. Intensity Attenuation
31
• As radiant energy from a point light
source travels through space, its
amplitude is attenuated by the factor
l/d2, where d is the distance that the
light has travelled.
• This means that a surface close to the
light source (small d) receives a higher
incident
intensity from the source than a distant
surface (large d).
32. A user can then fiddle with the coefficients ao, a1,
and a2 , to obtain a variety of lighting effects for
a scene. The value of the constant term ao can be
adjusted to
prevent f(d) from becoming too large when d is
very small.
• a general inverse quadratic attenuation
function can be set up as
32
34. Colour Considerations
34
• Most graphics displays of realistic scenes
are in colour. But the illumination model
discussed so far considers only
monochromatic lighting effects.
• To incorporate colour, we need to write
the intensity equation as a function of
the colour
properties of the light sources and object
surfaces.
35. • One way to set surface colors is by specifing
the reflectivity coefficients as three-element
vectors.
• The diffuse reflection coefficient vector, for
example, would then have RGB components
( kdR, kdG, kdB)
• If we want an object to have a blue surface,
we select a nonzero value in the range from
0 to 1 for the blue reflectivity component, kdB
, while the red and green reflectivity
components are set to zero ( kdR=0, kdG=0)
35
36. • Any nonzero red or green components in
the incident light are absorbed, and only
the blue component is reflected. The
intensity calculation for this example
reduces to the single expression
36
37. • Surfaces typically are illuminated with white light
sources, and in general we can set surface color so
that the reflected light has nonzero values for all
three RGB components.
• Calculated intensity levels for each color
component can be used to adjust the
corresponding electron gun in an RGB monitor.
• In his original specular-reflection model, Phong set
parameter ks to a constant value independent of
the surface color. This produces specular
reflections that are the same color as the incident
light (usually white),
37
38. Transparency
38
• A transparent surface, in general,
produces both reflected and transmitted
light.
• The relative contribution of the
transmitted light depends on the degree
of transparency of the surface and
whether any light sources or illuminated
surfaces are behind the transparent
surface
39. • We can combine the transmitted intensity
Itransthrough a surface from a background
object with the reflected intensity Irefl
from the transparent surface using a
transparency coefficient kt.
• We assign parameter kt, a value between
0 and 1 to specify how much of the
background light is to be transmitted.
• Total surface intensity is then calculated
as
39
41. Shadows
41
• By applying a hidden-surface method with a
light source at the view position, we can
determine which surface sections cannot be
"seen" from the light source.
• These are the shadow areas.
• Once we have determined the shadow
areas for all light sources, the shadows
could be treated as surface patterns and
stored in pattern arrays
42. • Surfaces that are visible from the view
position are shaded according to the
lighting
model, which can be combined with
texture patterns.
• We can display shadow areas with
ambient-light intensity only, or we can
combine the ambient light with specified
surface textures.
42