Downloaded 113 times
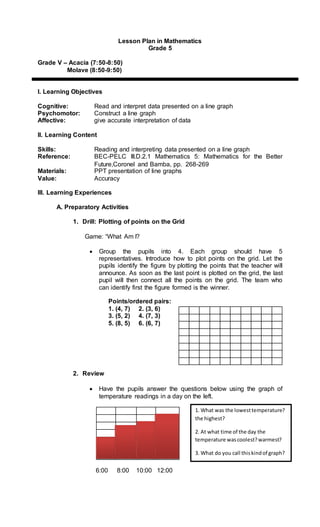

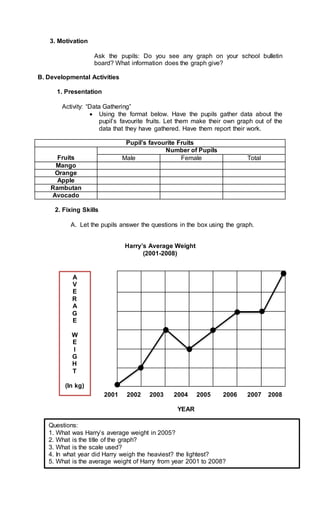
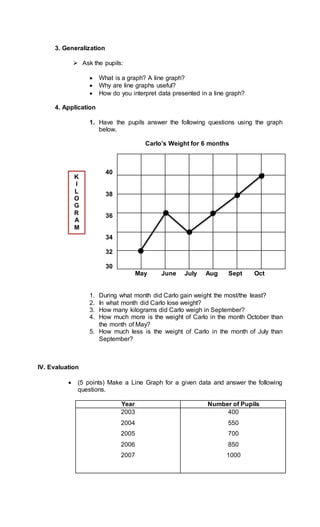

This lesson plan teaches students how to read and construct line graphs using data about temperature readings, weight measurements, and school enrollment numbers. Students will practice plotting points, interpreting existing line graphs, gathering and presenting data in a graph of their own, answering questions about given line graphs, and defining what makes an effective line graph. The lesson aims to build students' cognitive, psychomotor and affective skills for accurately working with line graph data representations.


![Lesson Plan in Math 6 for Demo-Teaching [Division of Integers]](https://cdn.slidesharecdn.com/ss_thumbnails/lessonplaninmathematics6divisionofintegers-190930130204-thumbnail.jpg?width=640&height=640&fit=bounds)