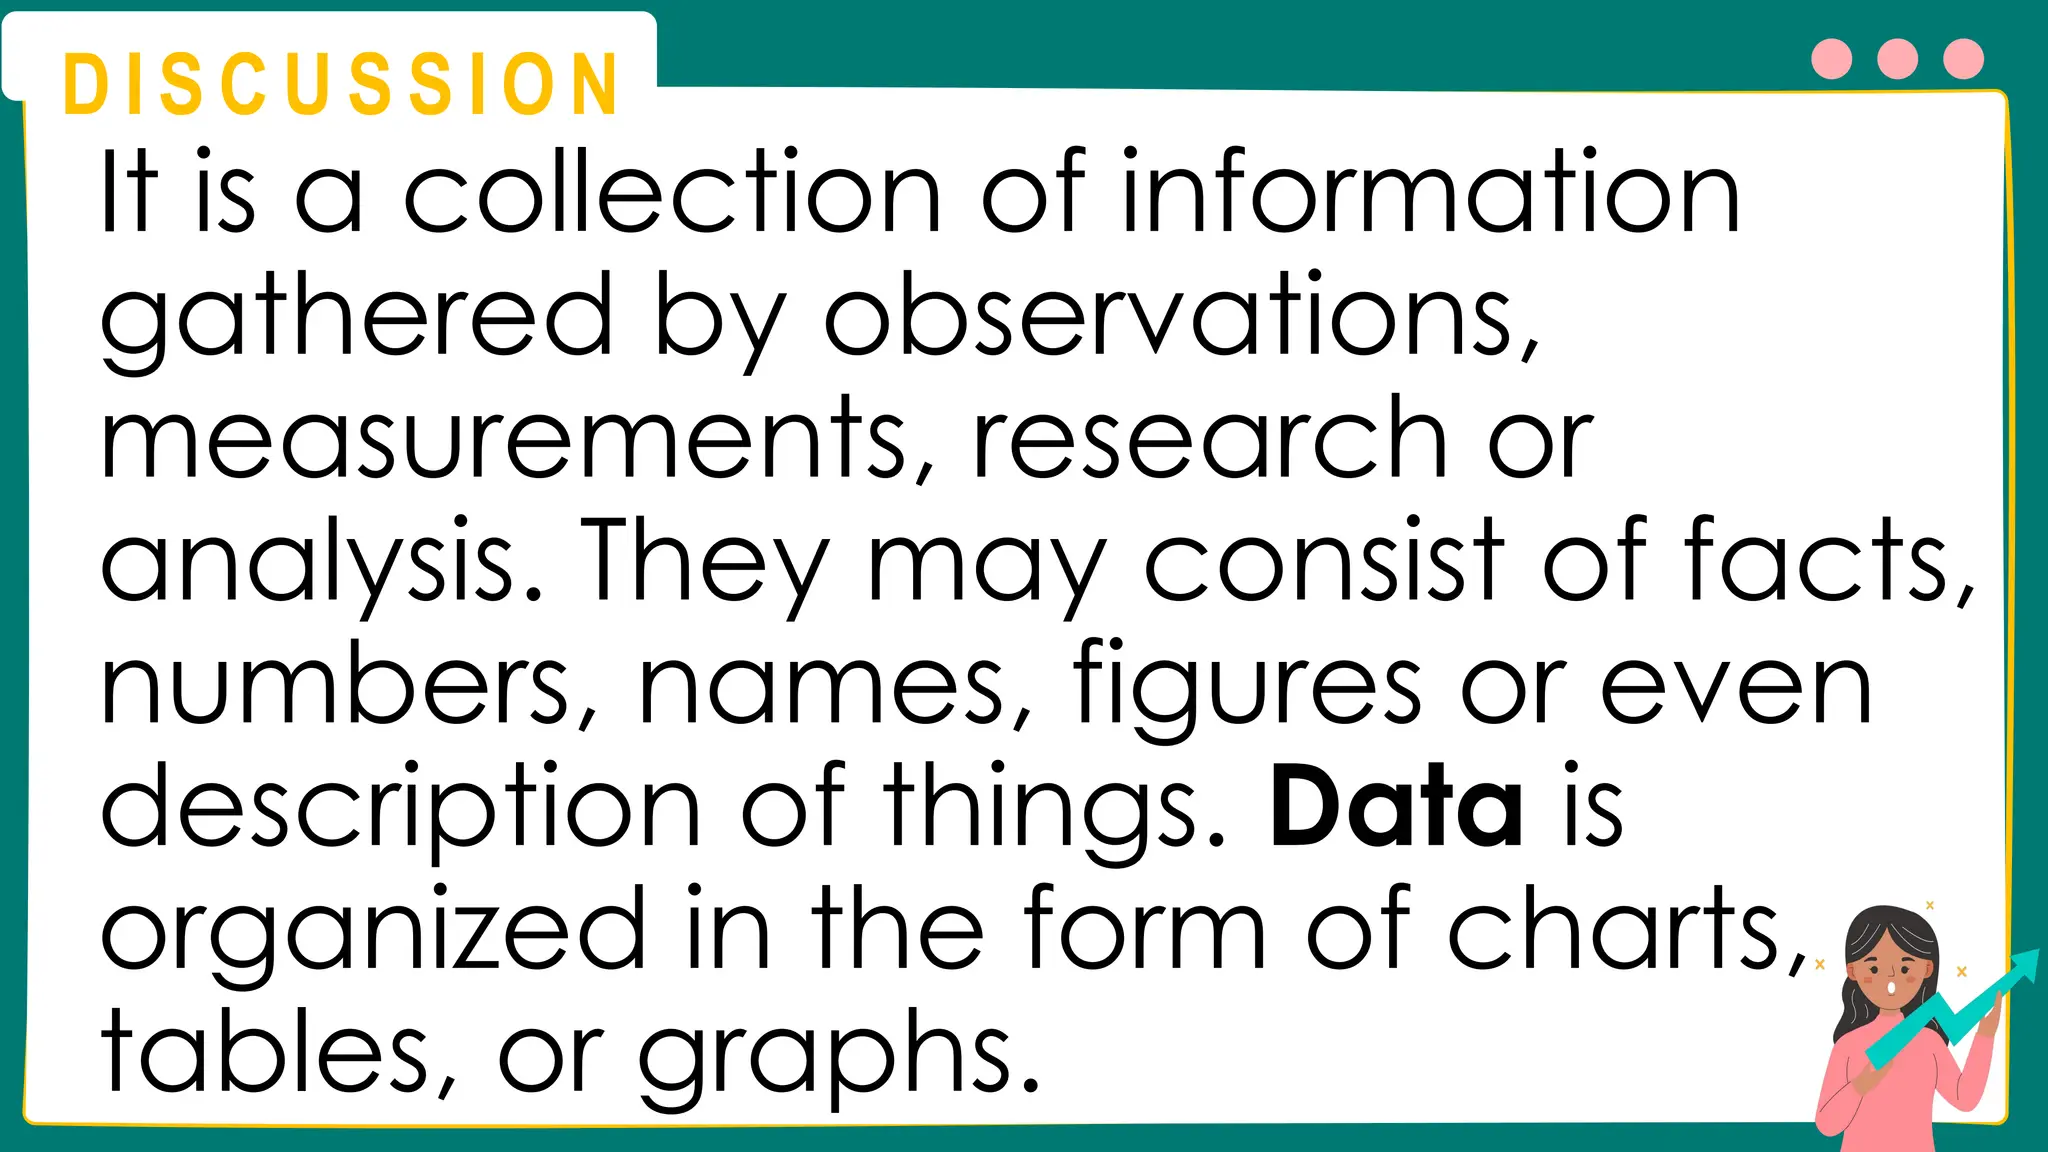
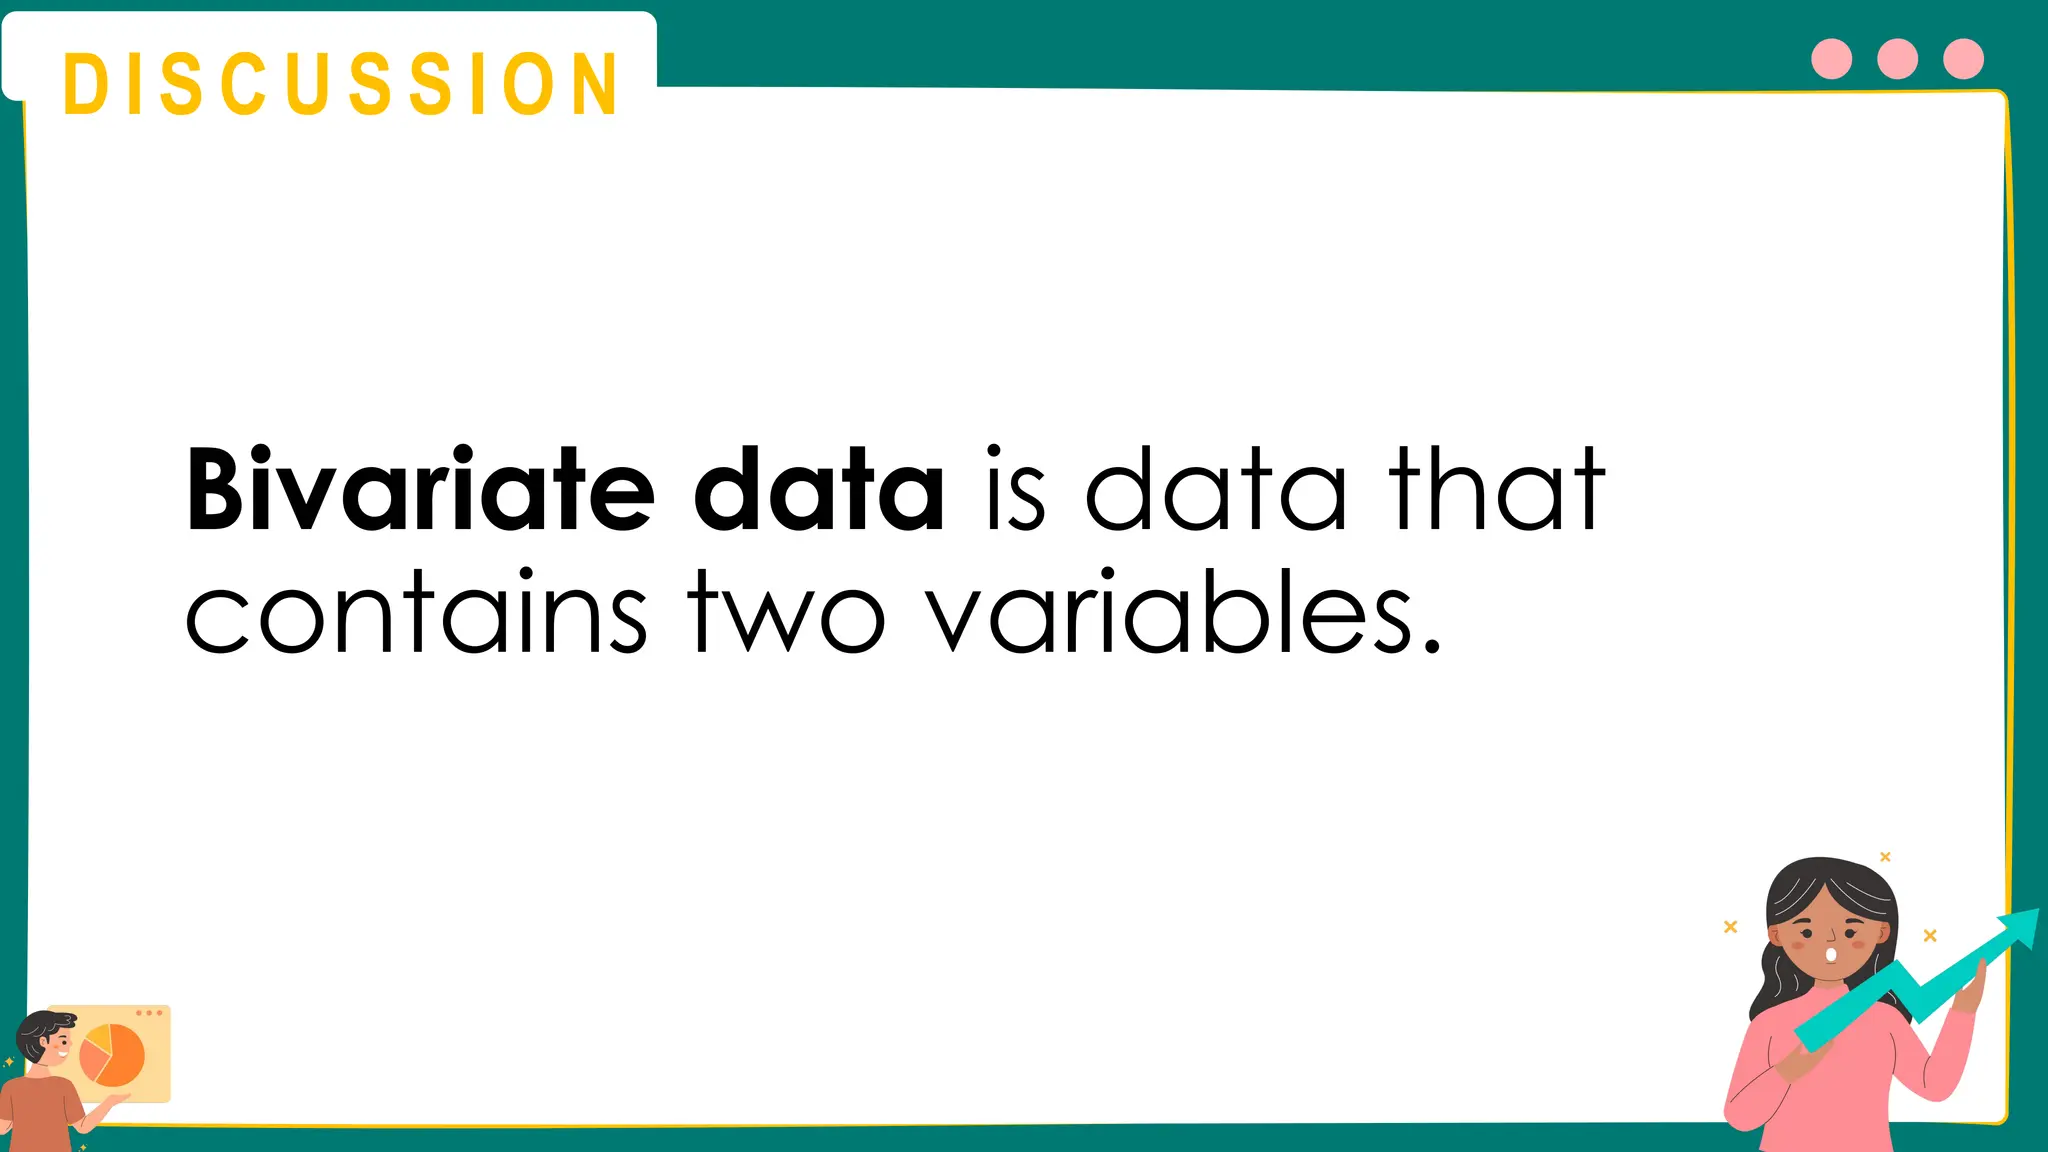
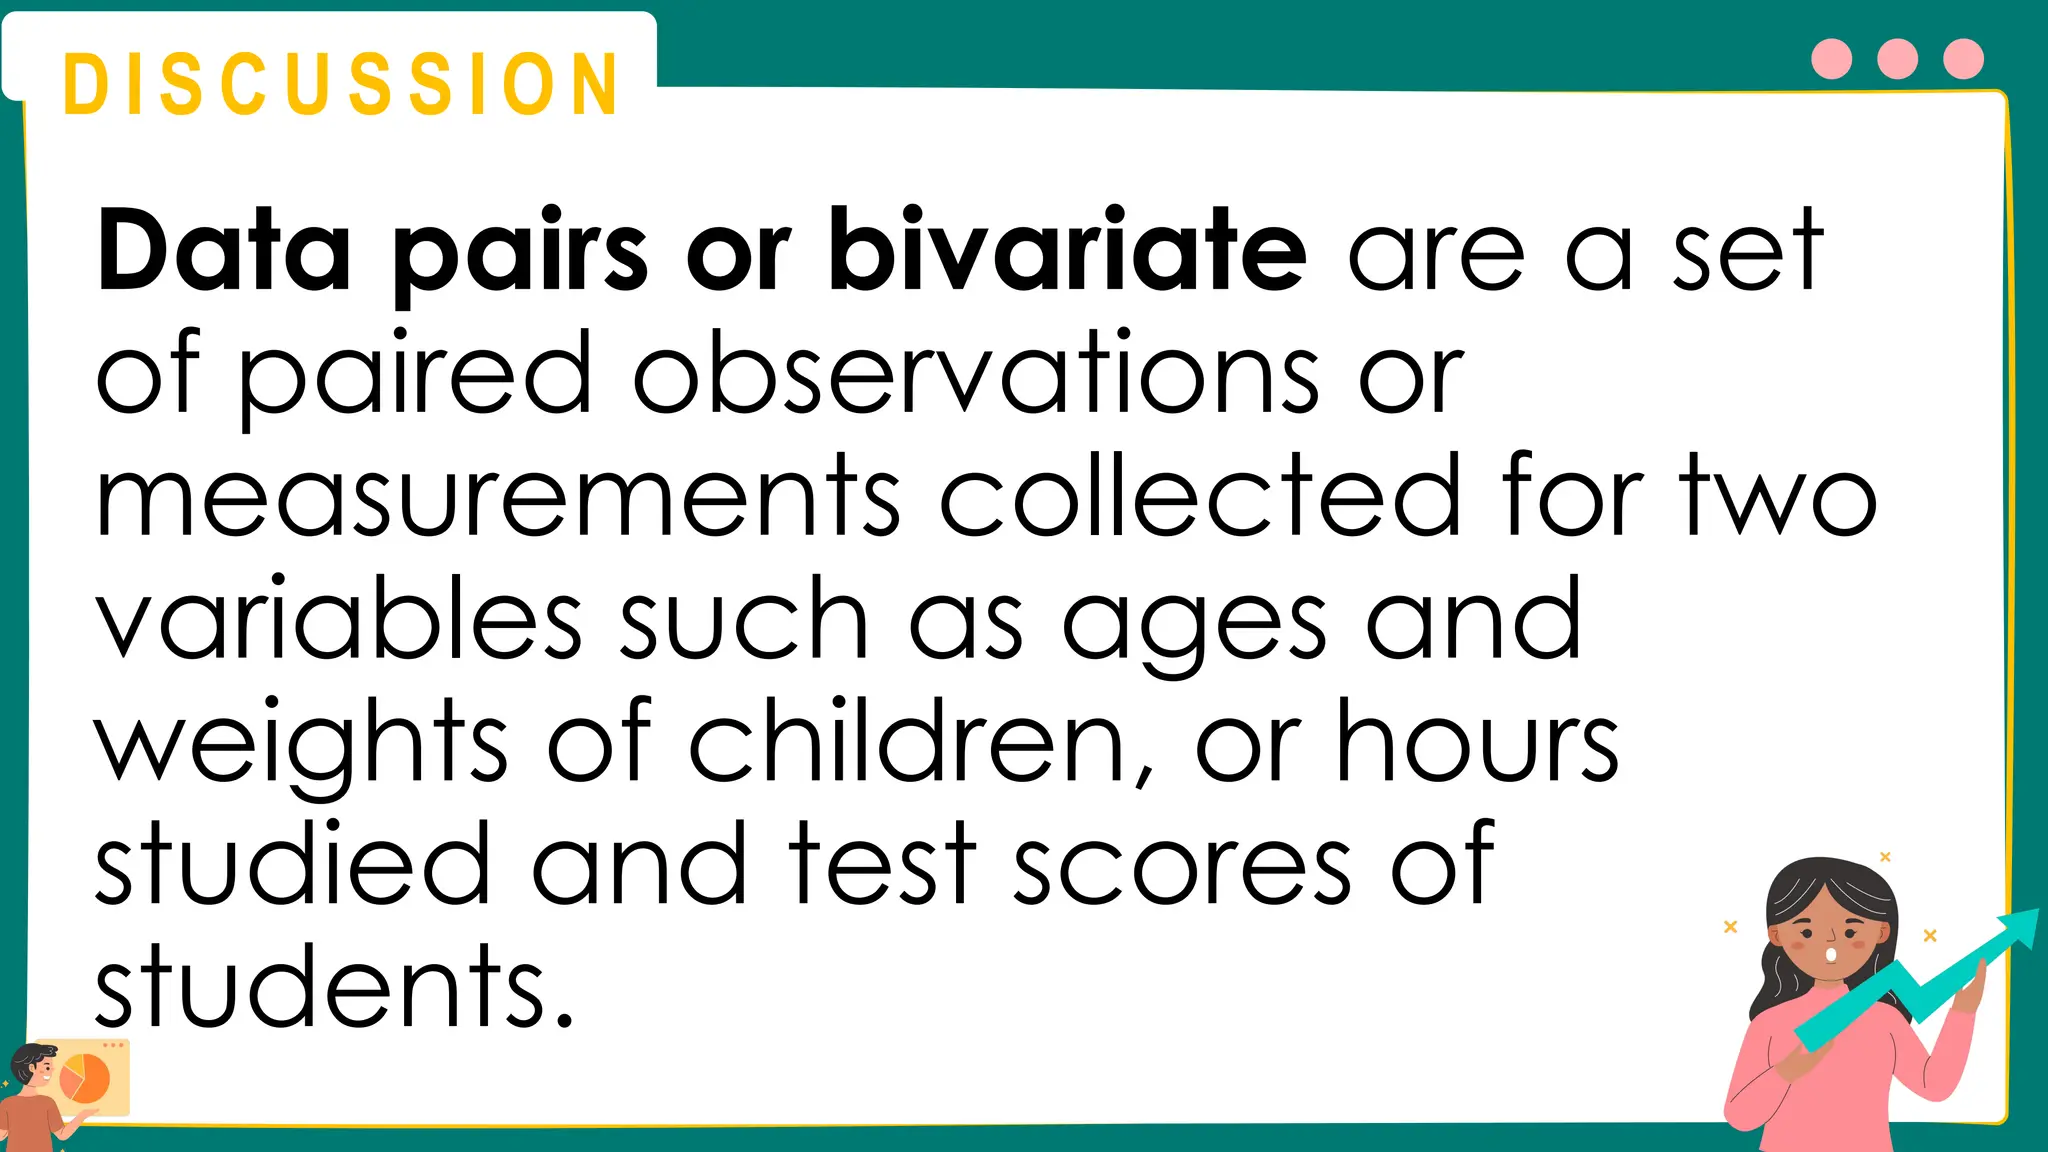
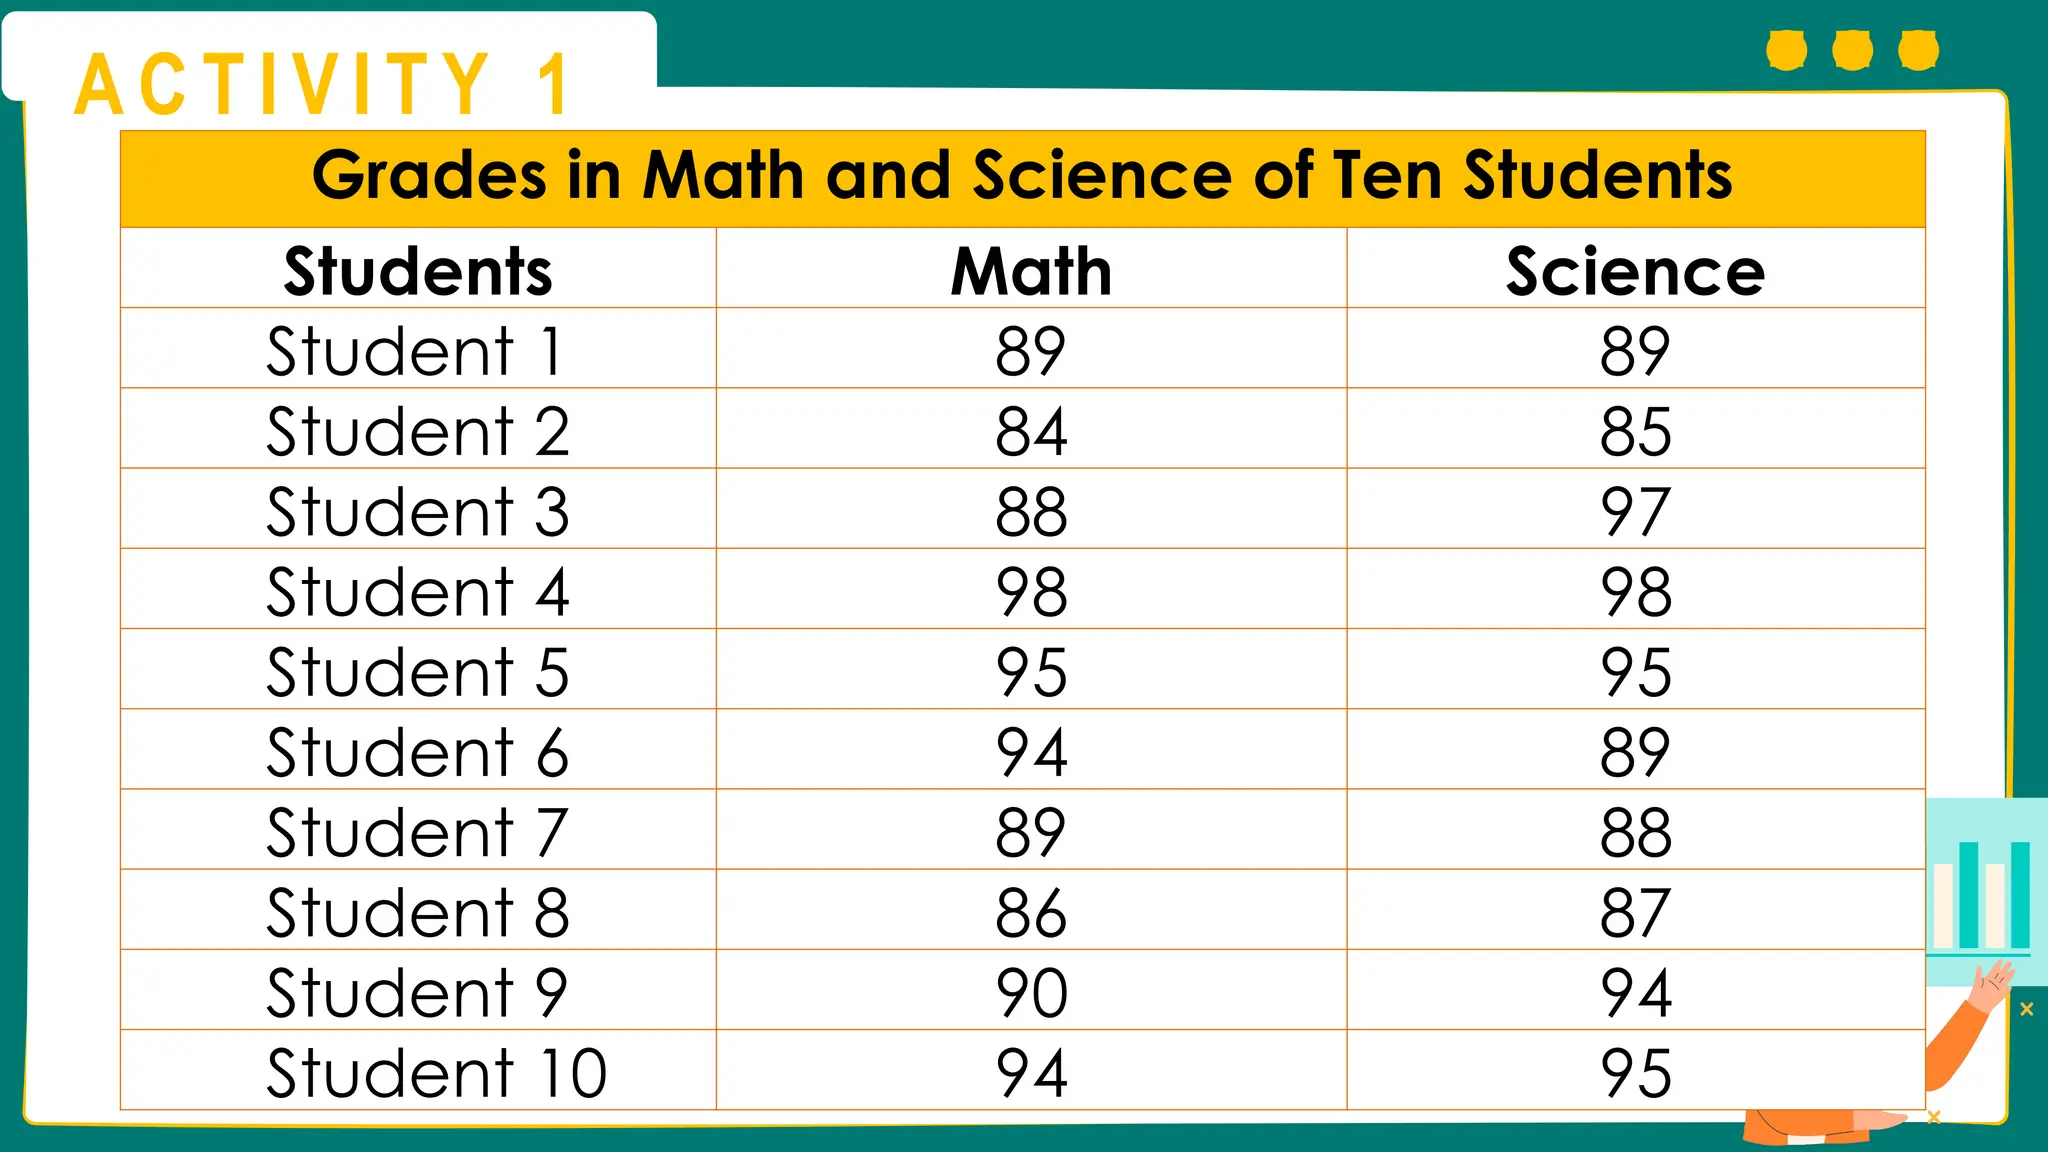
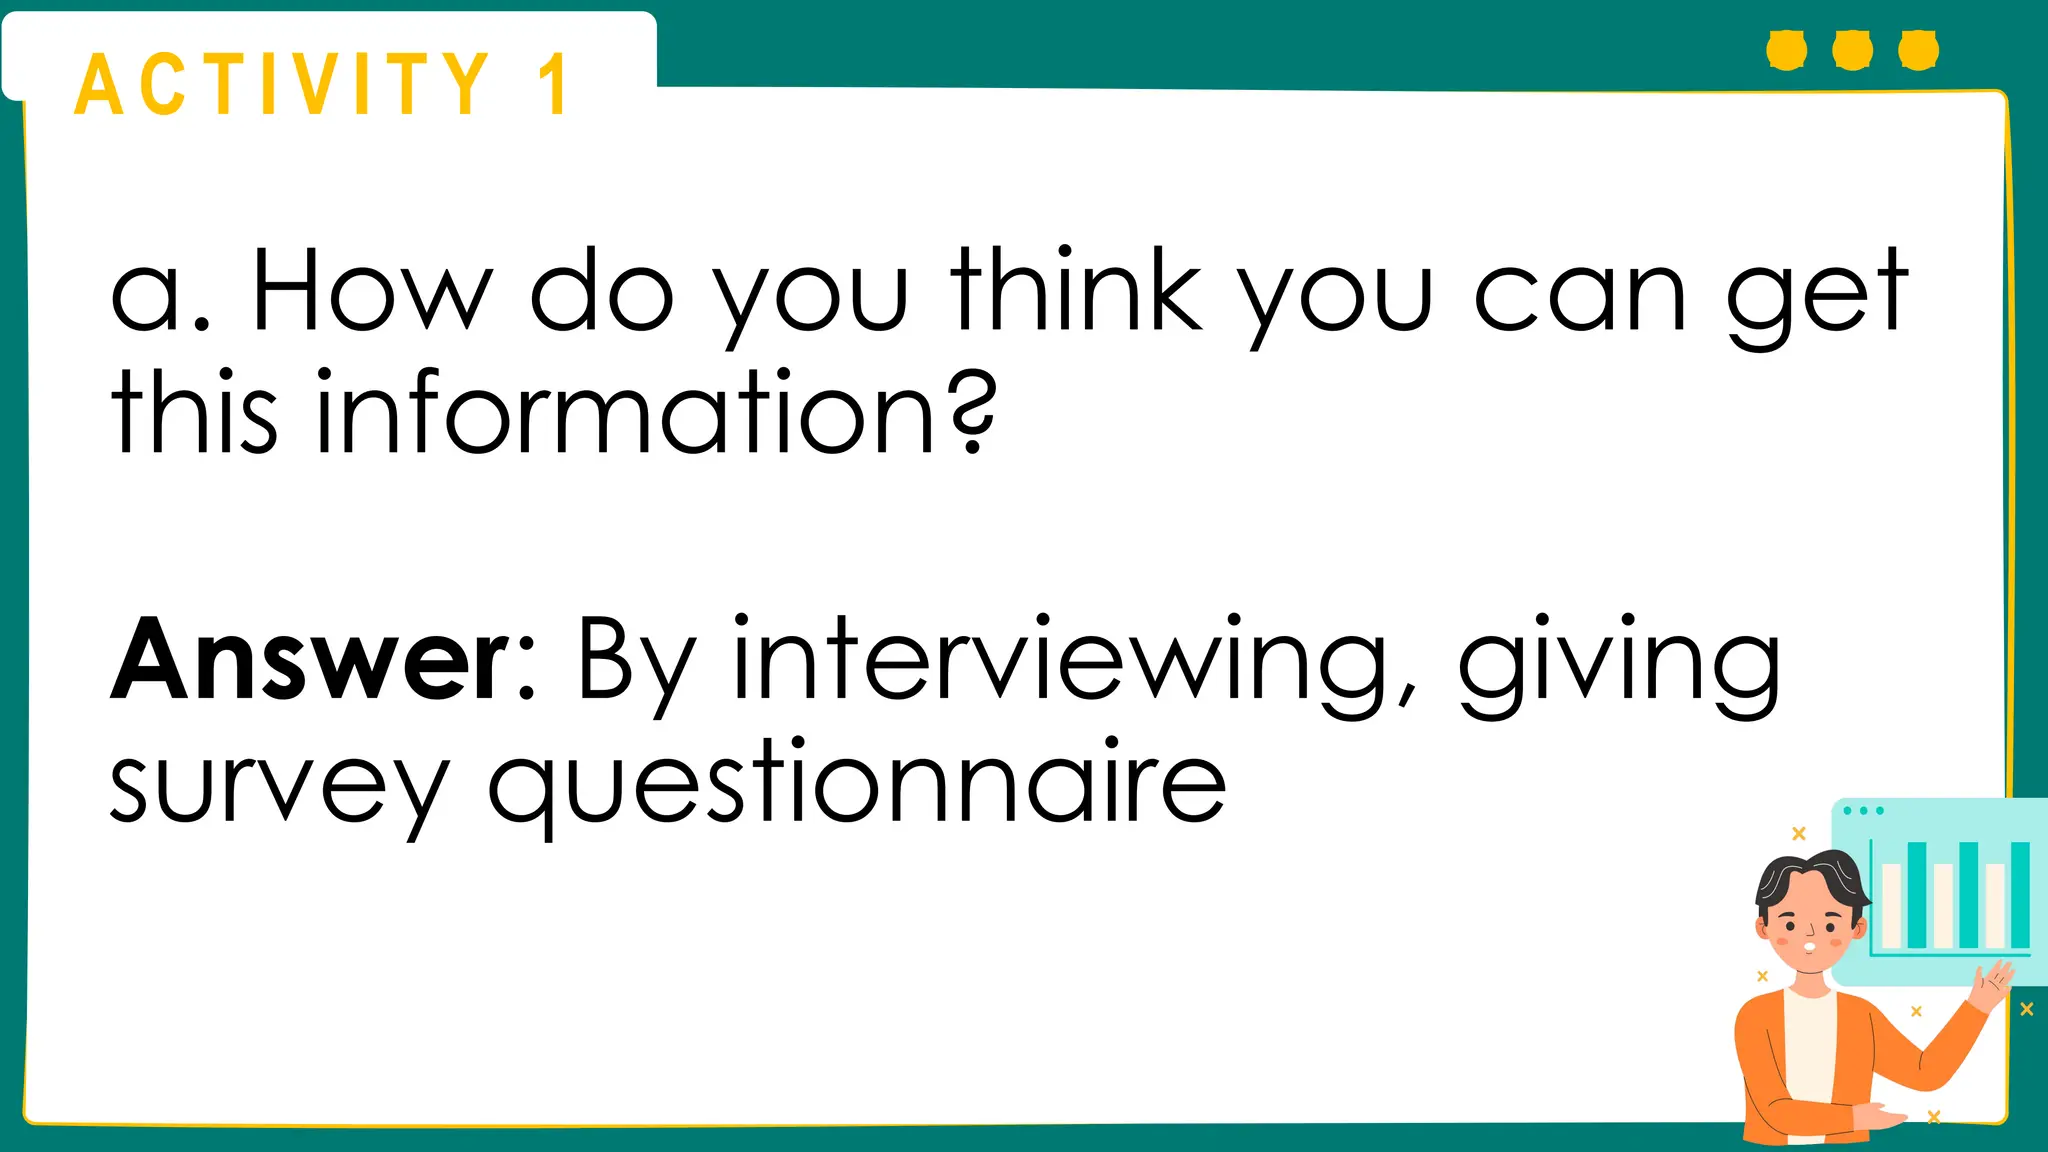
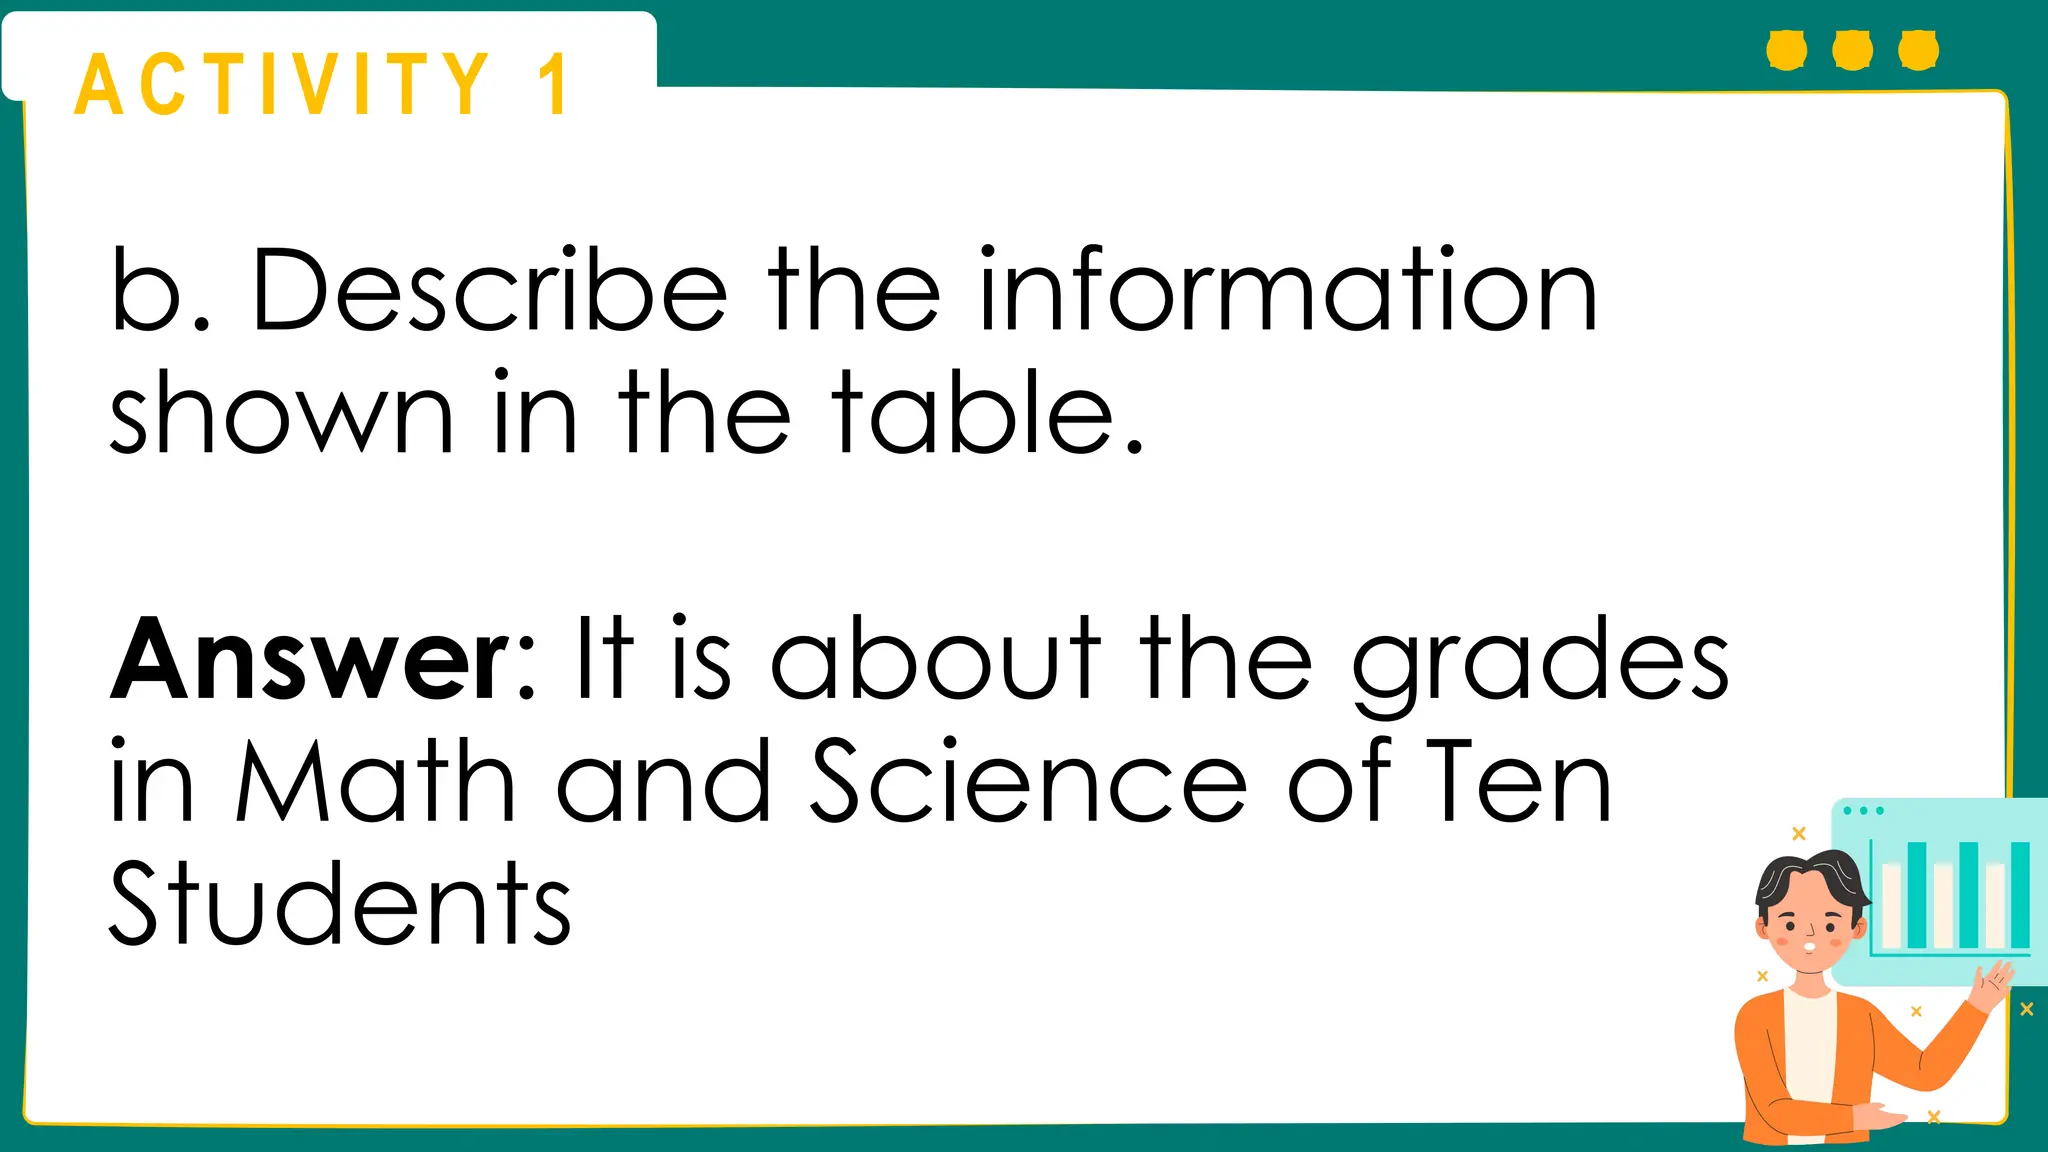
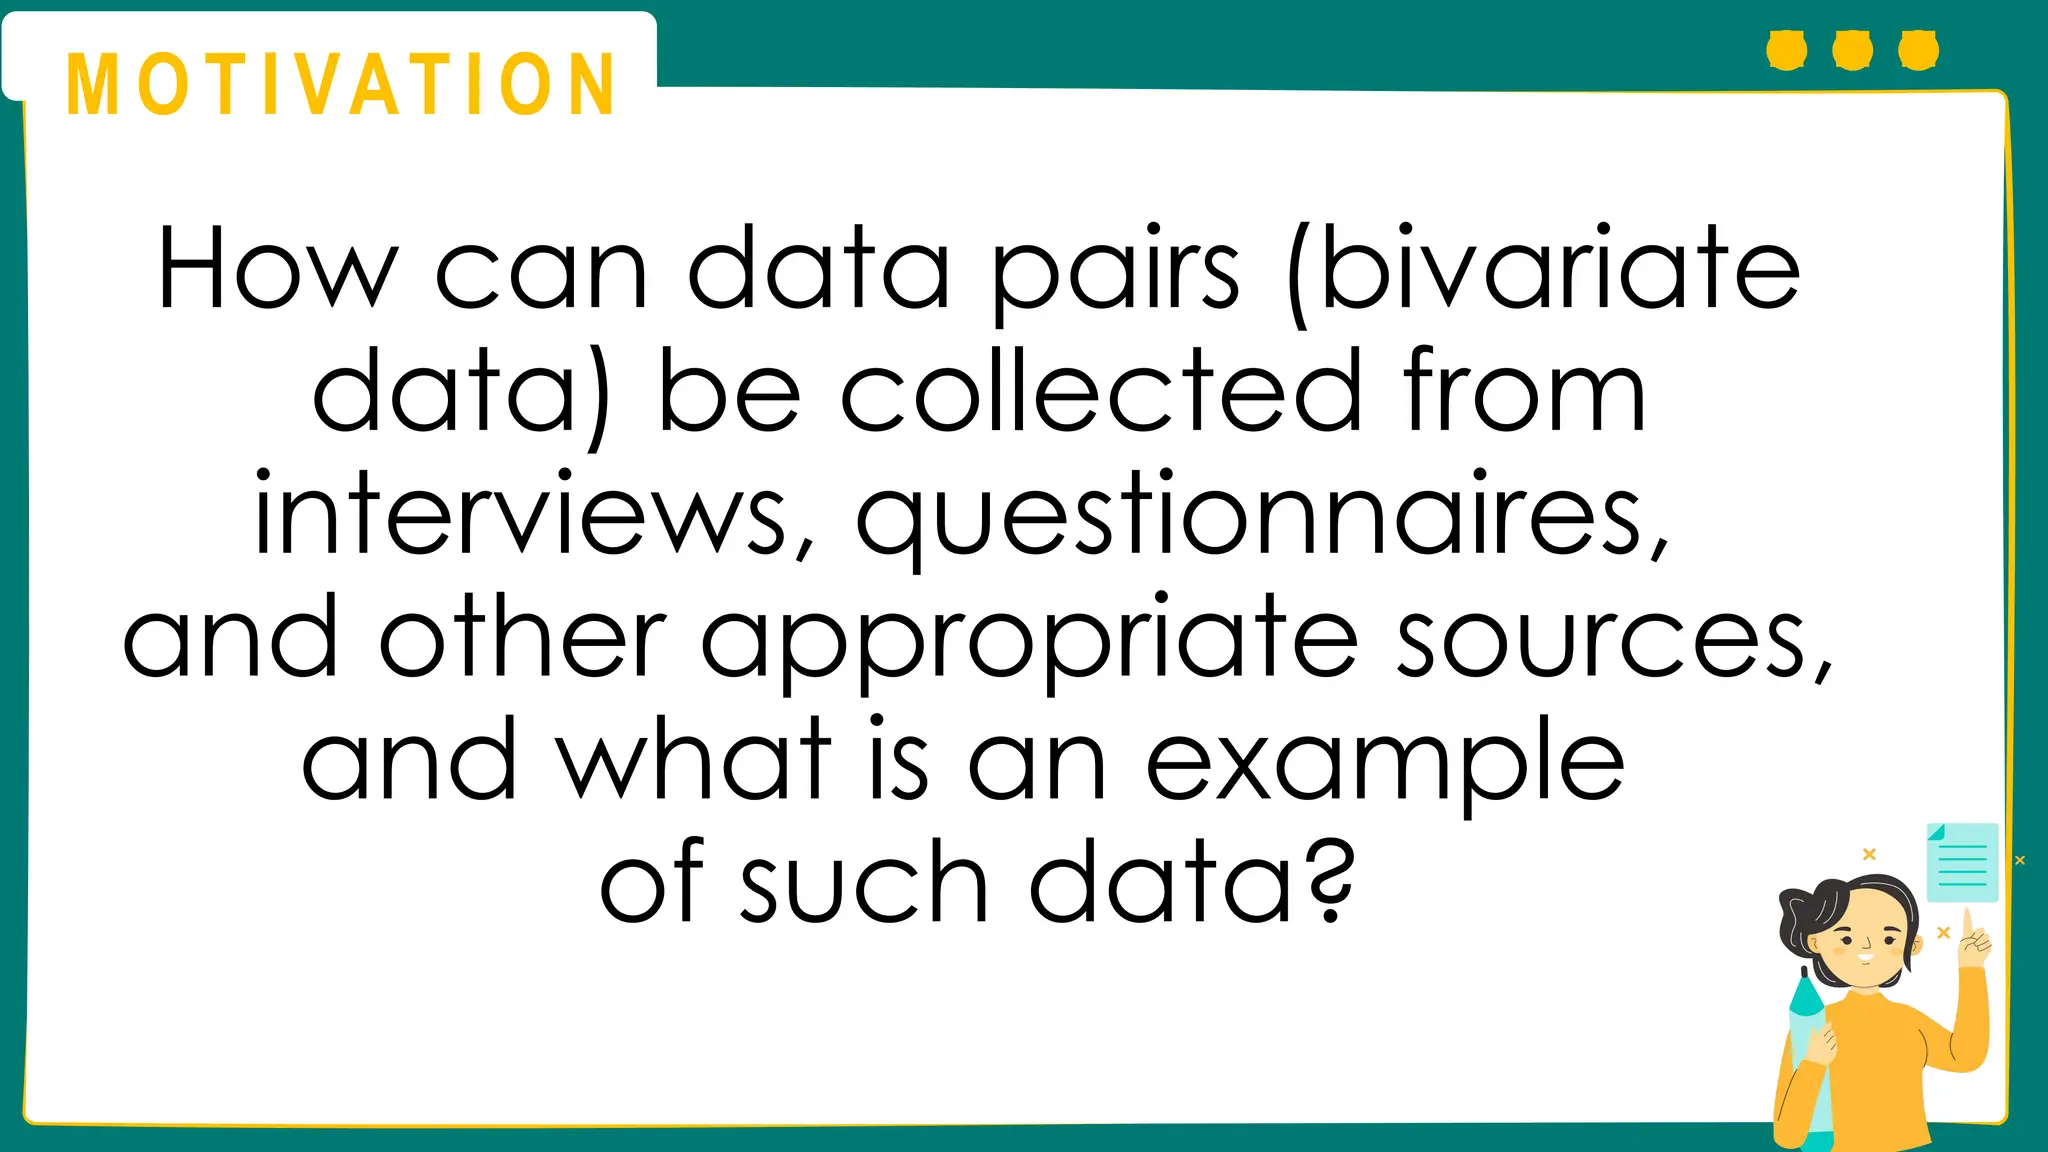
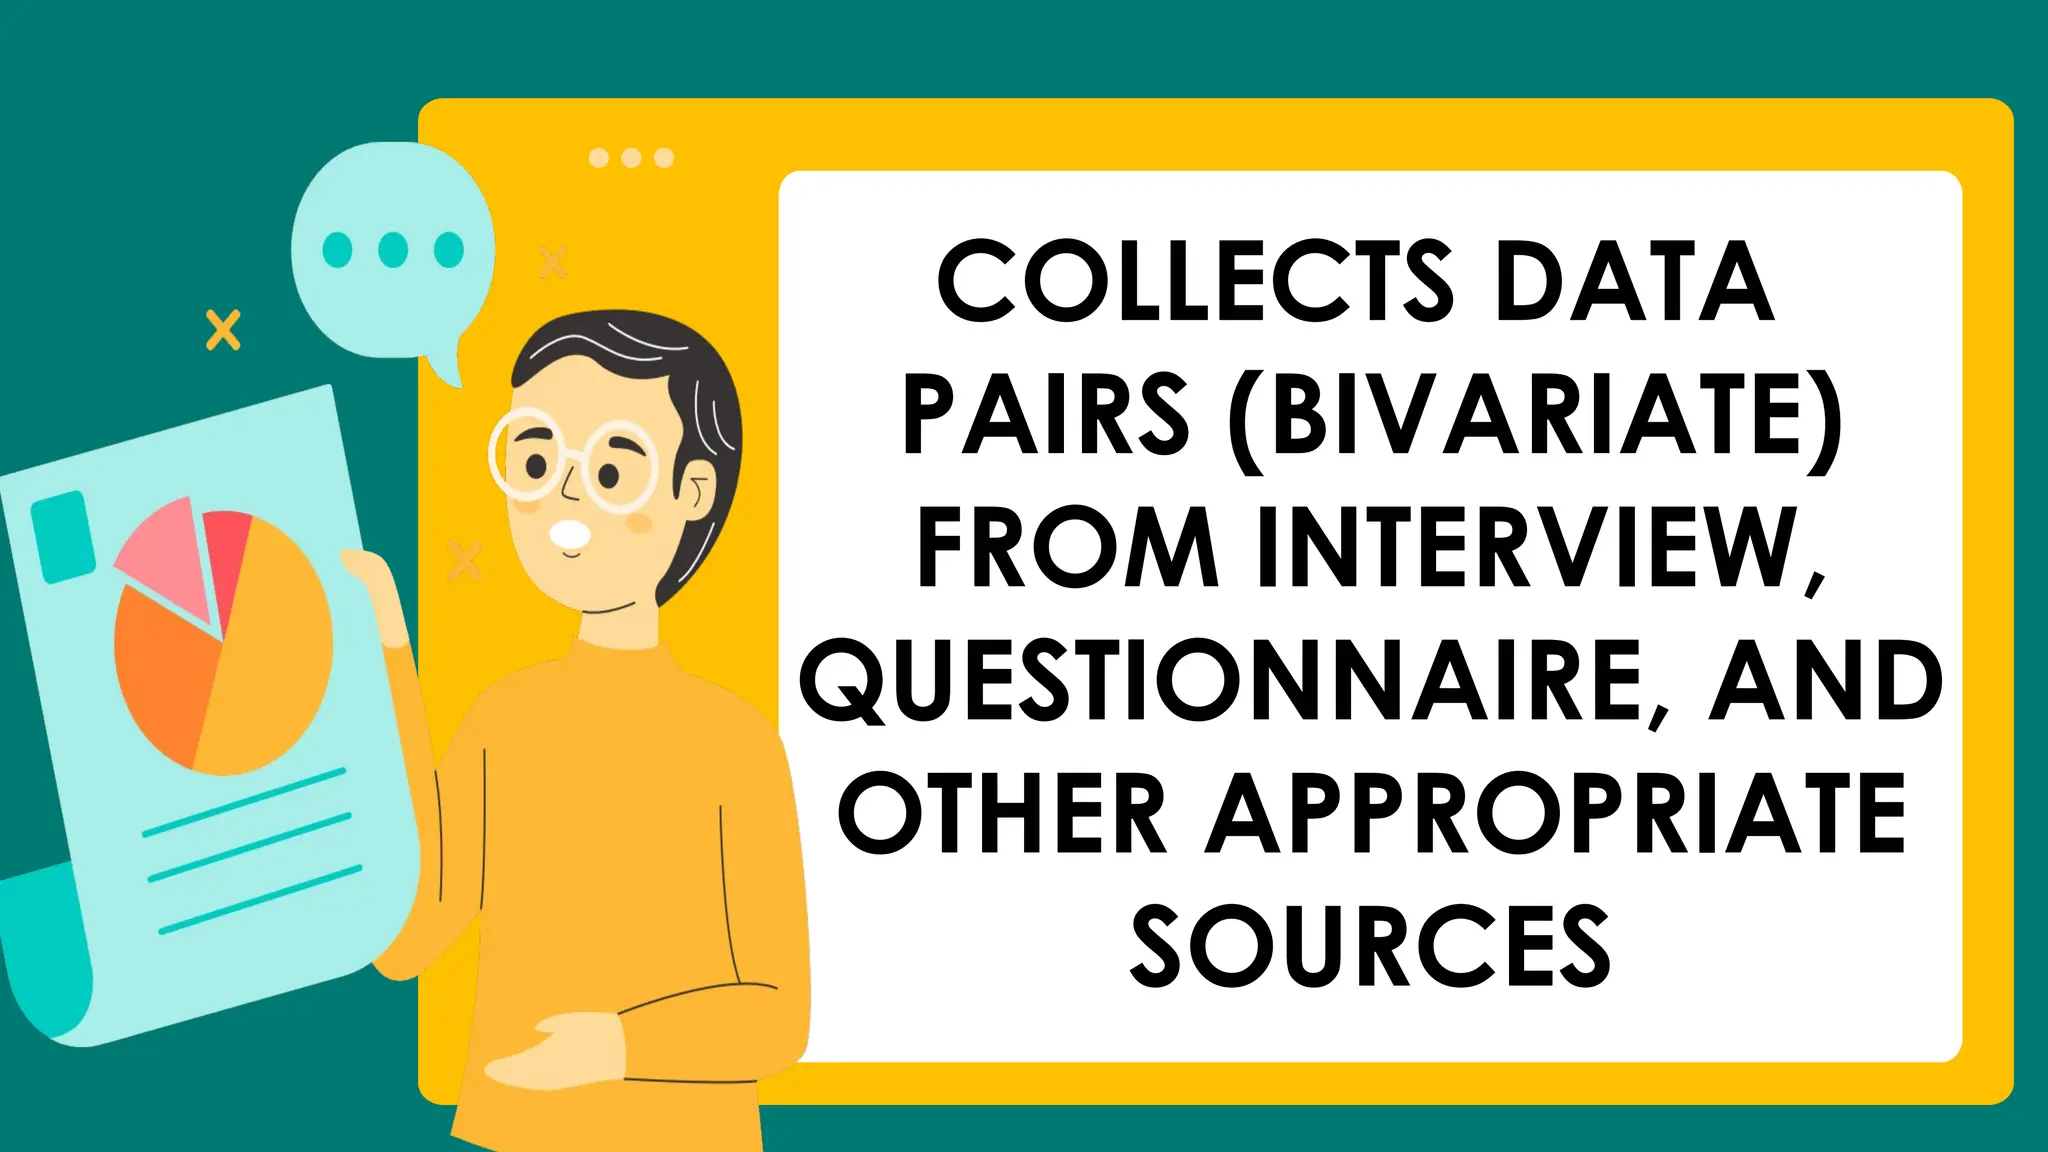
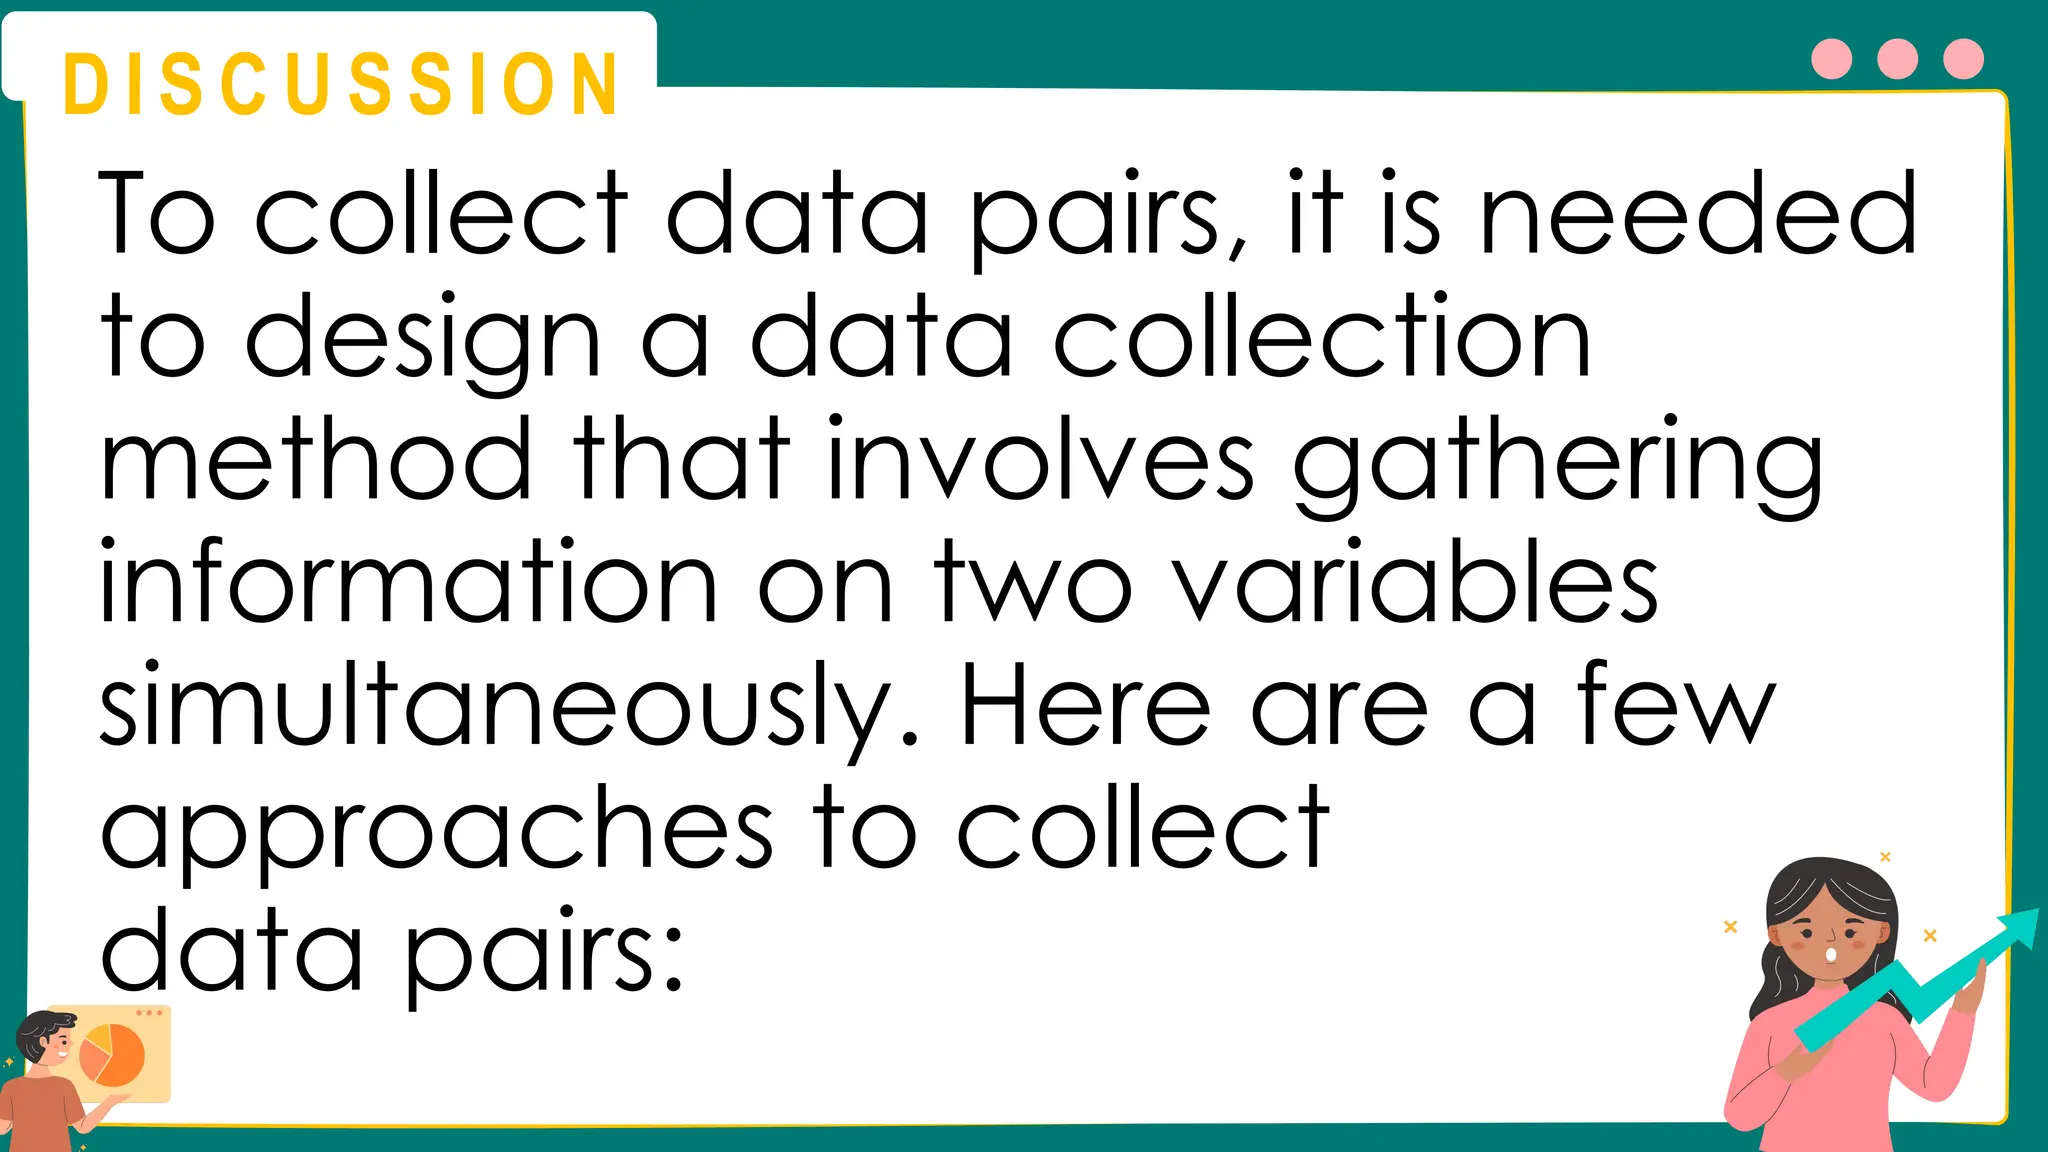
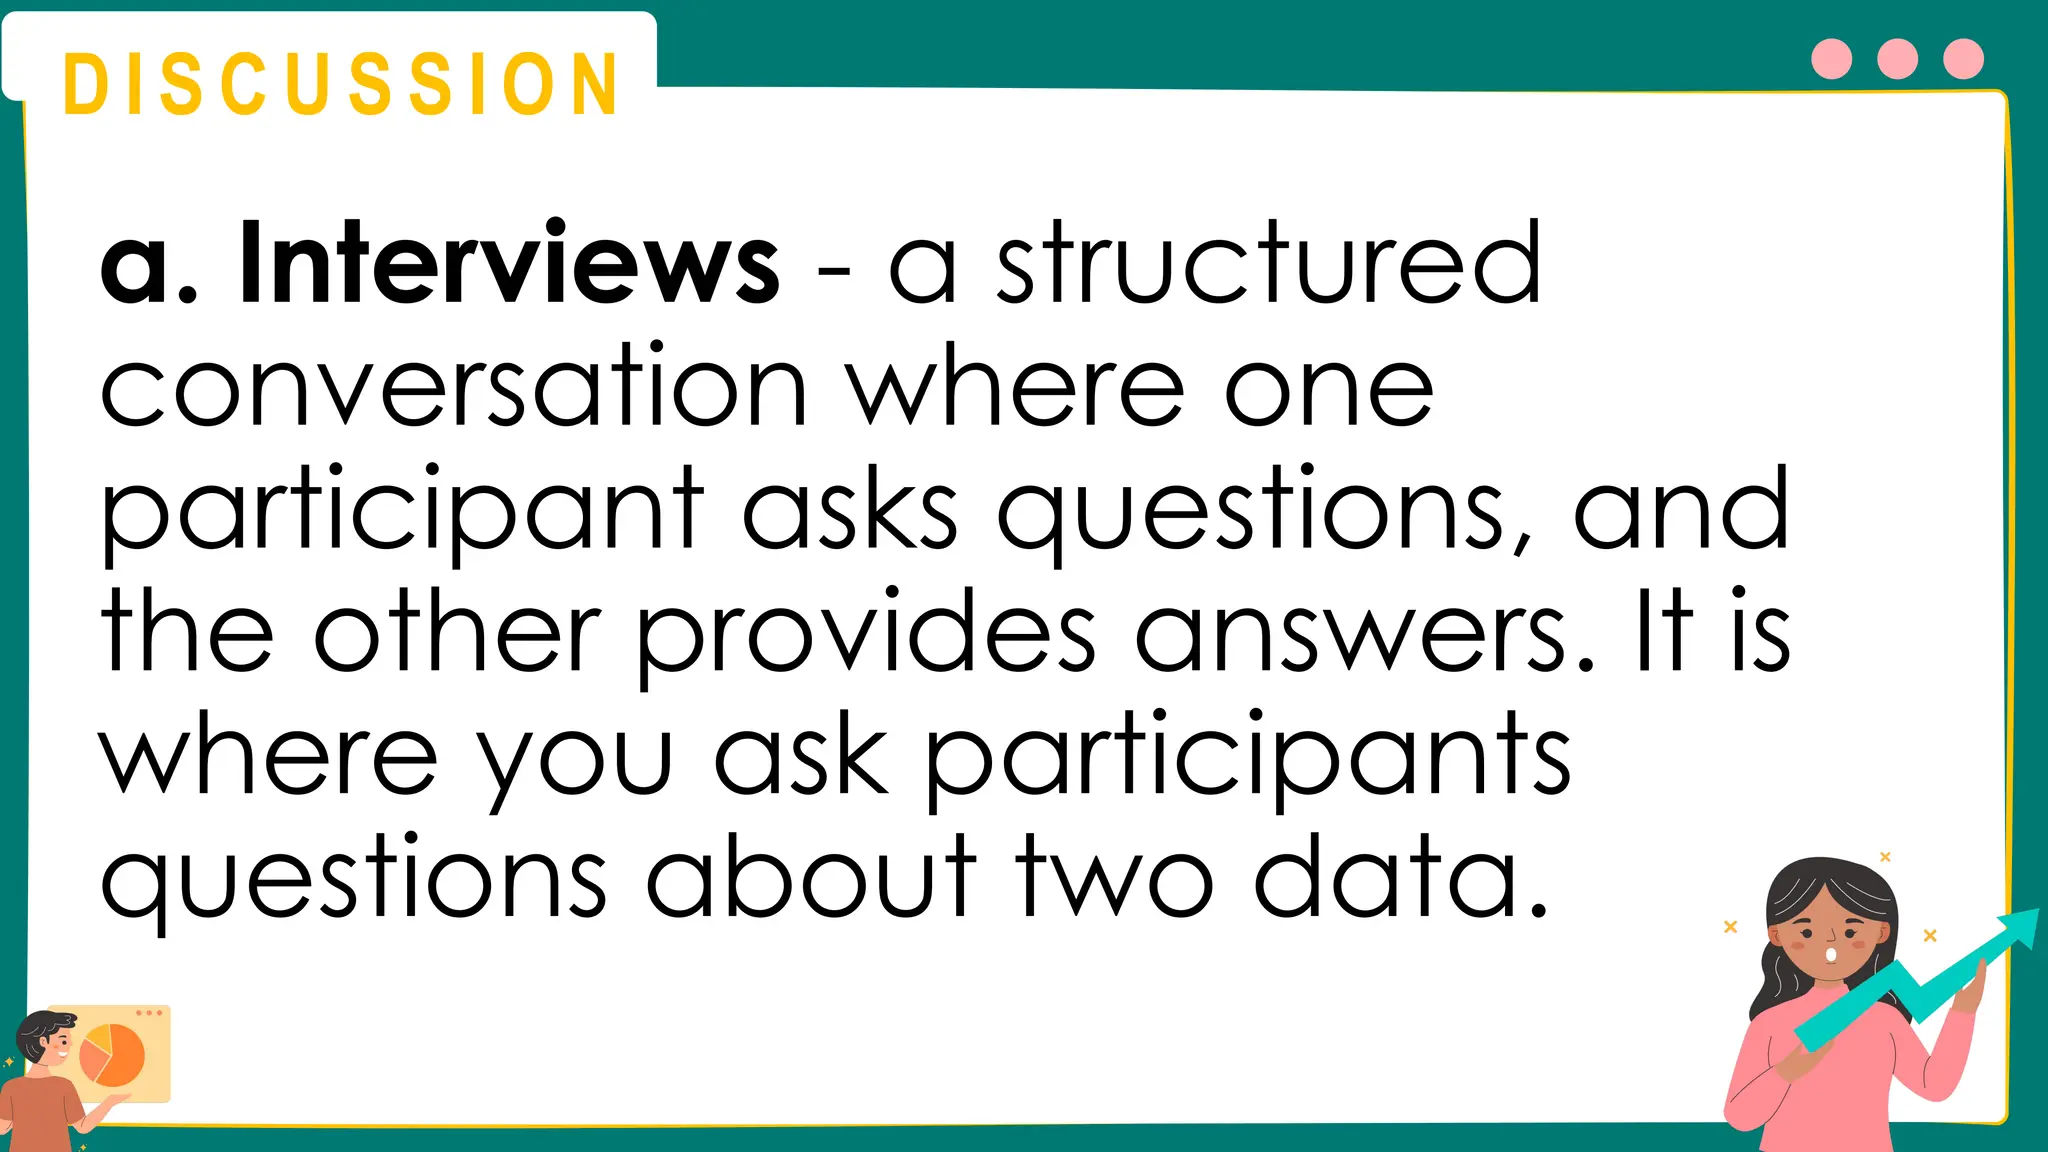
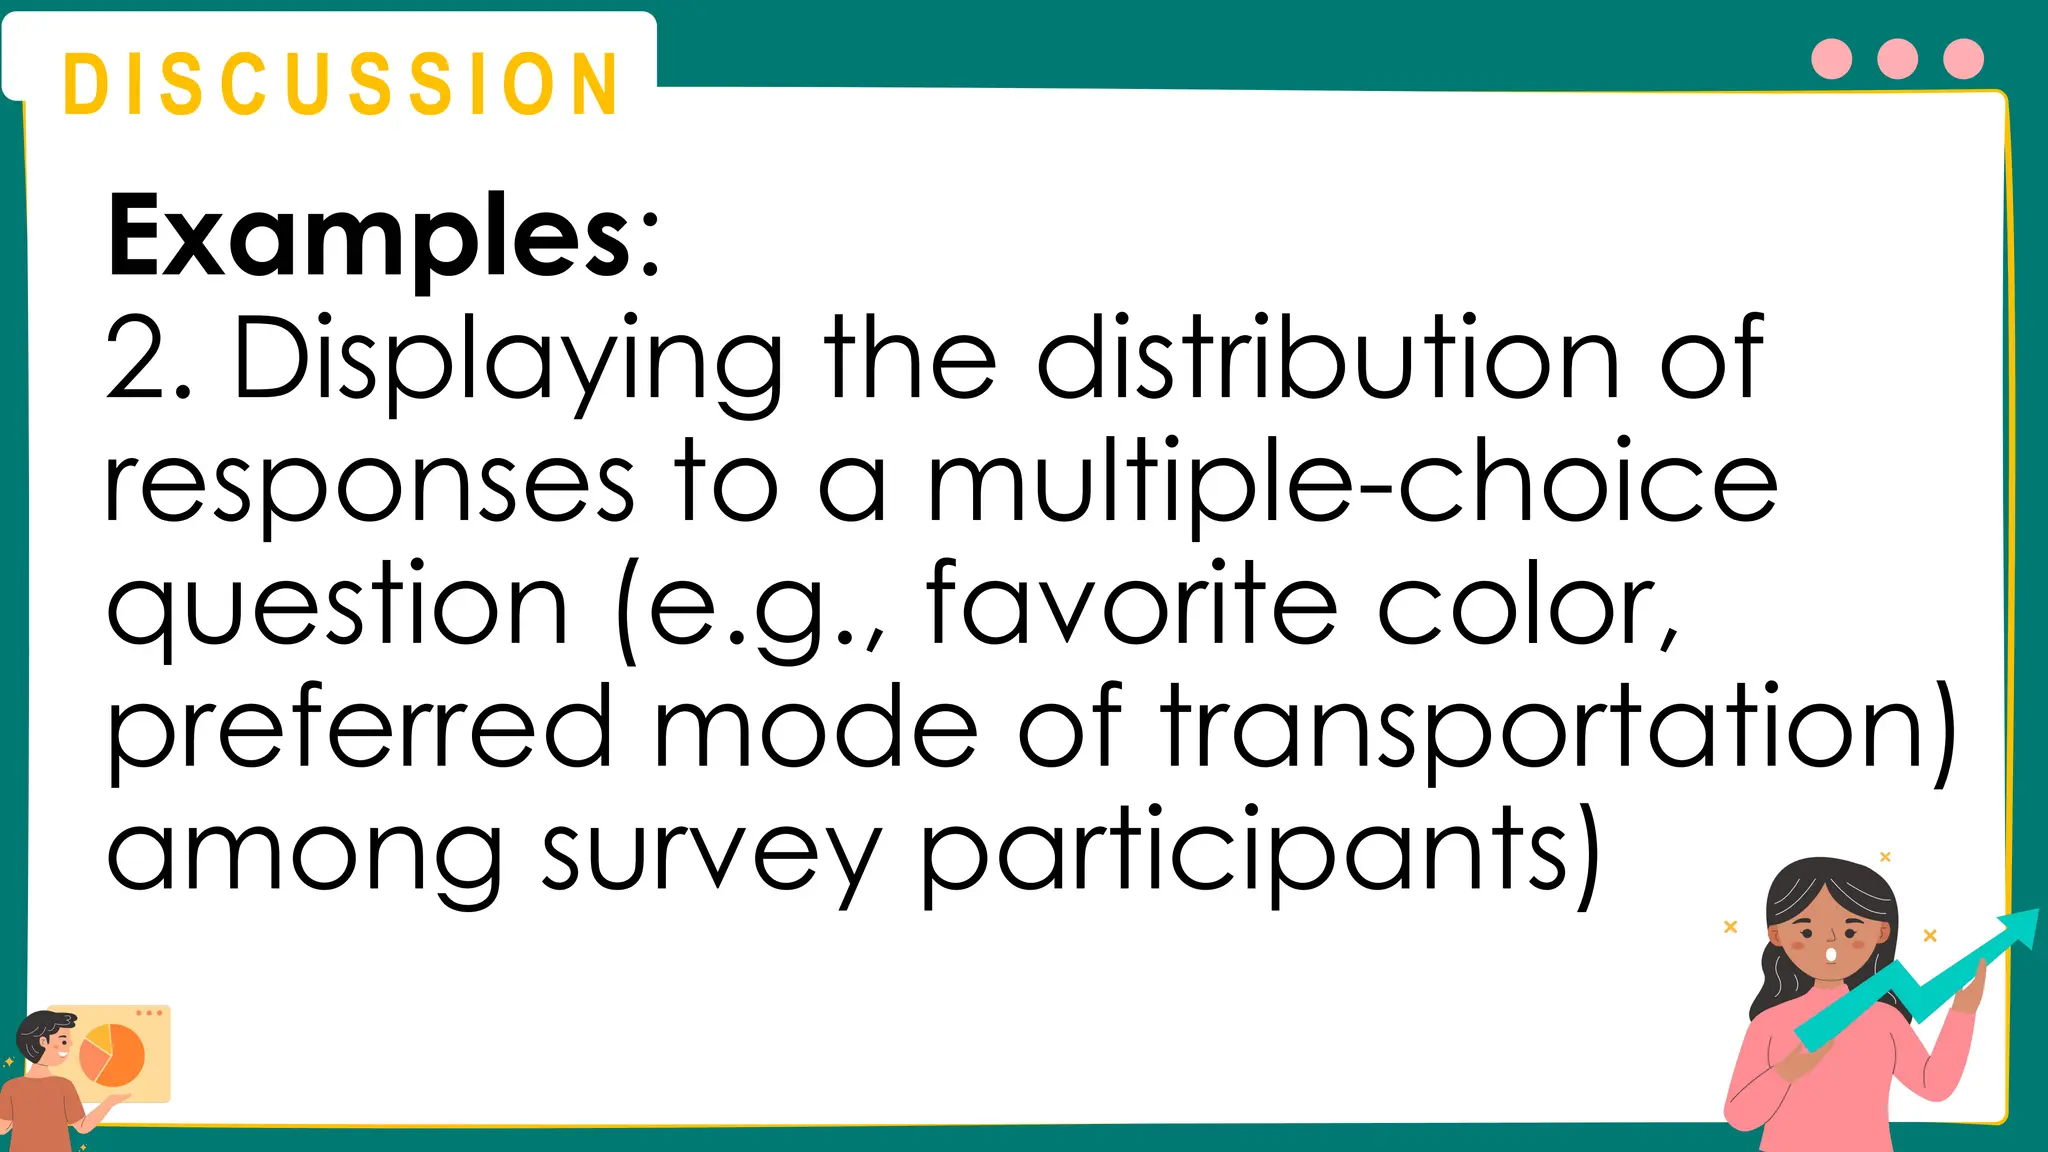
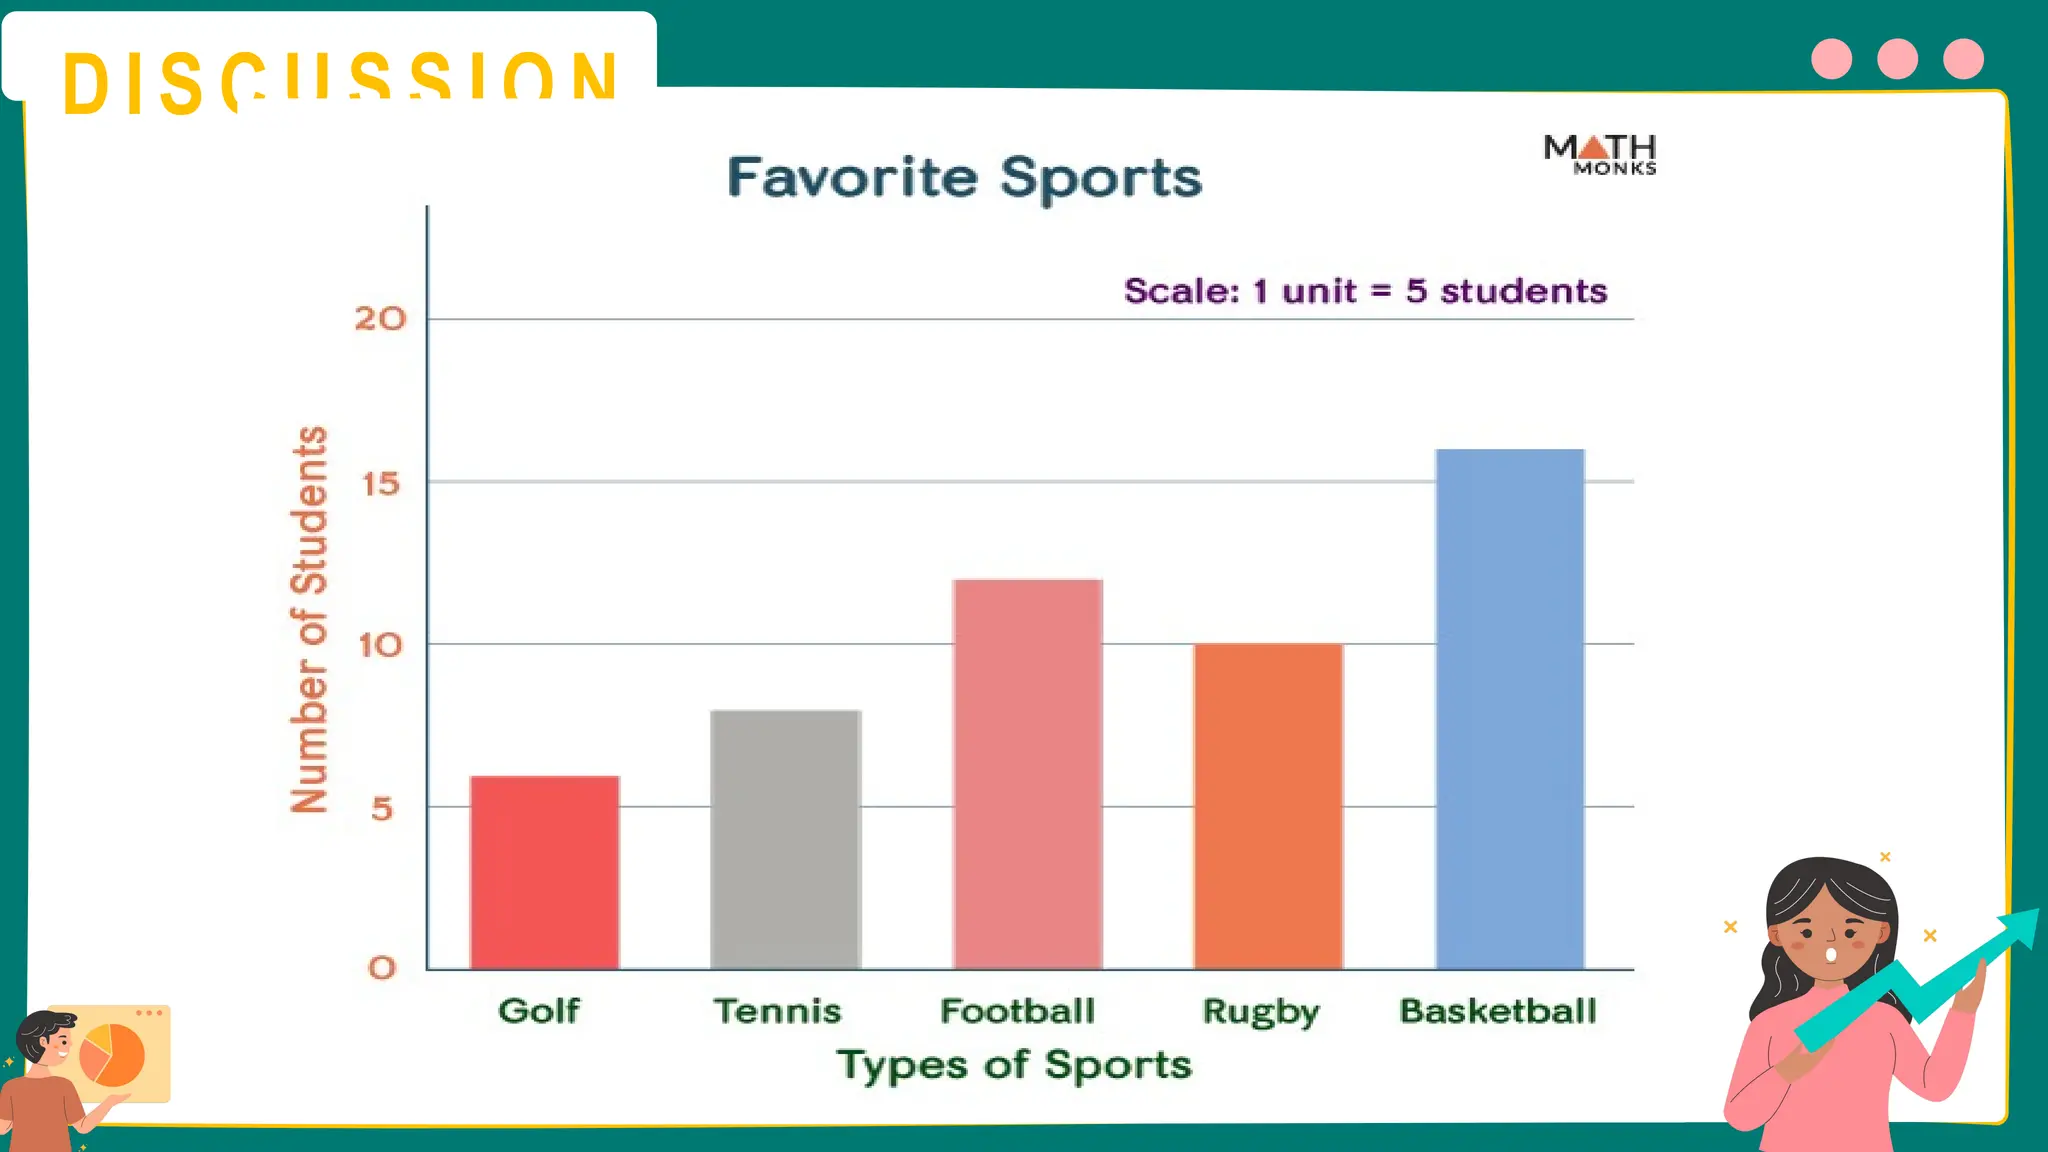
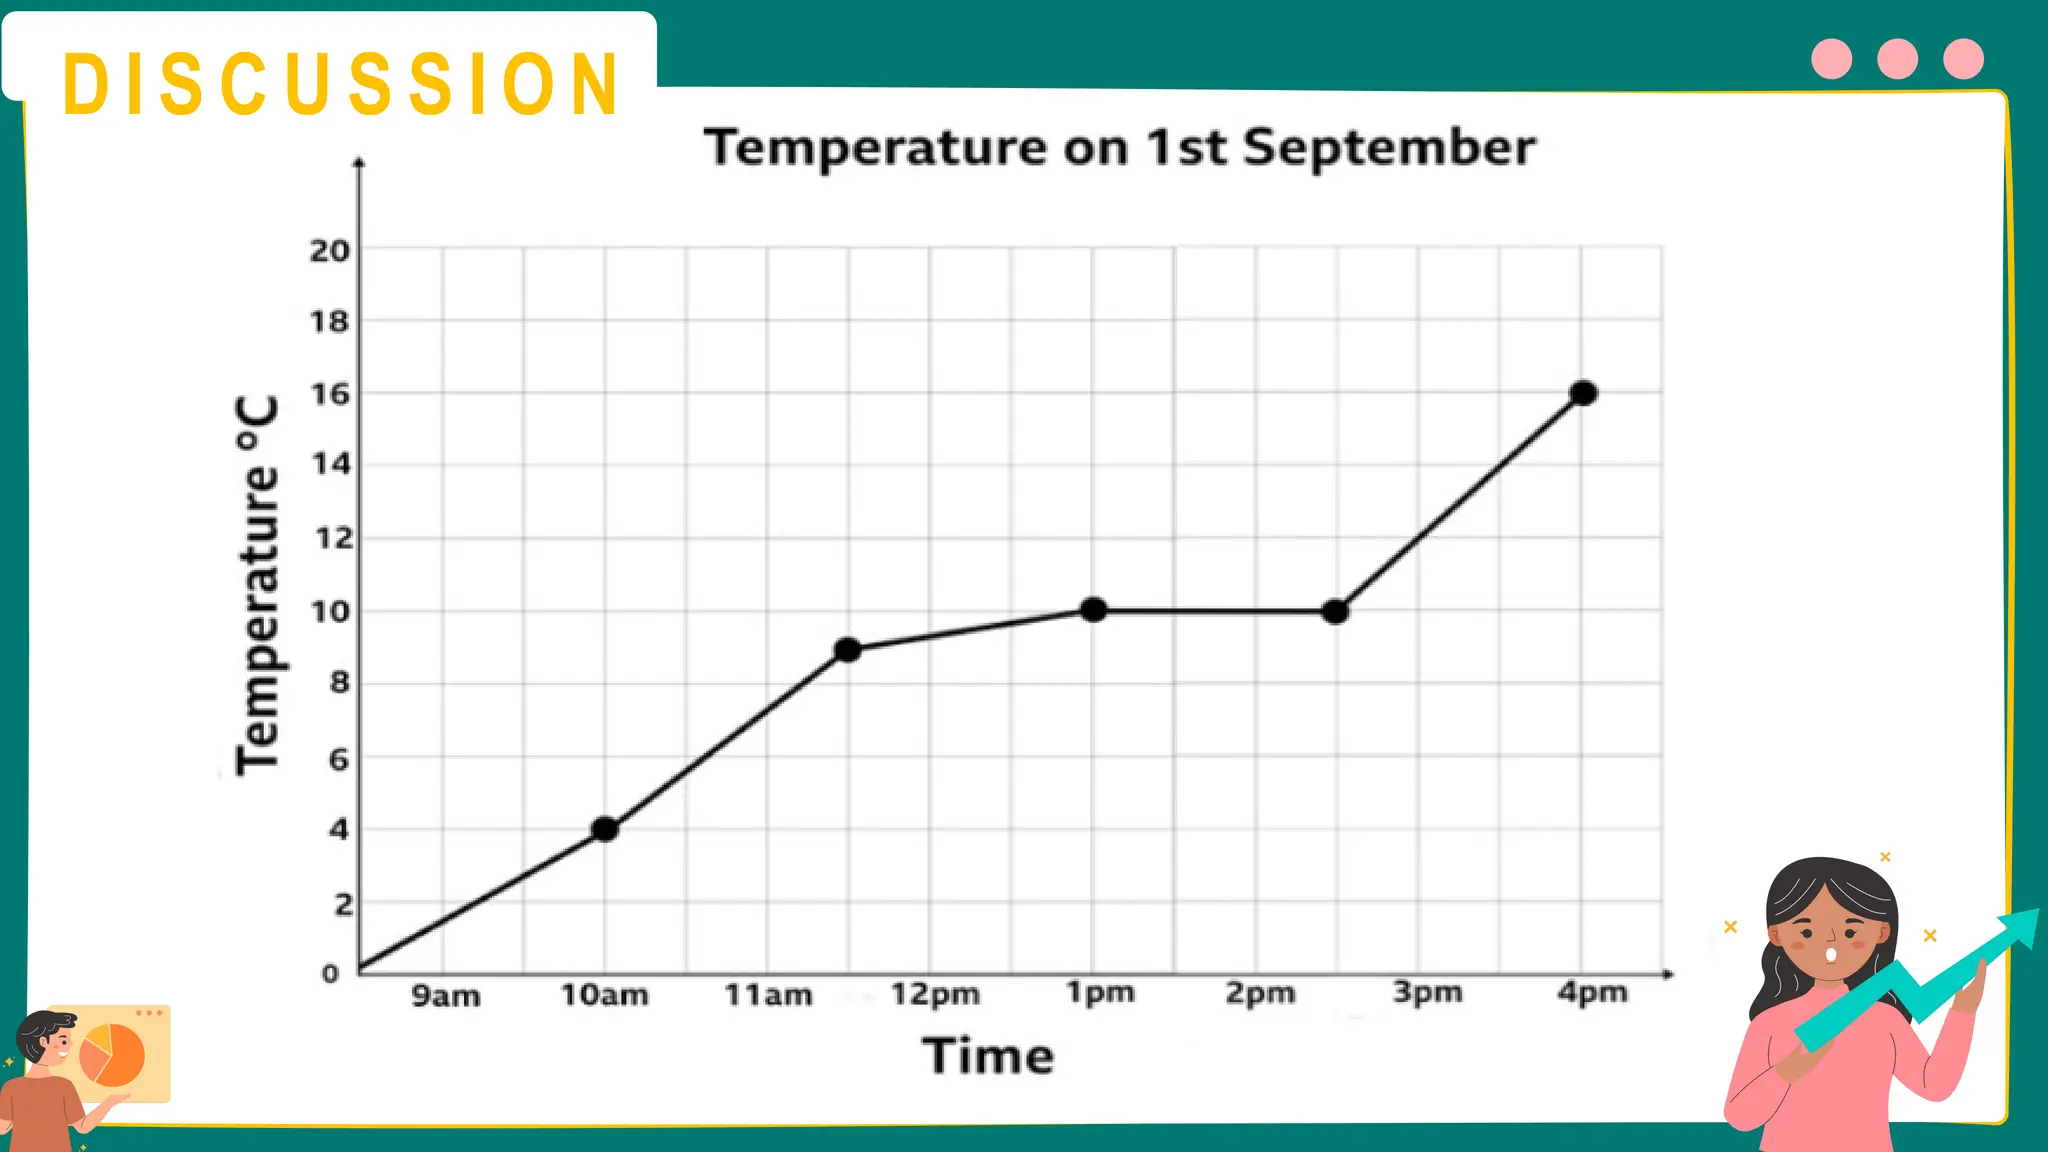
DAY 1
MATHEMATICS 5
QUARTER 3 WEEK 1
R E V I E W
Directions: Teacher Jonalyn
made a survey among 100 first
year students as to their favorite
sports. The results are as follows:
Legend:
5 5 5
R E V I E W
Favorite Sports of First Year Students
M O T I VAT I O N
Answer the following:
1. How many female students
love playing volleyball?
2. How many male students
love playing football?
M O T I VAT I O N
3. How many students love
basketball?
4. Which sport is the most favorite?
5. How many female students
love football?
DATA
COLLECTION
D I S C U S S I O N
A variable is a characteristic
or attribute that can assume
different values.
D I S C U S S I O N
Examples:
a. Age (age varies in values)
b. Gender (maybe female or
male)
c. Grade levels in basic education
(maybe grade 1 – grade 10)
D I S C U S S I O N
Data – are values (measurements
or observations) that the variables
can assume - are facts or set of
information gathered about the
sample or the population.
D I S C U S S I O N
It is a collection of information
gathered by observations,
measurements, research or
analysis. They may consist of facts,
numbers, names, figures or even
description of things. Data is
organized in the form of charts,
tables, or graphs.
D I S C U S S I O N
Bivariate data is data that
contains two variables.
D I S C U S S I O N
Data pairs or bivariate are a set
of paired observations or
measurements collected for two
variables such as ages and
weights of children, or hours
studied and test scores of
students.
A C T I V I T Y 1
Directions: The table below
presents information. Observe
and check the data presented in
the table.
A C T I V I T Y 1
Grades in Math and Science of Ten Students
Students Math Science
Student 1 89 89
Student 2 84 85
Student 3 88 97
Student 4 98 98
Student 5 95 95
Student 6 94 89
Student 7 89 88
Student 8 86 87
Student 9 90 94
Student 10 94 95
A C T I V I T Y 1
a. How do you think you can get
this information?
Answer: By interviewing, giving
survey questionnaire
A C T I V I T Y 1
b. Describe the information
shown in the table.
Answer: It is about the grades
in Math and Science of Ten
Students
A C T I V I T Y 1
c. Where did you refer or base
your answer in (b)?
Answer: From the title of the
table
A C T I V I T Y 1
d. How would you describe a
student in the table? What values
are you going to use?
Answer: Students can be
described through their
grades in Math or Science.
A S S E S S M E N T
Directions: Answer the questions
based on the table.
A S S E S S M E N T
Grades in Math and Science of Ten Students
Students Math Science
Student 1 89 89
Student 2 84 85
Student 3 88 97
Student 4 98 98
Student 5 95 95
Student 6 94 89
Student 7 89 88
Student 8 86 87
Student 9 90 94
Student 10 94 95
A S S E S S M E N T
1. Which student has the highest
grade in Math?
2. What is the average grade in
Science for all ten students?
A S S E S S M E N T
3. Compare the grades of
Student 5 in both Math and
Science. How do they differ?
A S S E S S M E N T
4. Which subject (Math or
Science) has a higher average
grade across all students?
A S S E S S M E N T
5. How many students scored
above 90 in both Math and
Science?
DAY 2
MATHEMATICS 5
QUARTER 3 WEEK 1
R E V I E W
Directions: Write TRUE if the
statement is correct, FALSE if not.
_______ 1. A variable can assume
different values, not just a single
value.
R E V I E W
_______ 2. Gender is an example
of a variable that can have two
possible values: female or male.
R E V I E W
_______ 3. Data refers to facts,
numbers, names, or descriptions
of things that are collected
through observations,
measurements, or analysis.
R E V I E W
_______ 4. Bivariate data contains
two variables, not just one.
R E V I E W
_______ 5. Data pairs or bivariate
data consist of paired
observations for two variables,
such as age and weight, or hours
studied and test scores.
M O T I VAT I O N
How can data pairs (bivariate
data) be collected from
interviews, questionnaires,
and other appropriate sources,
and what is an example
of such data?
COLLECTS DATA
PAIRS (BIVARIATE)
FROM INTERVIEW,
QUESTIONNAIRE, AND
OTHER APPROPRIATE
SOURCES
D I S C U S S I O N
To collect data pairs, it is needed
to design a data collection
method that involves gathering
information on two variables
simultaneously. Here are a few
approaches to collect
data pairs:
D I S C U S S I O N
a. Interviews - a structured
conversation where one
participant asks questions, and
the other provides answers. It is
where you ask participants
questions about two data.
D I S C U S S I O N
During the interview, record
the responses for both data.
For example, interview individuals
about their daily exercise habits
and their stress levels.
D I S C U S S I O N
b. Questionnaire - consists of a set
of questions to collect information
from a respondent. A survey or
questionnaire that includes
questions related to two data
of interest.
D I S C U S S I O N
Participants can provide
responses for both data in the
same survey form.
For example, you could survey
about their age and their level
of satisfaction with their stay
in the school.
D I S C U S S I O N
Other examples of data pairs may
be collected using interview or
questionnaire are the following:
a) Grades and number of hours
spend in studying
b) Grade in Math and Grade in
Science
c) Height and weight
A C T I V I T Y 2
Directions: I will group you into
3 members. You will survey 15
of your classmates using one
of the questionnaires below.
A C T I V I T Y 2
Survey 1:
Q 1: What is your height?
Q 2: What is your weight?
Survey 2
Q 1: How many brothers do you
have?
Q 2: How old are you?
A C T I V I T Y 2
Survey 3:
Q 1: How many times do you
check your cellphones for new
message in an hour?
Q 2: How many hours do you
spend in doing your
homework?
A S S E S S M E N T
Directions: Organize the data
from the questionnaire and
construct a table.
DAY 3
MATHEMATICS 5
QUARTER 3 WEEK 1
R E V I E W
Data presentation of activities
M O T I VAT I O N
What other method or
presentation can be used to
display responses in a survey?
ARGPHS
Answer: GRAPHS
BAR
GRAPH
D I S C U S S I O N
What is a Bar Graph?
a) Bar Graph is a graph which
uses either horizontal or vertical
bars to represent data. The
types of bar graph include
horizontal bar graph and
vertical bar graph.
D I S C U S S I O N
b) The length of a bar
represents a quantity. Therefore,
bars can be compared by
examining the bar lengths.
D I S C U S S I O N
c) In the vertical bar graph, bars
extend from bottom to top. The
vertical line is the scale of the
graph.
D I S C U S S I O N
d) When to use the bar graph?
Bar graphs are effective for
visually representing data or for
comparing different categories.
D I S C U S S I O N
Examples:
1. Comparing the grades or
scores of students in different
subjects or classes.
D I S C U S S I O N
Examples:
2. Displaying the distribution of
responses to a multiple-choice
question (e.g., favorite color,
preferred mode of transportation)
among survey participants)
D I S C U S S I O N
A C T I V I T Y 3
Directions: Answer the following
questions based on the bar
graph.
1. How many students chose
Basketball as their favorite
sport?
A C T I V I T Y 3
2. Which sport has the fewest
number of students who consider
it their favorite?
3. What is the total number of
students who chose Football
and Rugby combined?
A C T I V I T Y 3
4. Based on the scale, how many
students prefer Tennis as their
favorite sport?
5. Which sport has more students
who prefer it, Football
or Tennis?
A S S E S S M E N T
A S S E S S M E N T
1) What is the data about?
2) What do those bars represent?
A S S E S S M E N T
3) What information does the last
bar represent?
4) How many teachers opposed
the change in school starting
time?
A S S E S S M E N T
5. How many teachers favored
the change in school starting
time?
DAY 3
MATHEMATICS 5
QUARTER 3 WEEK 1
R E V I E W
Directions: Answer the following
questions based on the table.
R E V I E W
R E V I E W
1. Which day of the week had
the highest number of absences?
2. How many absences were
recorded on Wednesday?
R E V I E W
3. What is the total number of
absences for the first week of
April?
4. Which two days had the same
number of absences?
R E V I E W
5. How many more absences
were recorded on Friday
compared to Tuesday?
M O T I VAT I O N
What is a line graph?
✔ Line graph is a type of graph
used to represent changes in data
over a period of time. Usually,
data are represented by points
and are connected by line
segments.
M O T I VAT I O N
What is a line graph?
✔ In general, the horizontal axis is
used as the time axis and the
vertical axis is used to show the
changes in the other quantity.
LINE
GRAPH
D I S C U S S I O N
D I S C U S S I O N
a. What information can you
read/see from the line graph?
The line graph shows temperature
on September 1 from 9am to 4pm.
D I S C U S S I O N
b. What values are found in the x-
axis? y axis?
In x – axis is time from 9am to 4pm
where the temperature in Sept 1
were taken/recorded. In the
y- axis is the temperature in
degrees Celsius.
D I S C U S S I O N
c. What is the temperature on
Sept 1 at 4 pm?
(16 degree Celsius)
d. What is the highest recorded
temperature on Sept 1?
(16 degree Celsius
D I S C U S S I O N
When to use the line graph?
Data like changes in population,
temperature, and profit can be
represented by a line graph
D I S C U S S I O N
Examples:
a. Daily temperature of San
Ignacio Elementary School for 7
days to monitor heat index
b. Number of boxes of donuts sold
in a week
c. Population in Pampanga
Province for a period of 6 years.
A C T I V I T Y 4
A C T I V I T Y 4
A. Refer to the line graph in
answering the following
questions.
1. What information can you
read/see from the line graph?
A C T I V I T Y 4
2. Which data from the graph
indicates a period of time?
3. What is lowest point(s) of the
line graph? Describe the lowest
point using the data values
found in the x and y axis.
A C T I V I T Y 4
4. Identify one information that
they can read from the graph.
A C T I V I T Y 4
B. Identify the following as Bar
graph or Line graph.
__________________1. It is
commonly drawn to show
information that changes
over time.
A C T I V I T Y 4
__________________2. It represents
numerical data by double bars
or rectangles of equal width and
varying height.
__________________3. It is
particularly useful for showing
similar data between two
different groups.
A S S E S S M E N T
A. Given the tables, identify what
is the appropriate graph to be
used. Write L for Line Graph and
B for Bar Graph.
A S S E S S M E N T
1. __________ 2. __________
A S S E S S M E N T
B. Which line graph correctly
represents changes in Kelly’s
heights from 0 years to 8 years
old? The table below shows the
data.
A S S E S S M E N T
A S S E S S M E N T

Collects bivariate data from interview, questionnaire, and other appropriate sources.

  • 1.
  • 2.
    R E VI E W Directions: Teacher Jonalyn made a survey among 100 first year students as to their favorite sports. The results are as follows: Legend: 5 5 5
  • 3.
    R E VI E W Favorite Sports of First Year Students
  • 4.
    M O TI VAT I O N Answer the following: 1. How many female students love playing volleyball? 2. How many male students love playing football?
  • 5.
    M O TI VAT I O N 3. How many students love basketball? 4. Which sport is the most favorite? 5. How many female students love football?
  • 6.
  • 7.
    D I SC U S S I O N A variable is a characteristic or attribute that can assume different values.
  • 8.
    D I SC U S S I O N Examples: a. Age (age varies in values) b. Gender (maybe female or male) c. Grade levels in basic education (maybe grade 1 – grade 10)
  • 9.
    D I SC U S S I O N Data – are values (measurements or observations) that the variables can assume - are facts or set of information gathered about the sample or the population.
  • 10.
    D I SC U S S I O N It is a collection of information gathered by observations, measurements, research or analysis. They may consist of facts, numbers, names, figures or even description of things. Data is organized in the form of charts, tables, or graphs.
  • 11.
    D I SC U S S I O N Bivariate data is data that contains two variables.
  • 12.
    D I SC U S S I O N Data pairs or bivariate are a set of paired observations or measurements collected for two variables such as ages and weights of children, or hours studied and test scores of students.
  • 13.
    A C TI V I T Y 1 Directions: The table below presents information. Observe and check the data presented in the table.
  • 14.
    A C TI V I T Y 1 Grades in Math and Science of Ten Students Students Math Science Student 1 89 89 Student 2 84 85 Student 3 88 97 Student 4 98 98 Student 5 95 95 Student 6 94 89 Student 7 89 88 Student 8 86 87 Student 9 90 94 Student 10 94 95
  • 15.
    A C TI V I T Y 1 a. How do you think you can get this information? Answer: By interviewing, giving survey questionnaire
  • 16.
    A C TI V I T Y 1 b. Describe the information shown in the table. Answer: It is about the grades in Math and Science of Ten Students
  • 17.
    A C TI V I T Y 1 c. Where did you refer or base your answer in (b)? Answer: From the title of the table
  • 18.
    A C TI V I T Y 1 d. How would you describe a student in the table? What values are you going to use? Answer: Students can be described through their grades in Math or Science.
  • 19.
    A S SE S S M E N T Directions: Answer the questions based on the table.
  • 20.
    A S SE S S M E N T Grades in Math and Science of Ten Students Students Math Science Student 1 89 89 Student 2 84 85 Student 3 88 97 Student 4 98 98 Student 5 95 95 Student 6 94 89 Student 7 89 88 Student 8 86 87 Student 9 90 94 Student 10 94 95
  • 21.
    A S SE S S M E N T 1. Which student has the highest grade in Math? 2. What is the average grade in Science for all ten students?
  • 22.
    A S SE S S M E N T 3. Compare the grades of Student 5 in both Math and Science. How do they differ?
  • 23.
    A S SE S S M E N T 4. Which subject (Math or Science) has a higher average grade across all students?
  • 24.
    A S SE S S M E N T 5. How many students scored above 90 in both Math and Science?
  • 25.
  • 26.
    R E VI E W Directions: Write TRUE if the statement is correct, FALSE if not. _______ 1. A variable can assume different values, not just a single value.
  • 27.
    R E VI E W _______ 2. Gender is an example of a variable that can have two possible values: female or male.
  • 28.
    R E VI E W _______ 3. Data refers to facts, numbers, names, or descriptions of things that are collected through observations, measurements, or analysis.
  • 29.
    R E VI E W _______ 4. Bivariate data contains two variables, not just one.
  • 30.
    R E VI E W _______ 5. Data pairs or bivariate data consist of paired observations for two variables, such as age and weight, or hours studied and test scores.
  • 31.
    M O TI VAT I O N How can data pairs (bivariate data) be collected from interviews, questionnaires, and other appropriate sources, and what is an example of such data?
  • 32.
    COLLECTS DATA PAIRS (BIVARIATE) FROMINTERVIEW, QUESTIONNAIRE, AND OTHER APPROPRIATE SOURCES
  • 33.
    D I SC U S S I O N To collect data pairs, it is needed to design a data collection method that involves gathering information on two variables simultaneously. Here are a few approaches to collect data pairs:
  • 34.
    D I SC U S S I O N a. Interviews - a structured conversation where one participant asks questions, and the other provides answers. It is where you ask participants questions about two data.
  • 35.
    D I SC U S S I O N During the interview, record the responses for both data. For example, interview individuals about their daily exercise habits and their stress levels.
  • 36.
    D I SC U S S I O N b. Questionnaire - consists of a set of questions to collect information from a respondent. A survey or questionnaire that includes questions related to two data of interest.
  • 37.
    D I SC U S S I O N Participants can provide responses for both data in the same survey form. For example, you could survey about their age and their level of satisfaction with their stay in the school.
  • 38.
    D I SC U S S I O N Other examples of data pairs may be collected using interview or questionnaire are the following: a) Grades and number of hours spend in studying b) Grade in Math and Grade in Science c) Height and weight
  • 39.
    A C TI V I T Y 2 Directions: I will group you into 3 members. You will survey 15 of your classmates using one of the questionnaires below.
  • 40.
    A C TI V I T Y 2 Survey 1: Q 1: What is your height? Q 2: What is your weight? Survey 2 Q 1: How many brothers do you have? Q 2: How old are you?
  • 41.
    A C TI V I T Y 2 Survey 3: Q 1: How many times do you check your cellphones for new message in an hour? Q 2: How many hours do you spend in doing your homework?
  • 42.
    A S SE S S M E N T Directions: Organize the data from the questionnaire and construct a table.
  • 43.
  • 44.
    R E VI E W Data presentation of activities
  • 45.
    M O TI VAT I O N What other method or presentation can be used to display responses in a survey? ARGPHS Answer: GRAPHS
  • 46.
  • 47.
    D I SC U S S I O N What is a Bar Graph? a) Bar Graph is a graph which uses either horizontal or vertical bars to represent data. The types of bar graph include horizontal bar graph and vertical bar graph.
  • 48.
    D I SC U S S I O N b) The length of a bar represents a quantity. Therefore, bars can be compared by examining the bar lengths.
  • 49.
    D I SC U S S I O N c) In the vertical bar graph, bars extend from bottom to top. The vertical line is the scale of the graph.
  • 50.
    D I SC U S S I O N d) When to use the bar graph? Bar graphs are effective for visually representing data or for comparing different categories.
  • 51.
    D I SC U S S I O N Examples: 1. Comparing the grades or scores of students in different subjects or classes.
  • 52.
    D I SC U S S I O N Examples: 2. Displaying the distribution of responses to a multiple-choice question (e.g., favorite color, preferred mode of transportation) among survey participants)
  • 53.
    D I SC U S S I O N
  • 54.
    A C TI V I T Y 3 Directions: Answer the following questions based on the bar graph. 1. How many students chose Basketball as their favorite sport?
  • 55.
    A C TI V I T Y 3 2. Which sport has the fewest number of students who consider it their favorite? 3. What is the total number of students who chose Football and Rugby combined?
  • 56.
    A C TI V I T Y 3 4. Based on the scale, how many students prefer Tennis as their favorite sport? 5. Which sport has more students who prefer it, Football or Tennis?
  • 57.
    A S SE S S M E N T
  • 58.
    A S SE S S M E N T 1) What is the data about? 2) What do those bars represent?
  • 59.
    A S SE S S M E N T 3) What information does the last bar represent? 4) How many teachers opposed the change in school starting time?
  • 60.
    A S SE S S M E N T 5. How many teachers favored the change in school starting time?
  • 61.
  • 62.
    R E VI E W Directions: Answer the following questions based on the table.
  • 63.
    R E VI E W
  • 64.
    R E VI E W 1. Which day of the week had the highest number of absences? 2. How many absences were recorded on Wednesday?
  • 65.
    R E VI E W 3. What is the total number of absences for the first week of April? 4. Which two days had the same number of absences?
  • 66.
    R E VI E W 5. How many more absences were recorded on Friday compared to Tuesday?
  • 67.
    M O TI VAT I O N What is a line graph? ✔ Line graph is a type of graph used to represent changes in data over a period of time. Usually, data are represented by points and are connected by line segments.
  • 68.
    M O TI VAT I O N What is a line graph? ✔ In general, the horizontal axis is used as the time axis and the vertical axis is used to show the changes in the other quantity.
  • 69.
  • 70.
    D I SC U S S I O N
  • 71.
    D I SC U S S I O N a. What information can you read/see from the line graph? The line graph shows temperature on September 1 from 9am to 4pm.
  • 72.
    D I SC U S S I O N b. What values are found in the x- axis? y axis? In x – axis is time from 9am to 4pm where the temperature in Sept 1 were taken/recorded. In the y- axis is the temperature in degrees Celsius.
  • 73.
    D I SC U S S I O N c. What is the temperature on Sept 1 at 4 pm? (16 degree Celsius) d. What is the highest recorded temperature on Sept 1? (16 degree Celsius
  • 74.
    D I SC U S S I O N When to use the line graph? Data like changes in population, temperature, and profit can be represented by a line graph
  • 75.
    D I SC U S S I O N Examples: a. Daily temperature of San Ignacio Elementary School for 7 days to monitor heat index b. Number of boxes of donuts sold in a week c. Population in Pampanga Province for a period of 6 years.
  • 76.
    A C TI V I T Y 4
  • 77.
    A C TI V I T Y 4 A. Refer to the line graph in answering the following questions. 1. What information can you read/see from the line graph?
  • 78.
    A C TI V I T Y 4 2. Which data from the graph indicates a period of time? 3. What is lowest point(s) of the line graph? Describe the lowest point using the data values found in the x and y axis.
  • 79.
    A C TI V I T Y 4 4. Identify one information that they can read from the graph.
  • 80.
    A C TI V I T Y 4 B. Identify the following as Bar graph or Line graph. __________________1. It is commonly drawn to show information that changes over time.
  • 81.
    A C TI V I T Y 4 __________________2. It represents numerical data by double bars or rectangles of equal width and varying height. __________________3. It is particularly useful for showing similar data between two different groups.
  • 82.
    A S SE S S M E N T A. Given the tables, identify what is the appropriate graph to be used. Write L for Line Graph and B for Bar Graph.
  • 83.
    A S SE S S M E N T 1. __________ 2. __________
  • 84.
    A S SE S S M E N T B. Which line graph correctly represents changes in Kelly’s heights from 0 years to 8 years old? The table below shows the data.
  • 85.
    A S SE S S M E N T
  • 86.
    A S SE S S M E N T

Editor's Notes