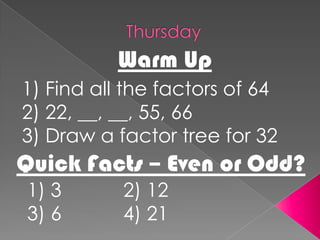
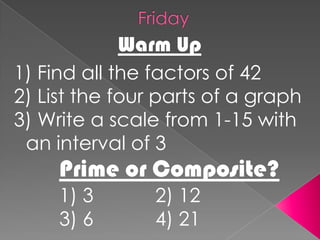
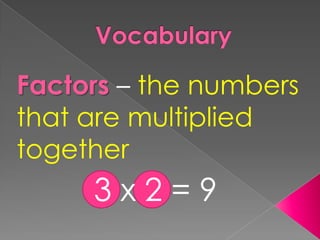
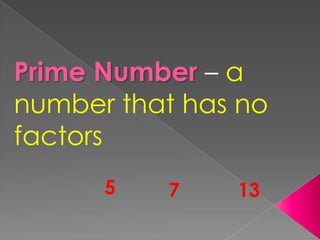
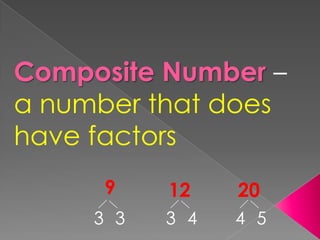
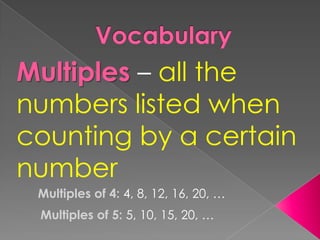
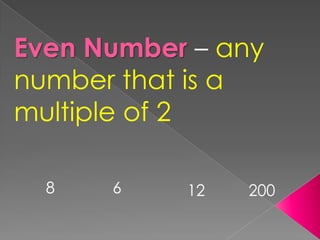
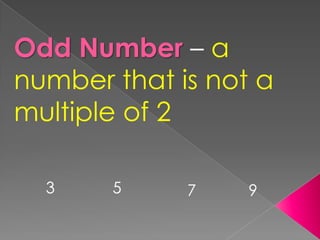
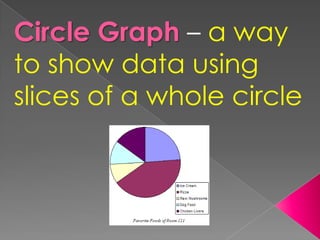
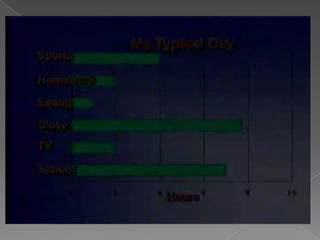
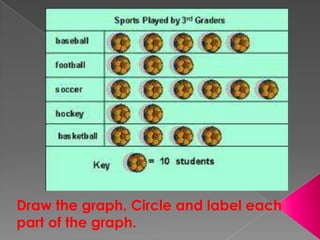
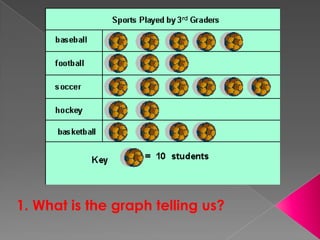
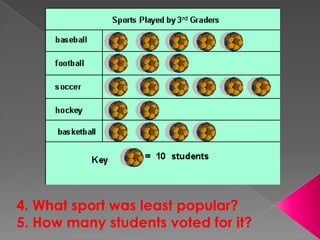
This document summarizes a student's math journal entries for one week. It includes warm-up problems and quick fact questions for each day, along with vocabulary definitions and lessons on circle graphs and pictographs. Key topics covered are factors, multiples, even/odd numbers, prime/composite numbers, and how to read and create circle graphs and pictographs to display data.


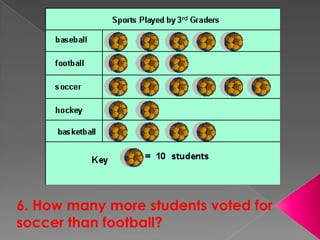


![5G Explained! A High Level Overview [Introduction]](https://cdn.slidesharecdn.com/ss_thumbnails/5gexplainedahighleveloverview-260119165306-cc137a3e-thumbnail.jpg?width=640&height=640&fit=bounds)


