Downloaded 325 times


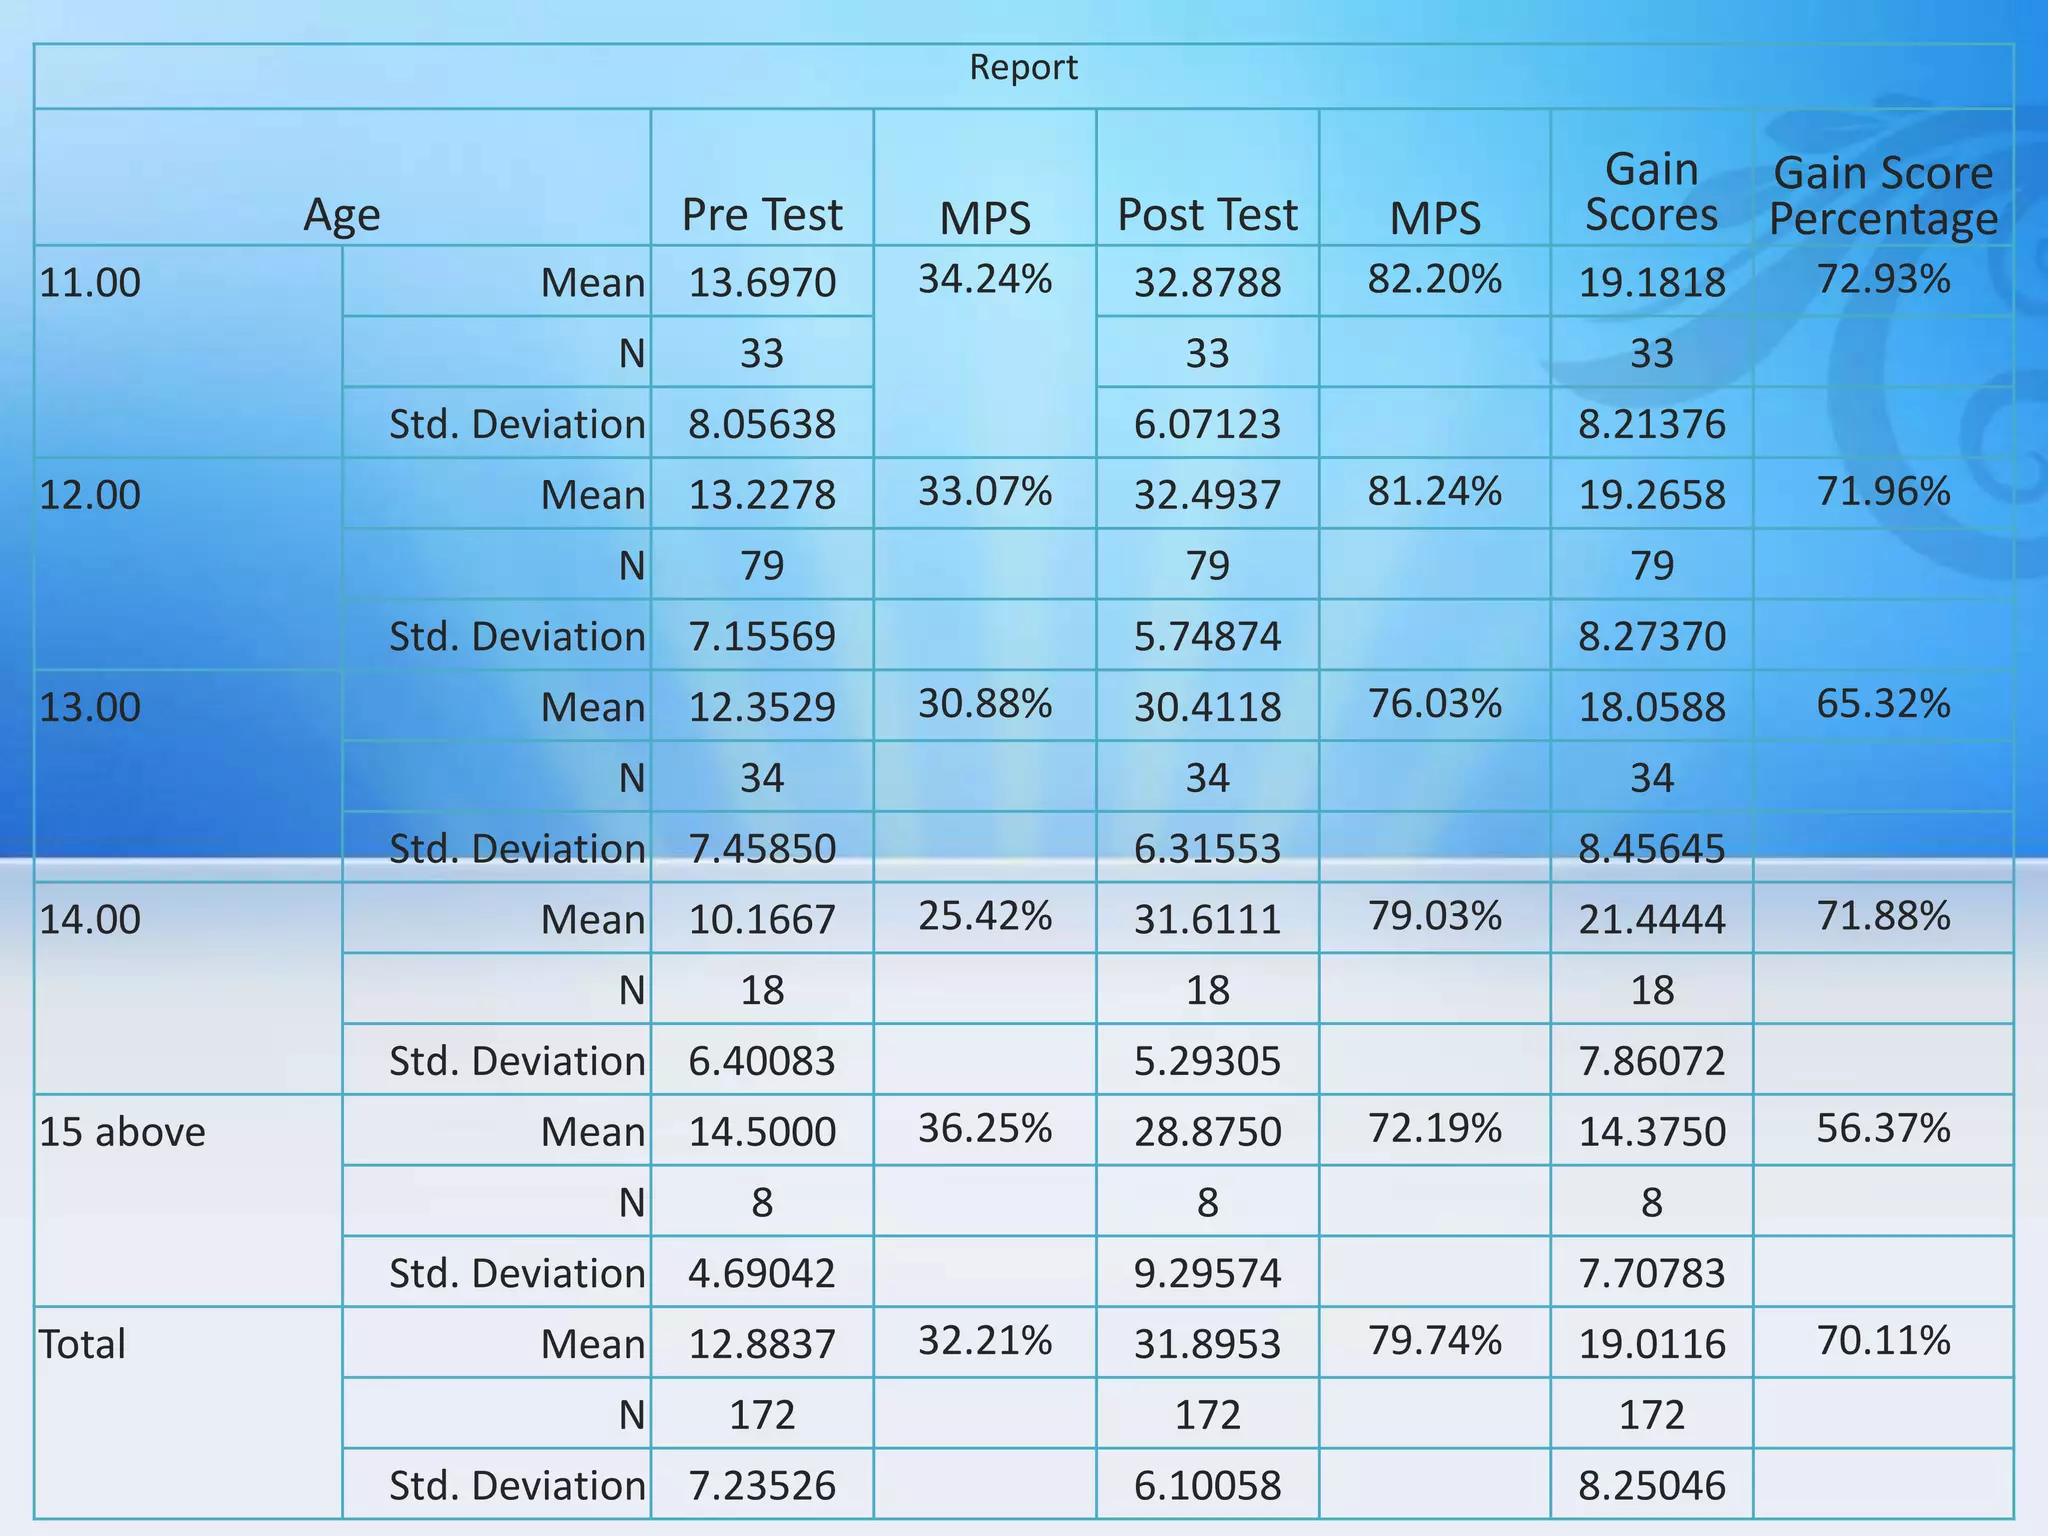
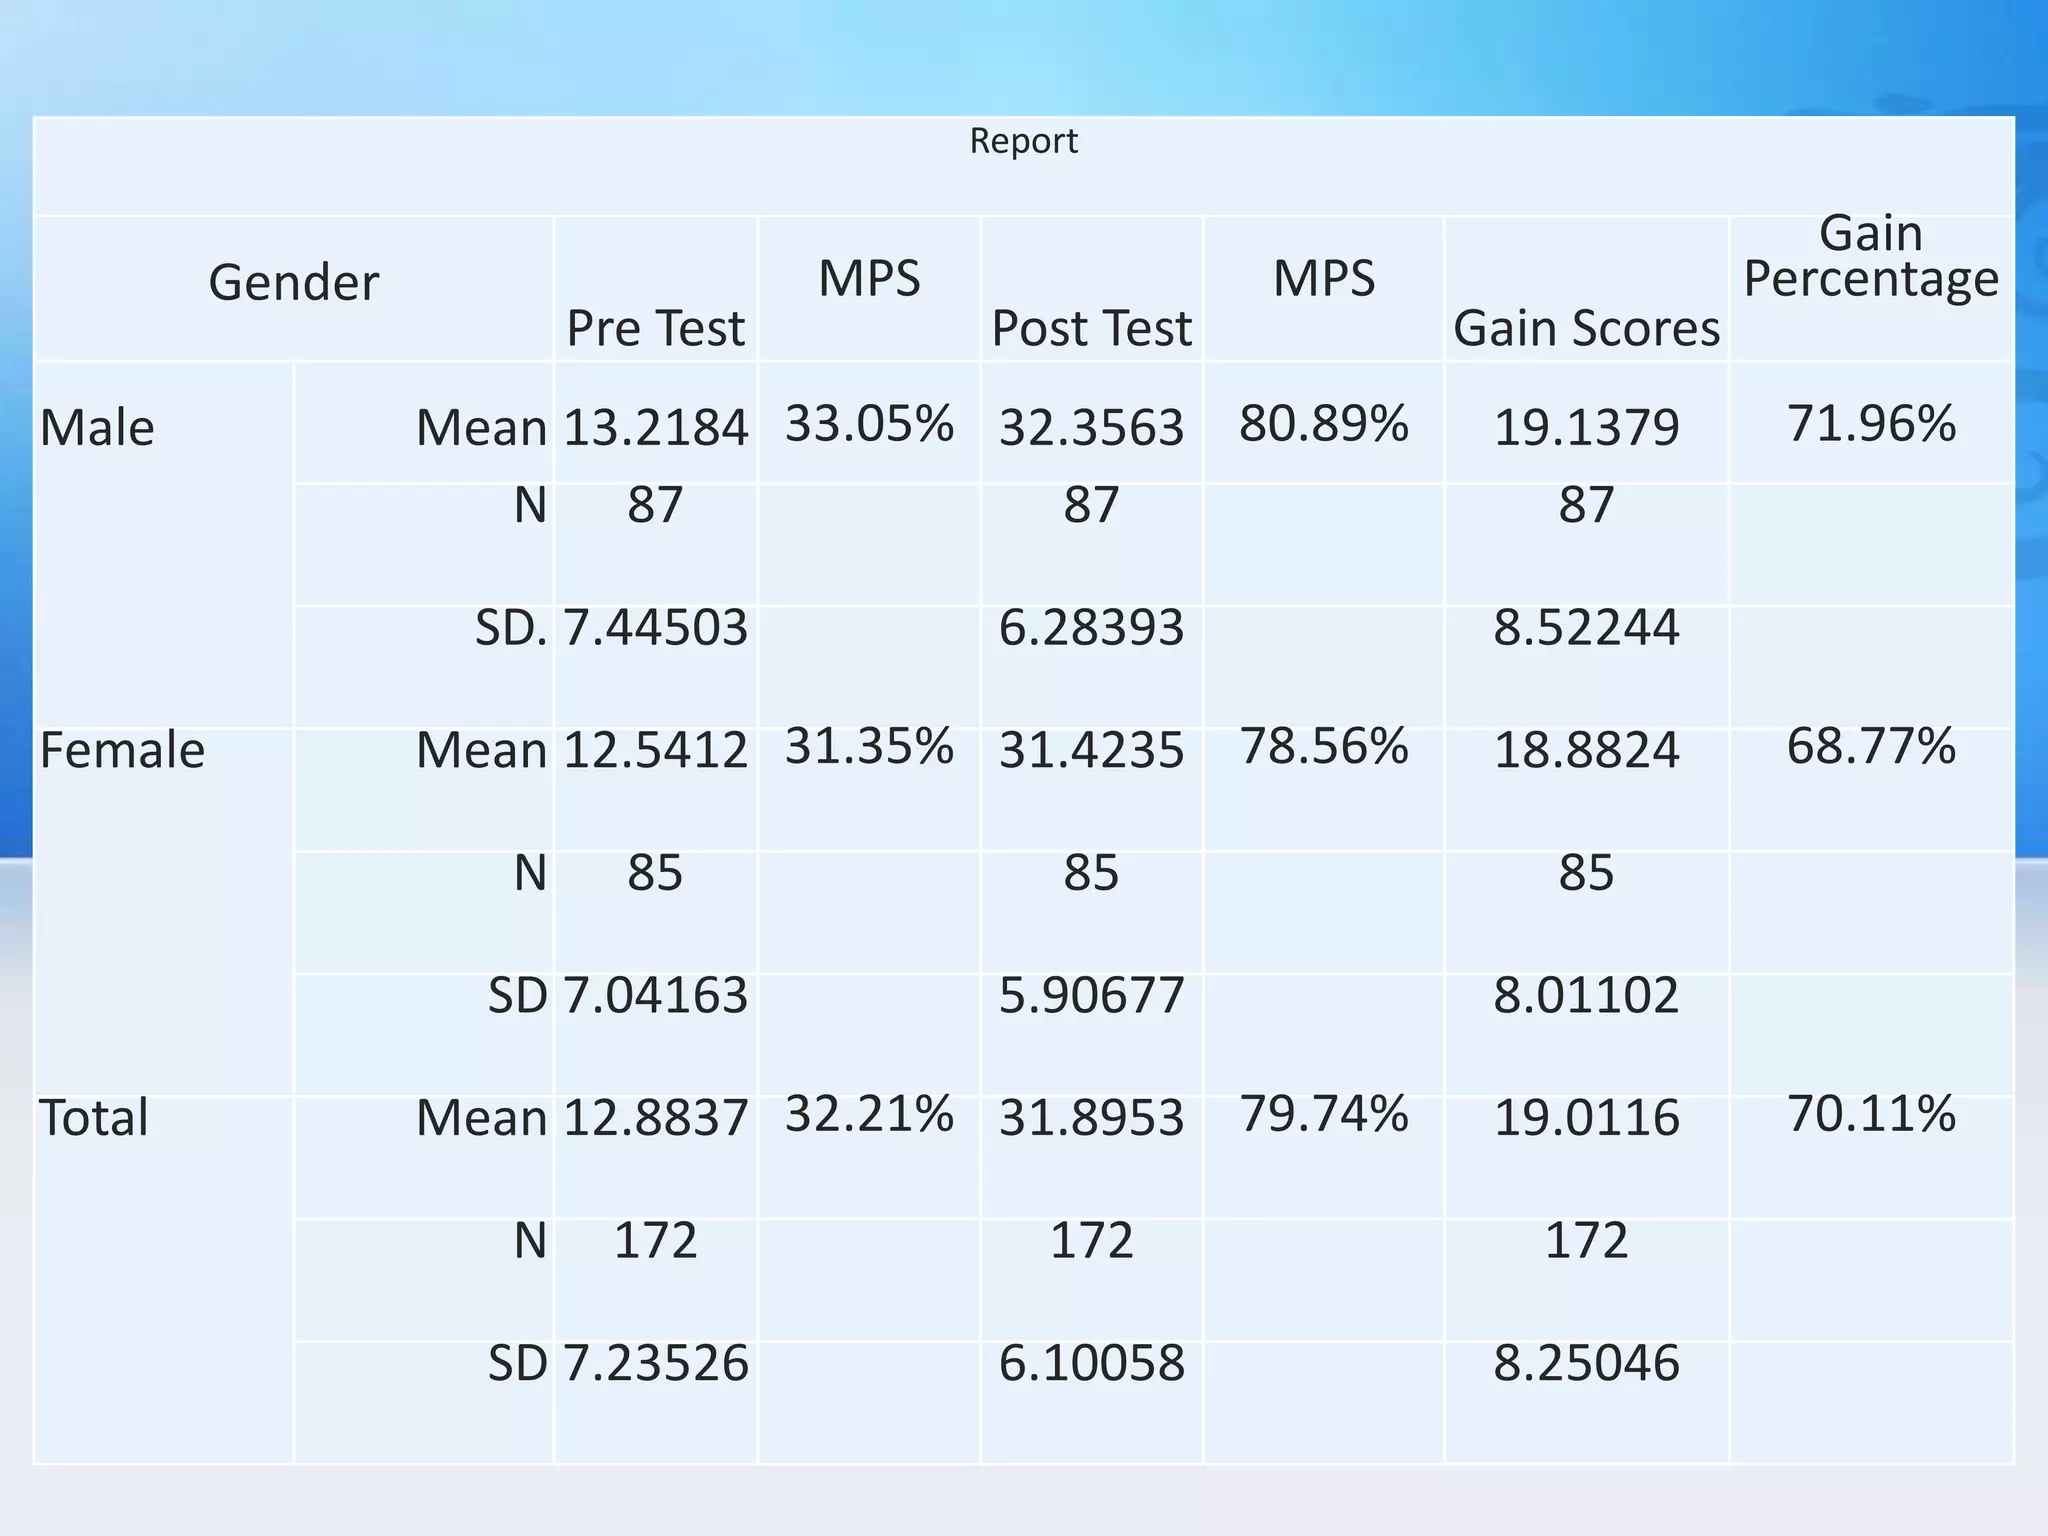
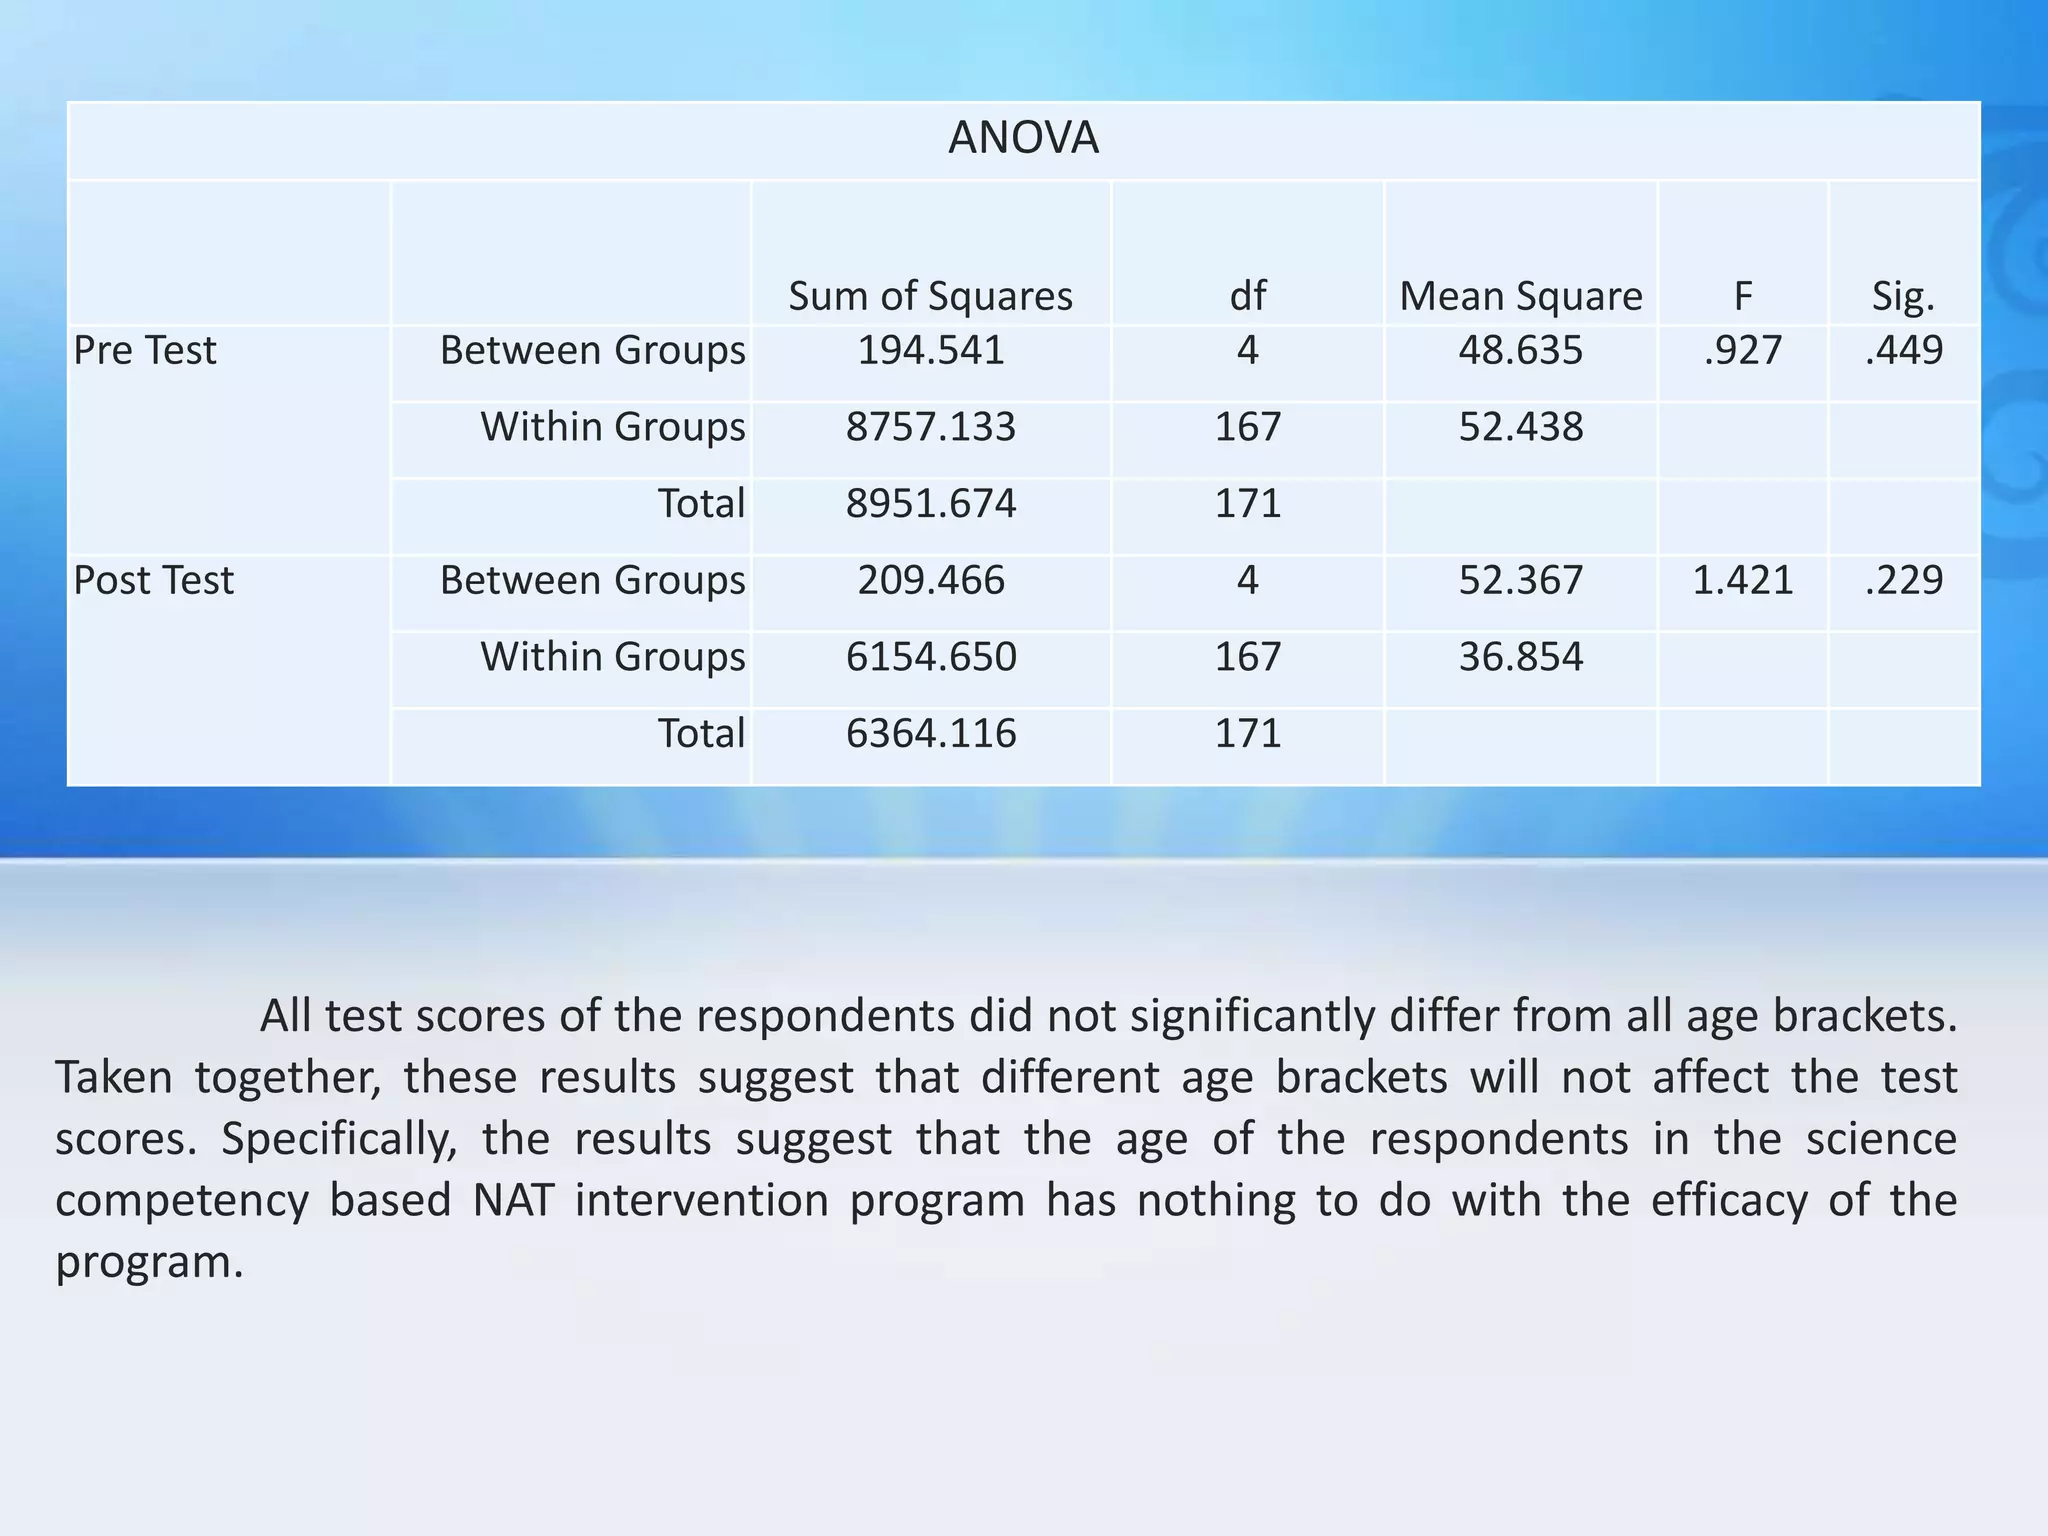
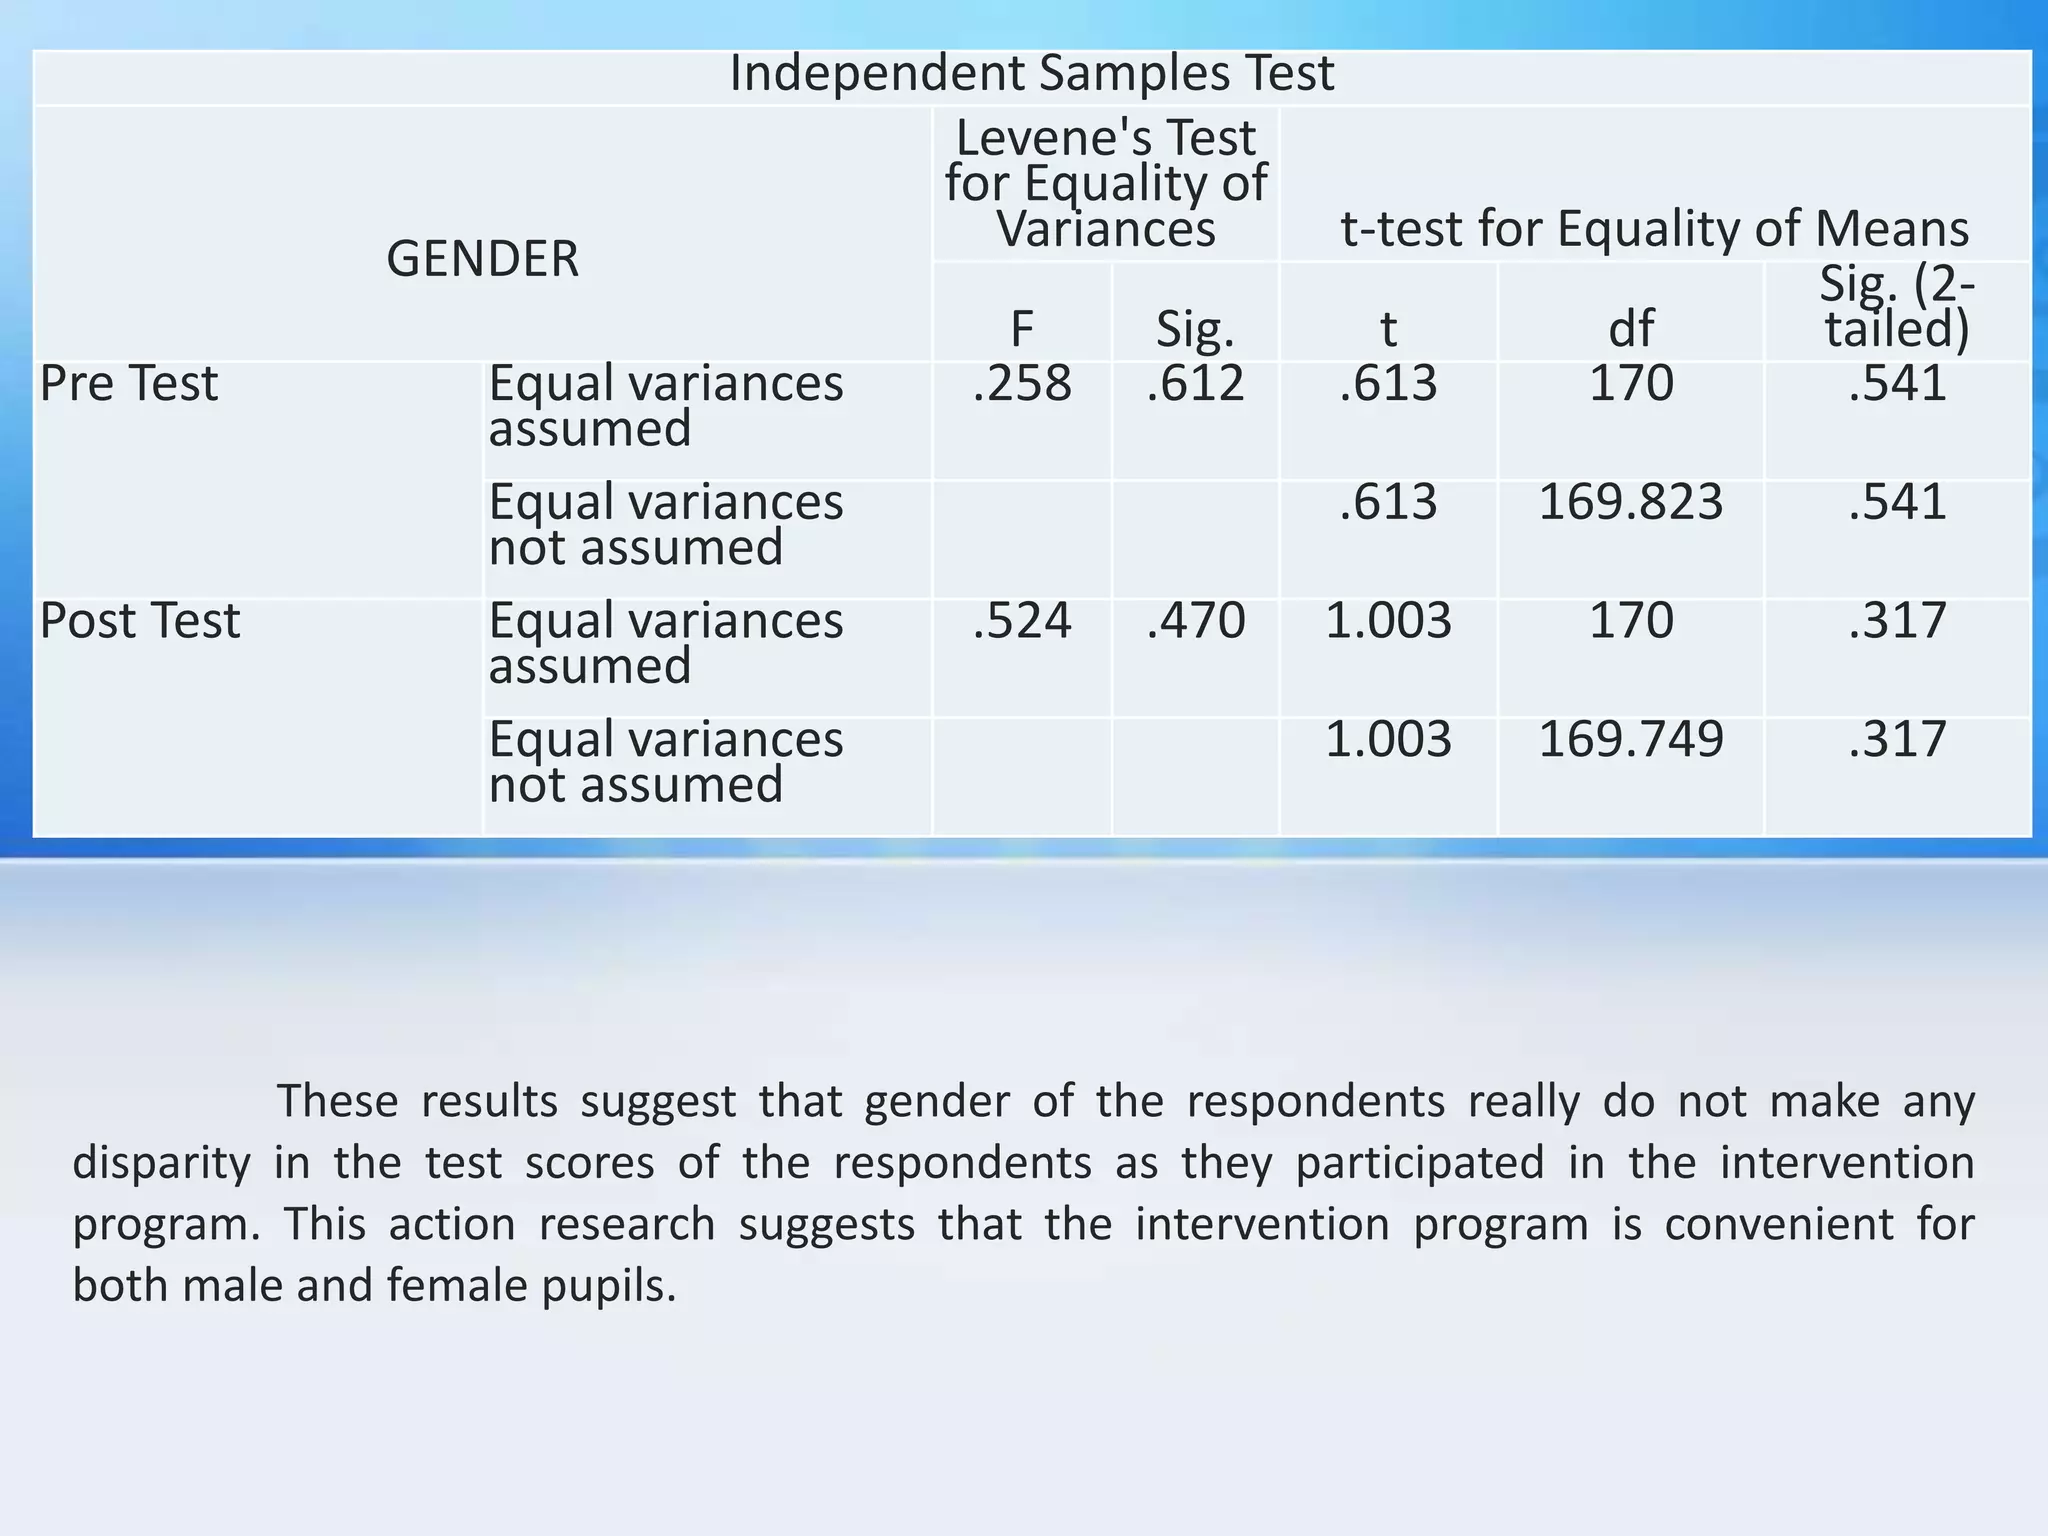
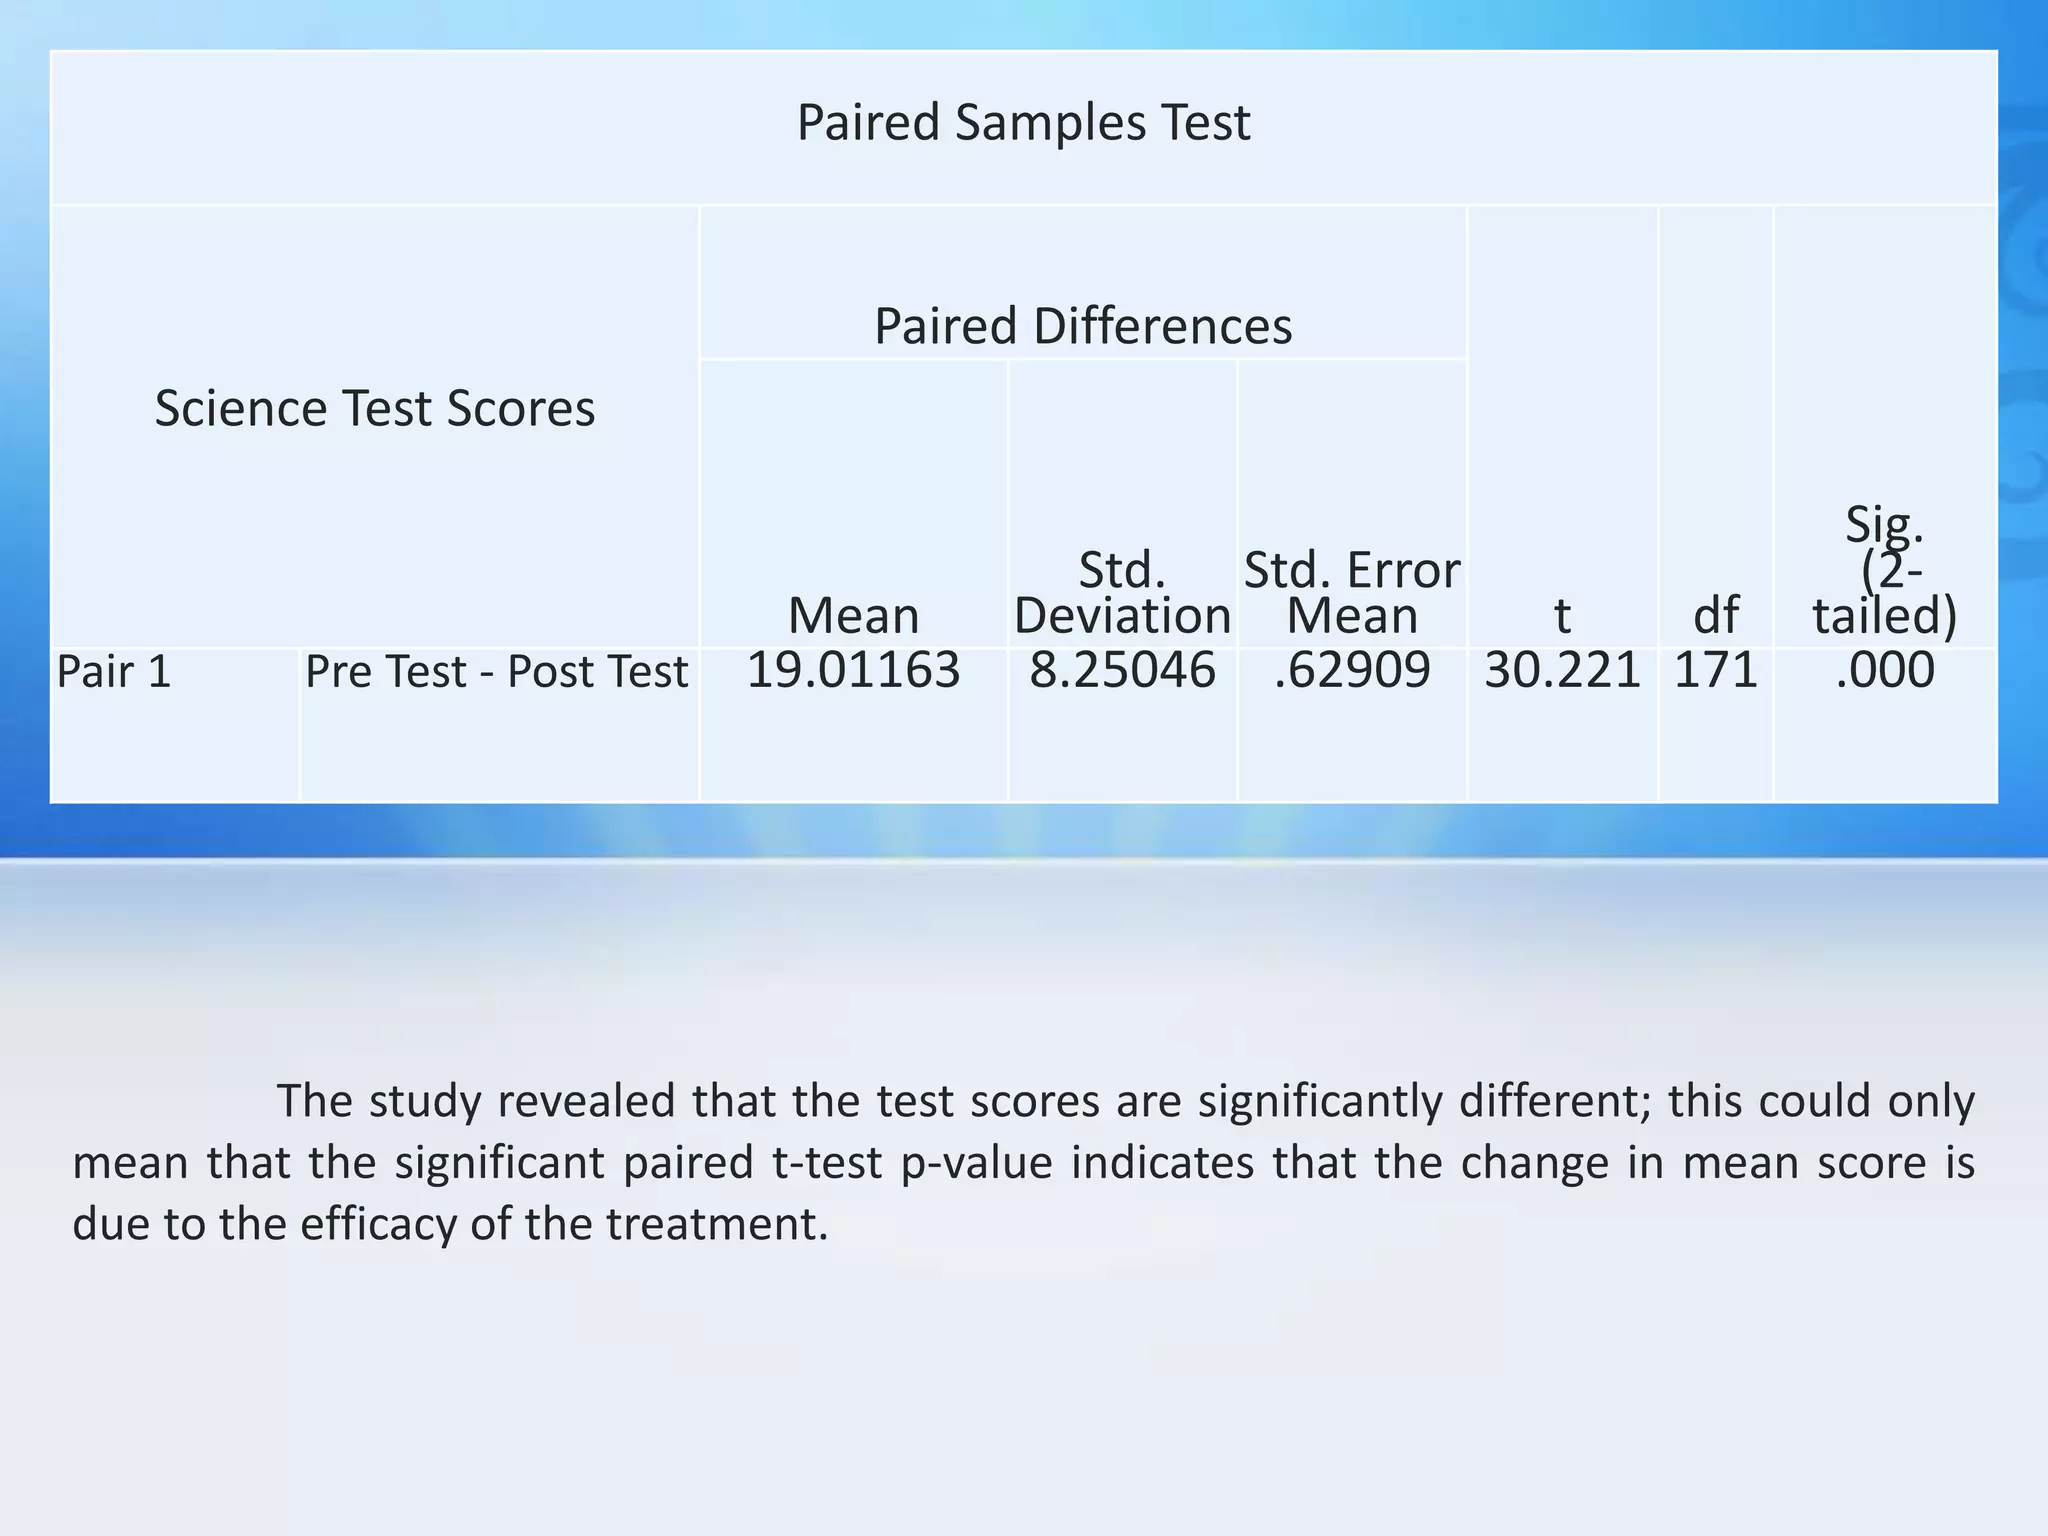
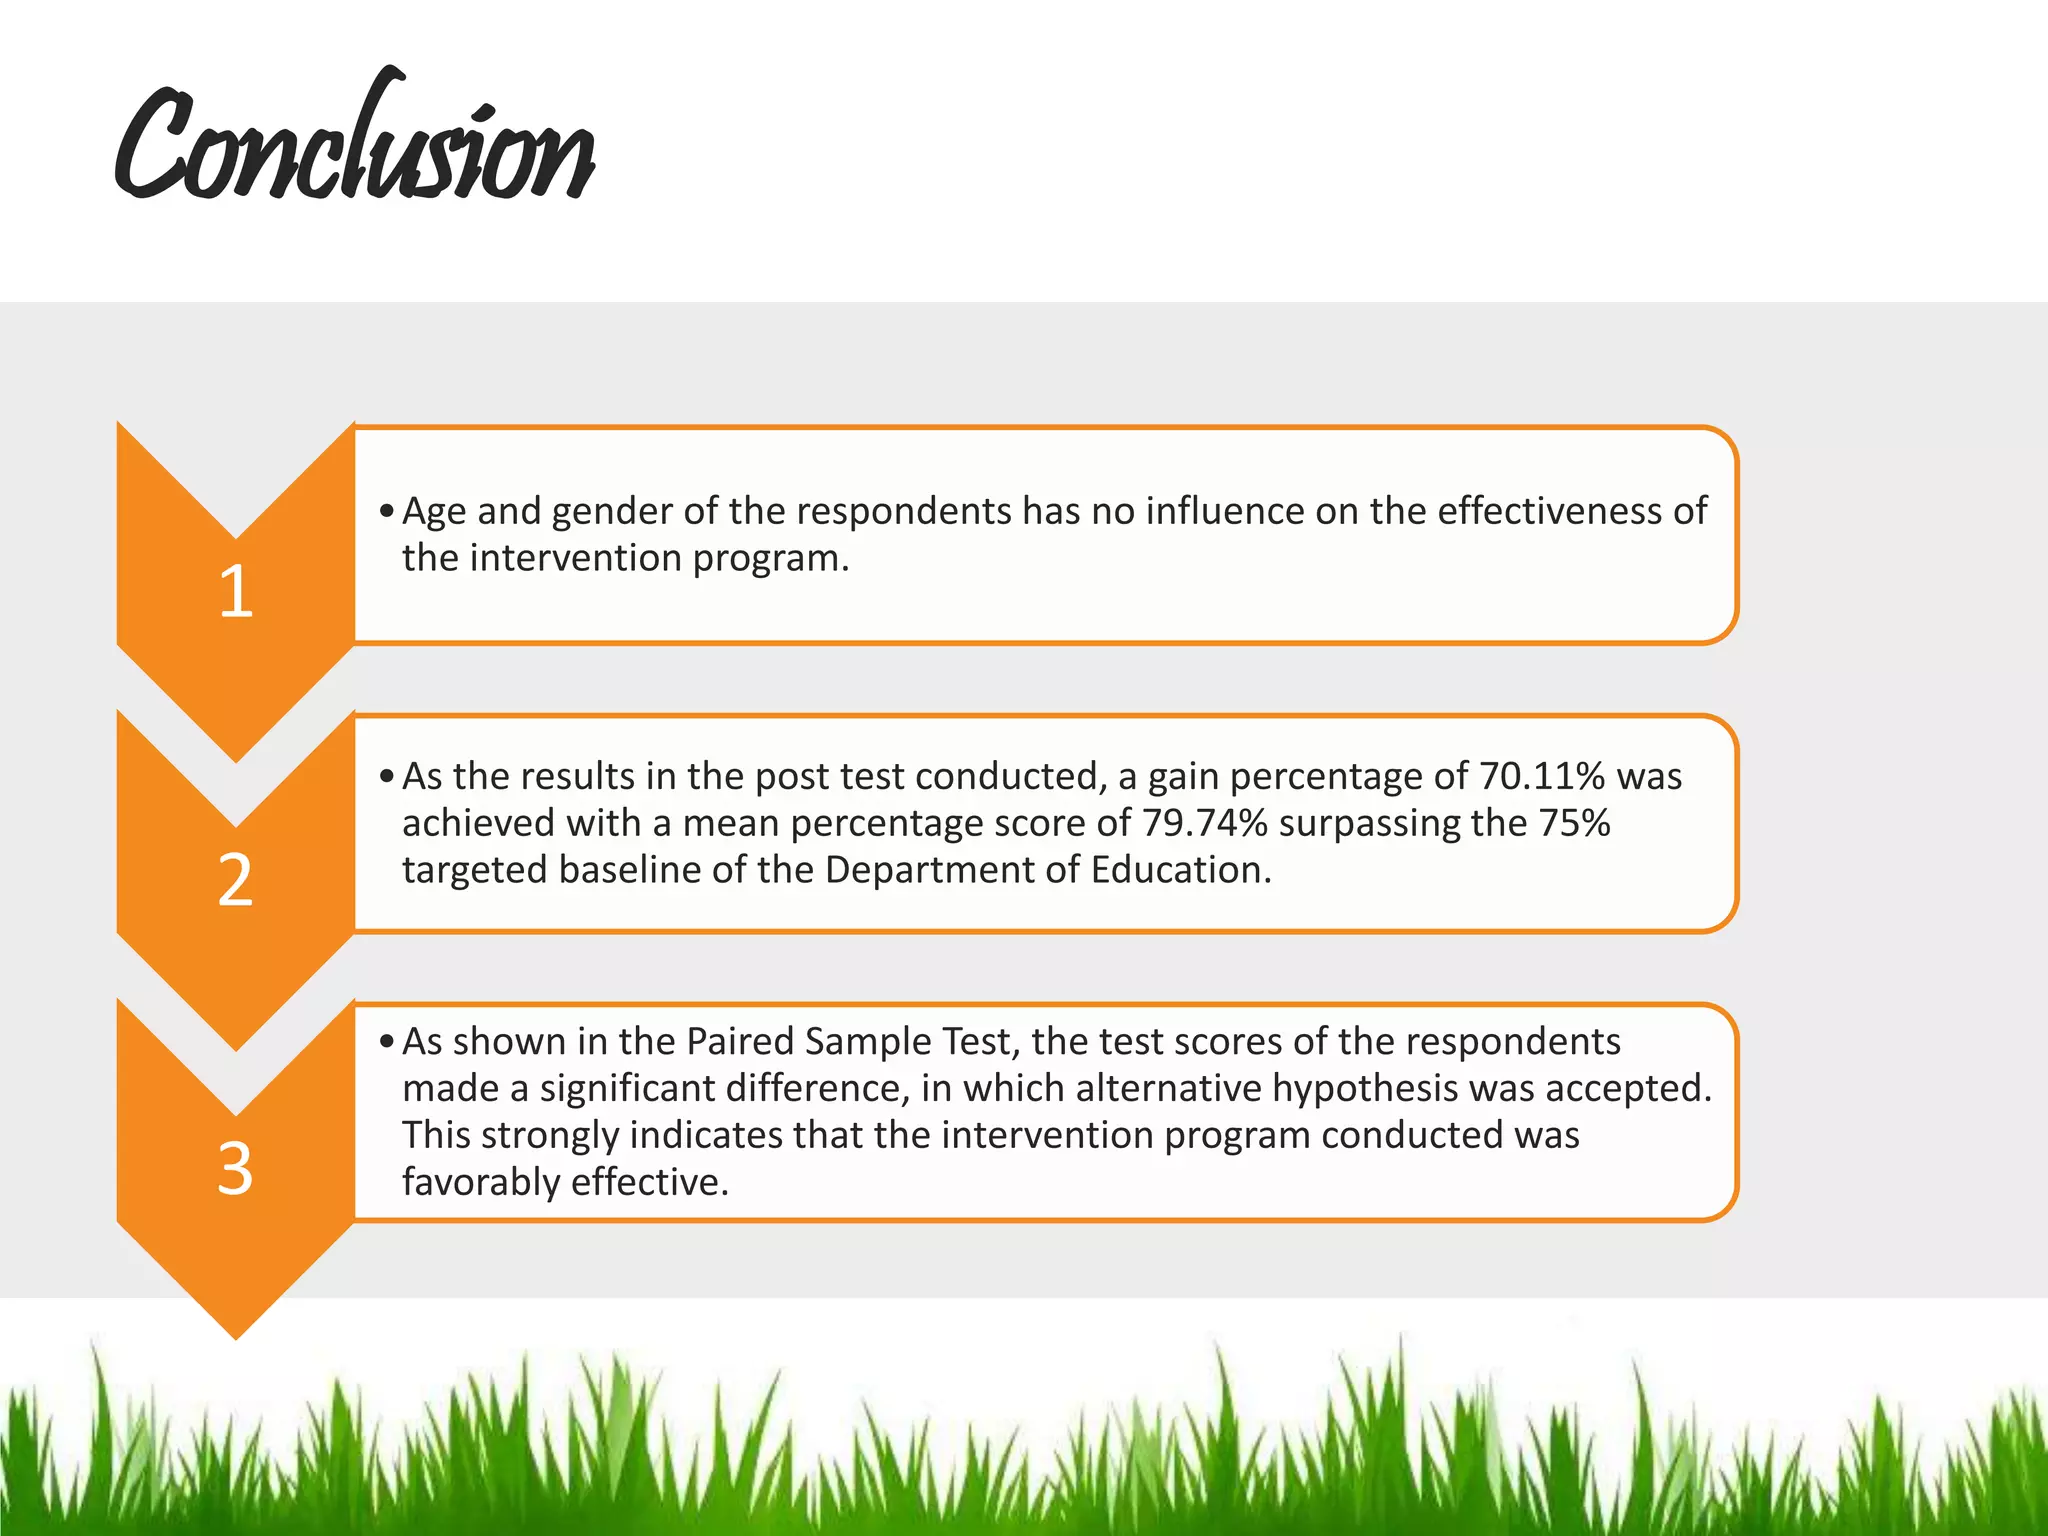

1. The study evaluated a competency-based science intervention program for 6th grade students at Union Elementary School who had achieved below average scores on the National Achievement Test (NAT) in science. 2. Results showed students achieved a 70.11% gain in science test scores with a post-test mean of 79.74%, surpassing the target of 75%. 3. Statistical analysis found the improvement in test scores was significant and not influenced by student age or gender, indicating the intervention program was effective.
Introduction of Action Research on Science Competency aimed at improving Grade VI performance in Union Elementary.
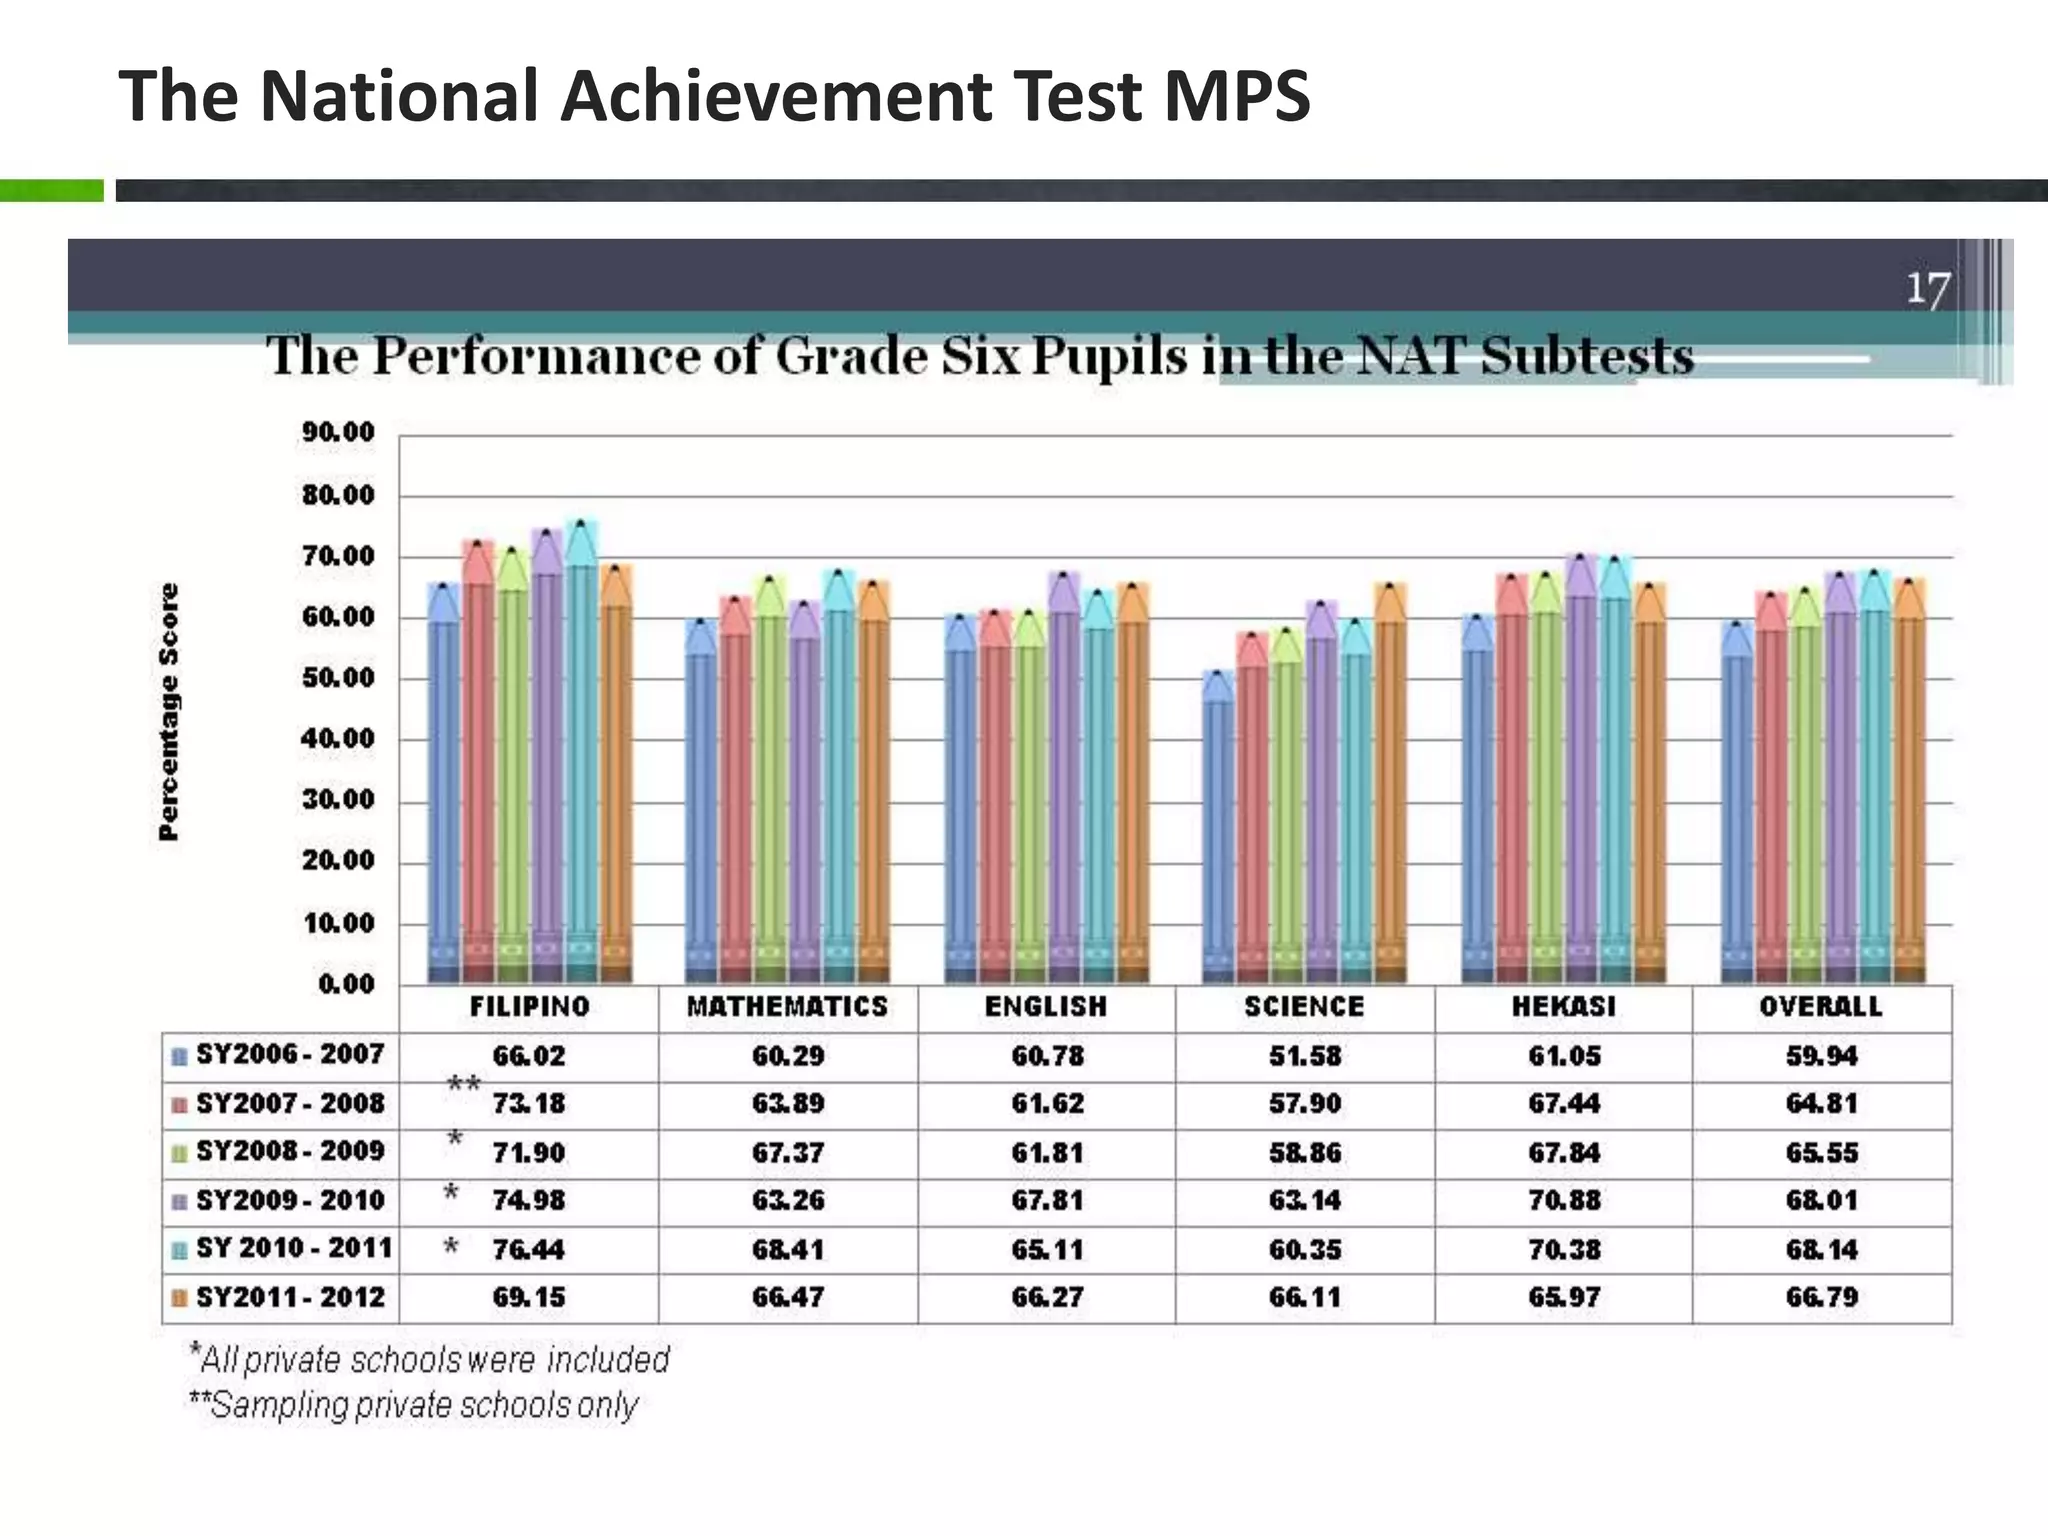
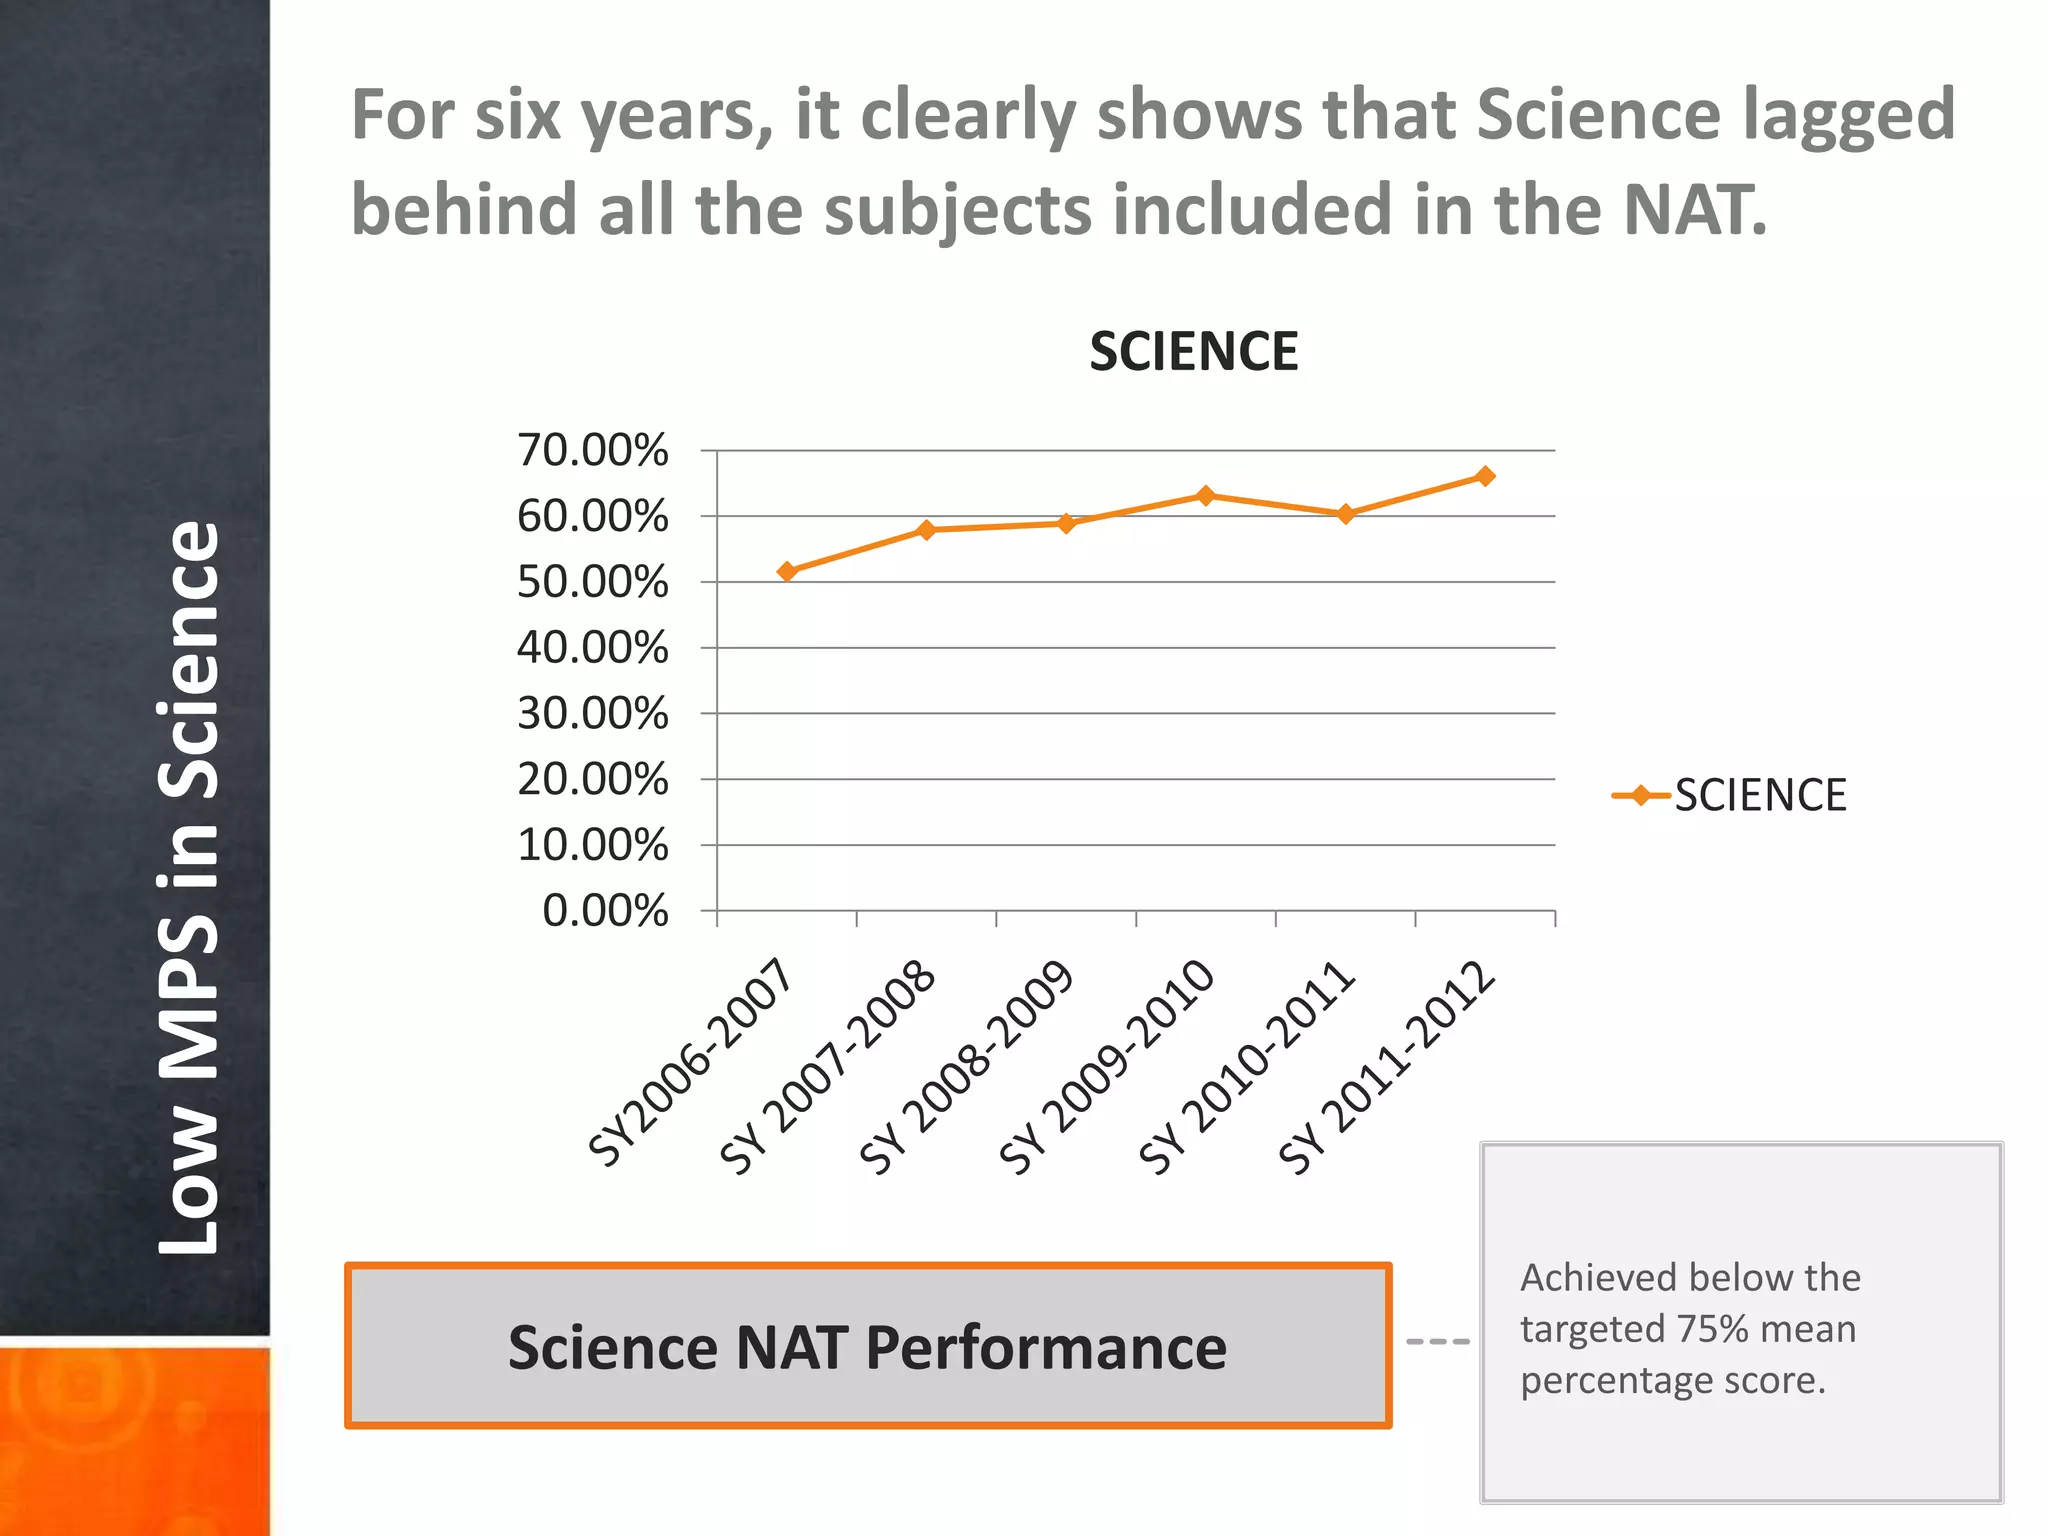
Analysis of low National Achievement Test (NAT) scores in Science over six years indicating need for intervention.
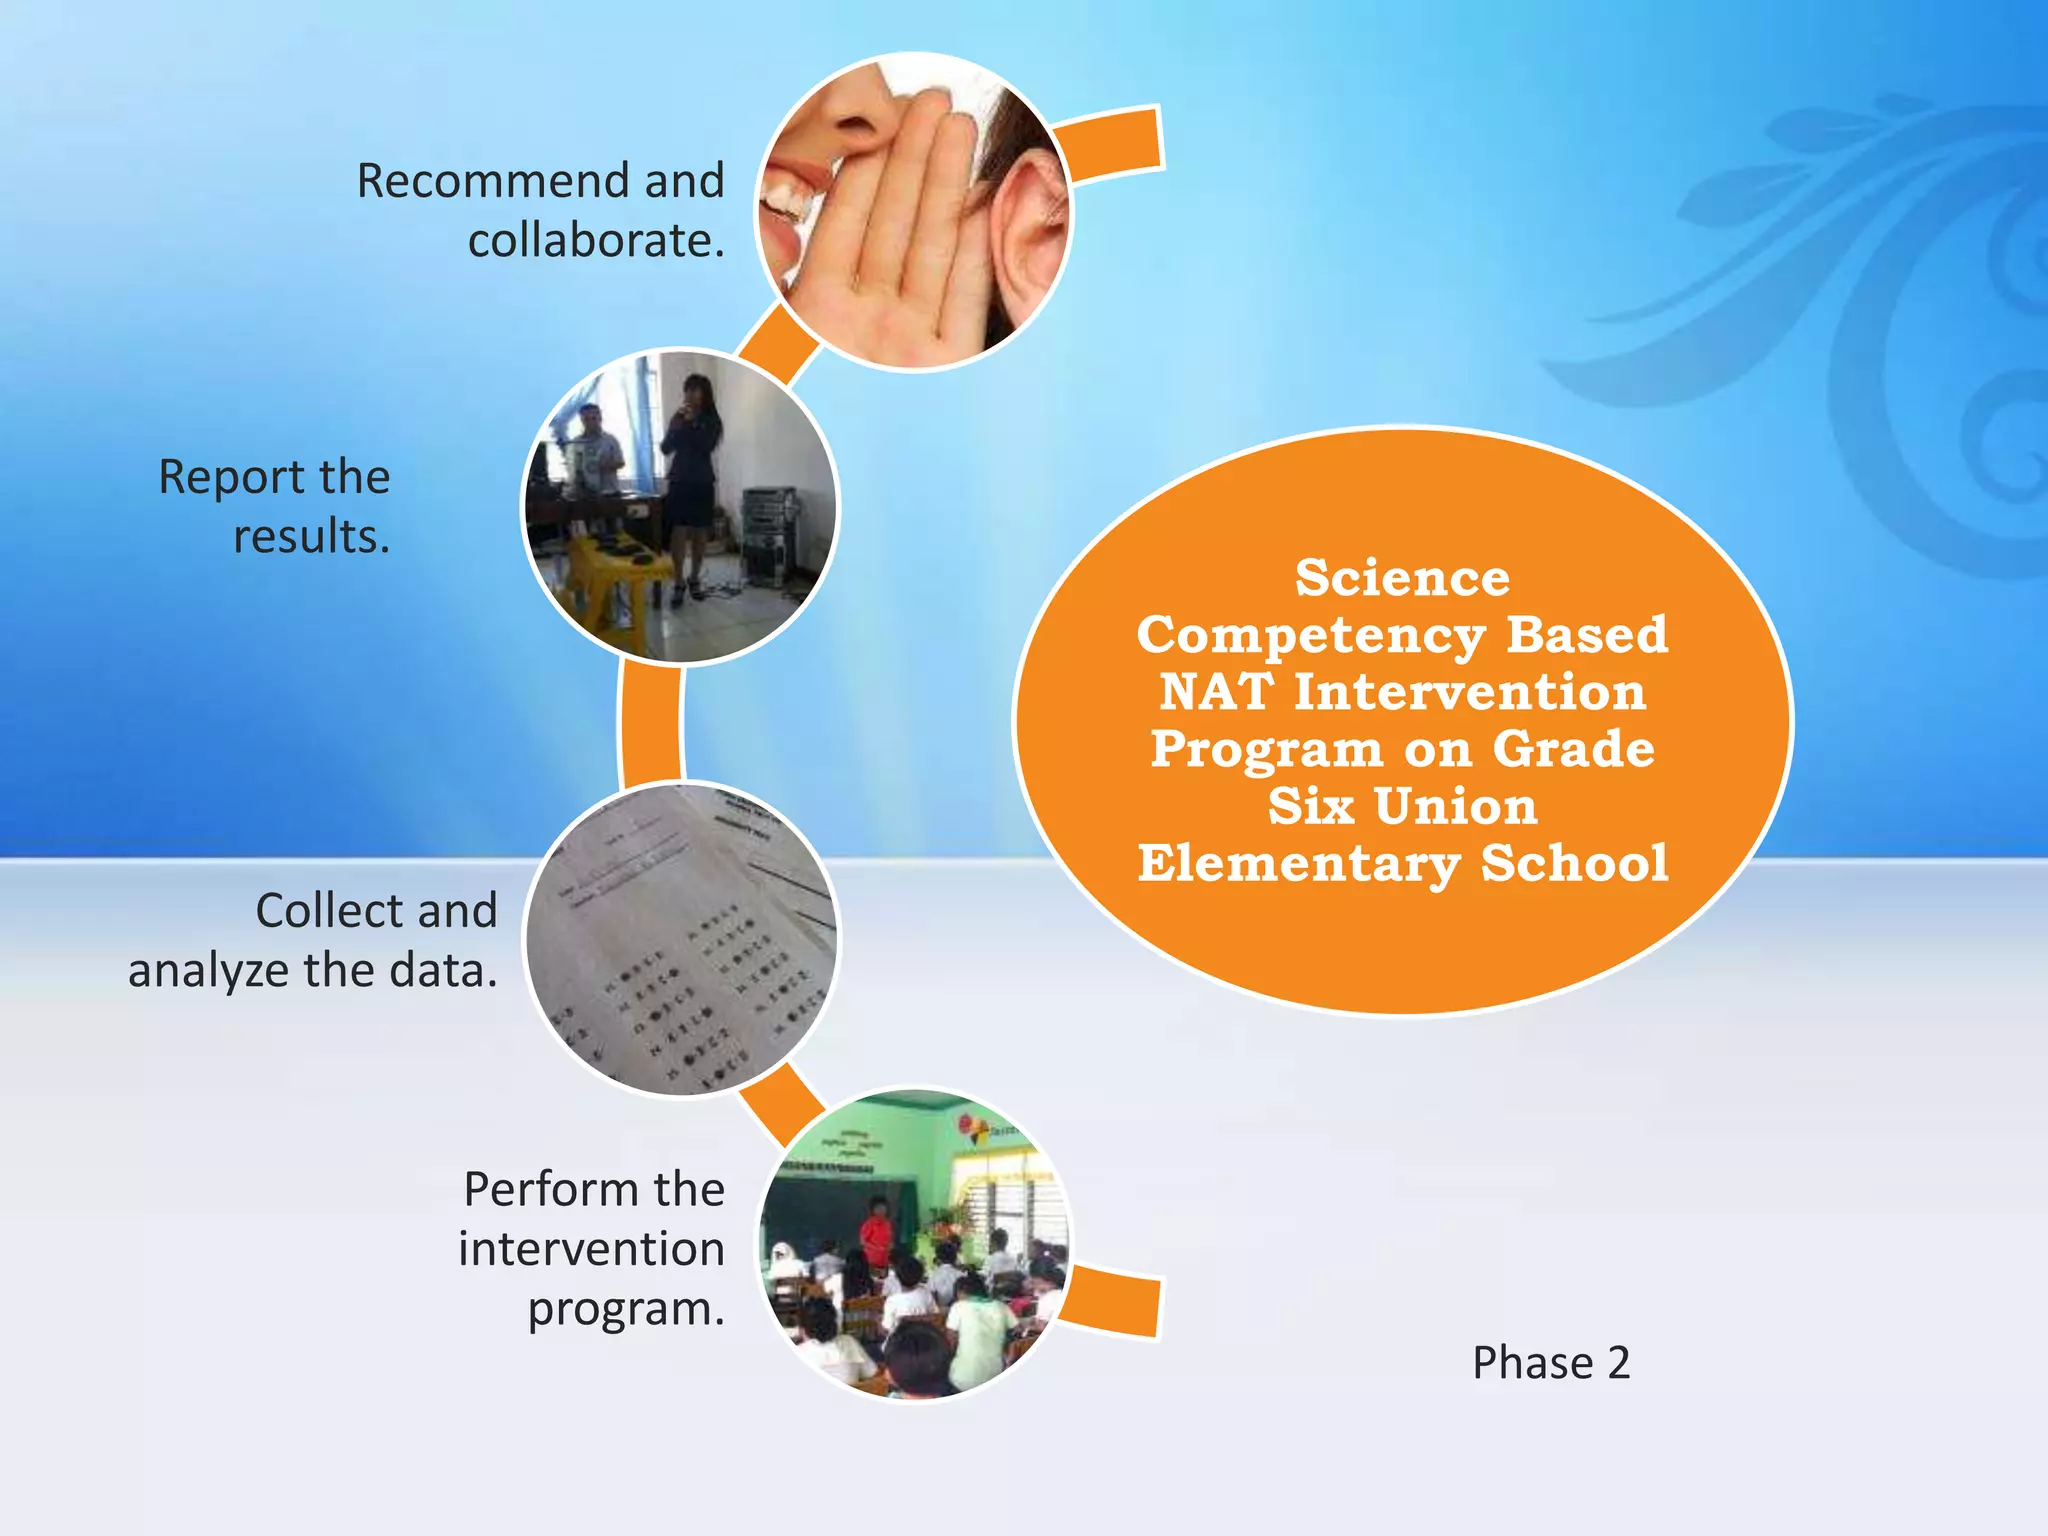
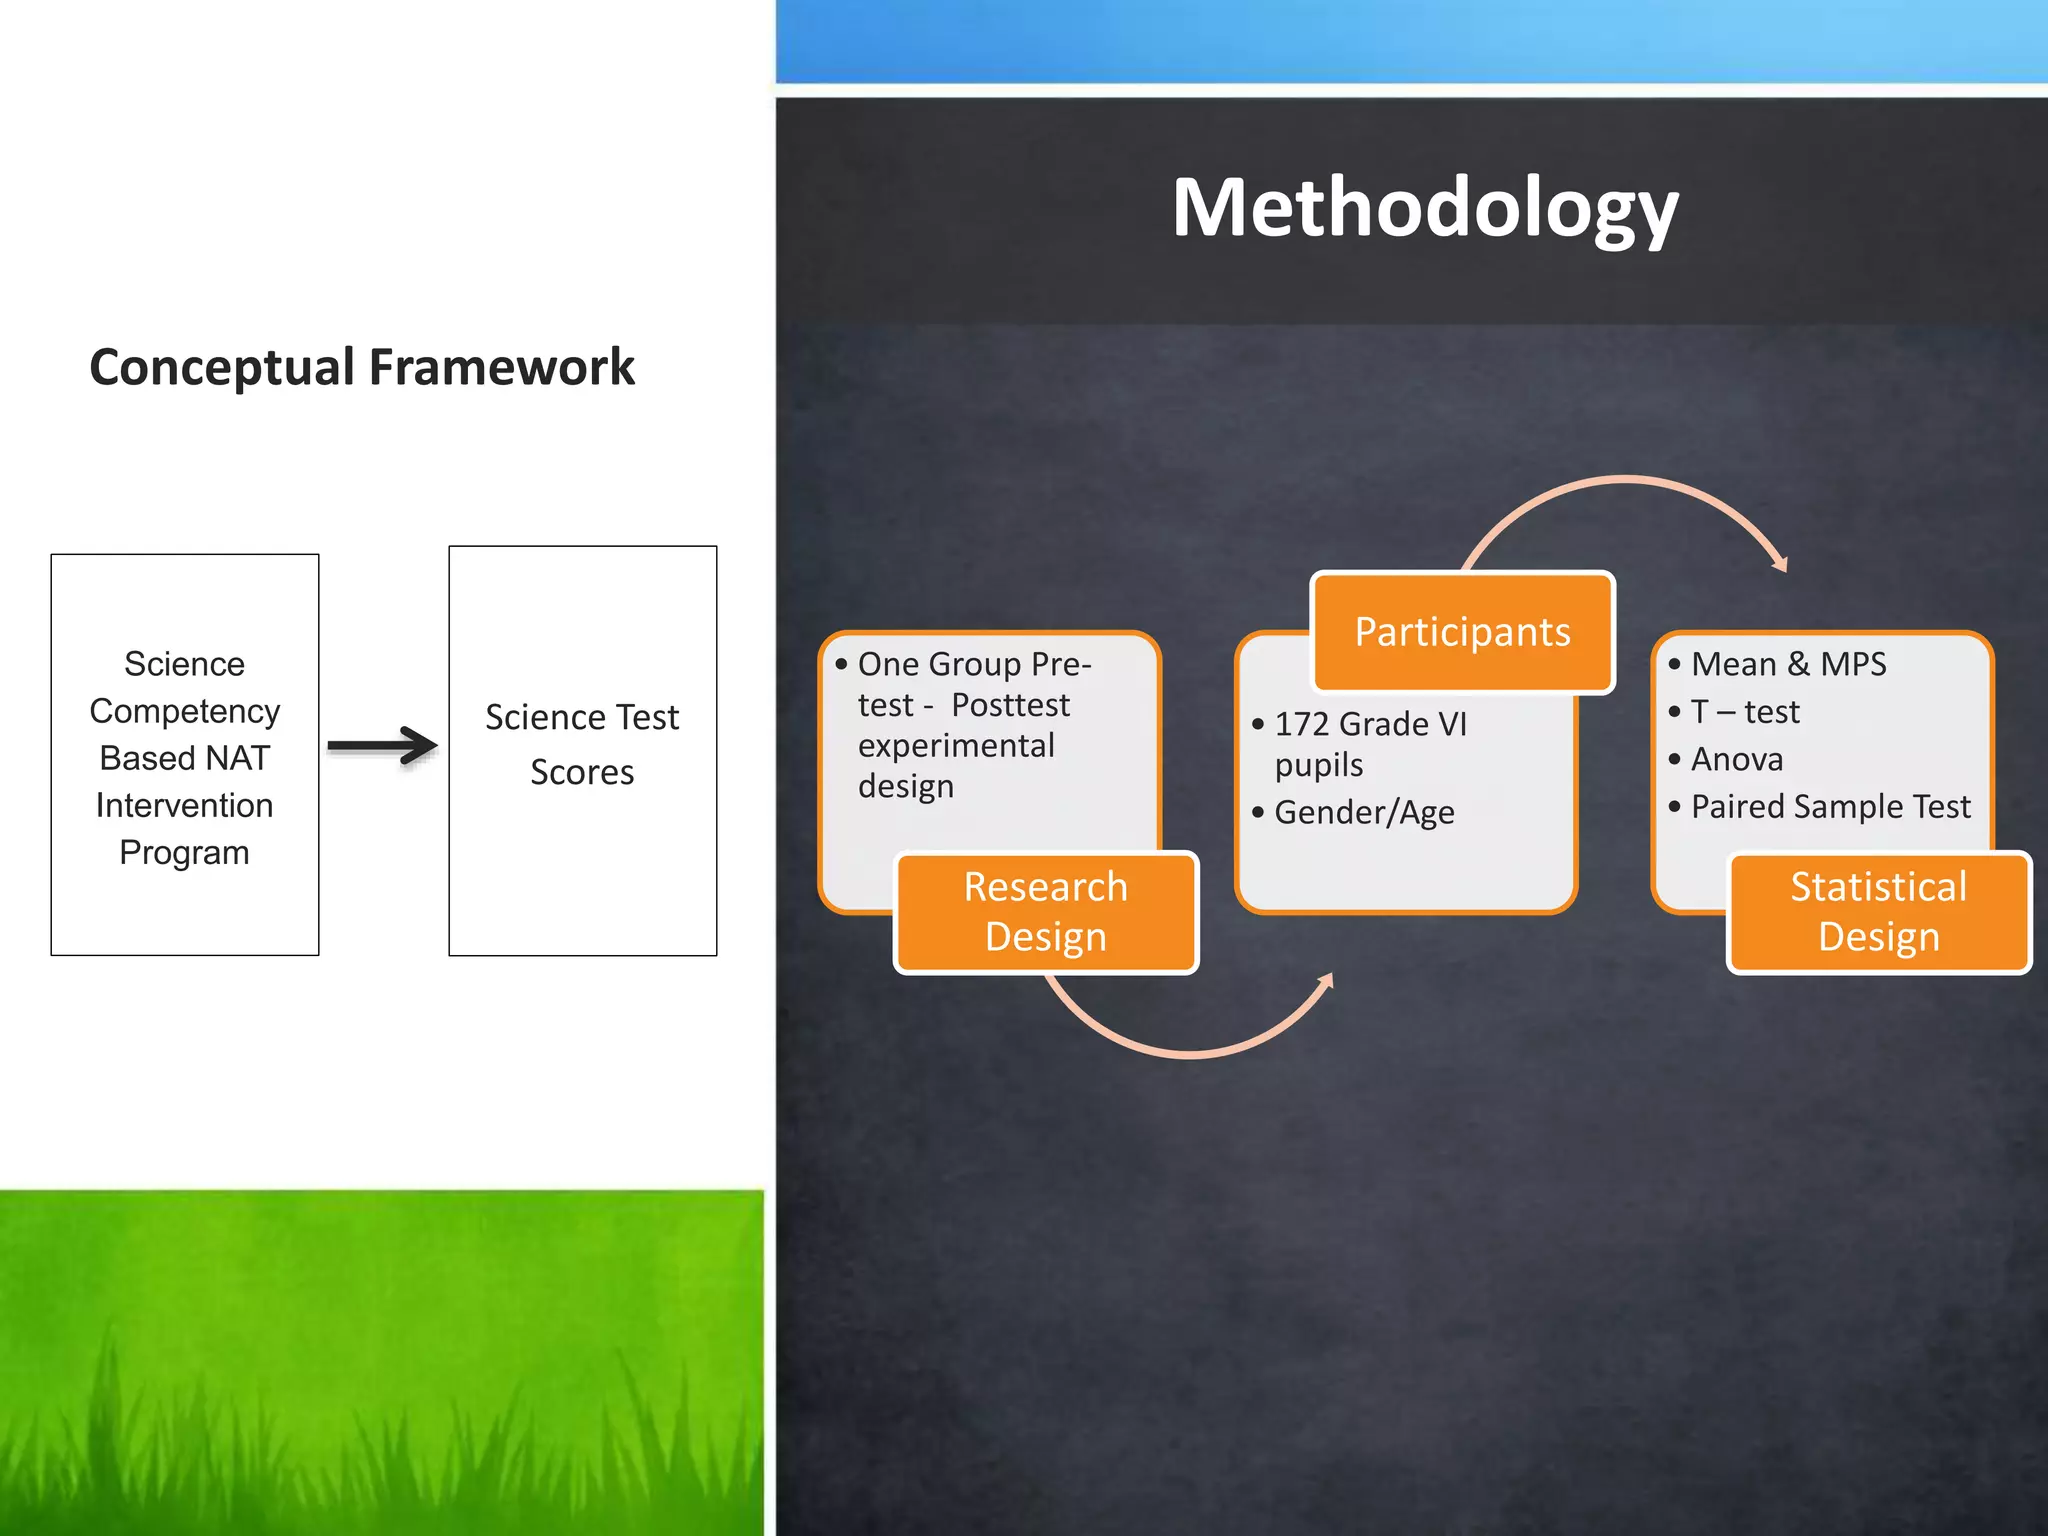
Introduction to Competency-Based NAT intervention framework aiming to enhance science MPS among Grade VI pupils.
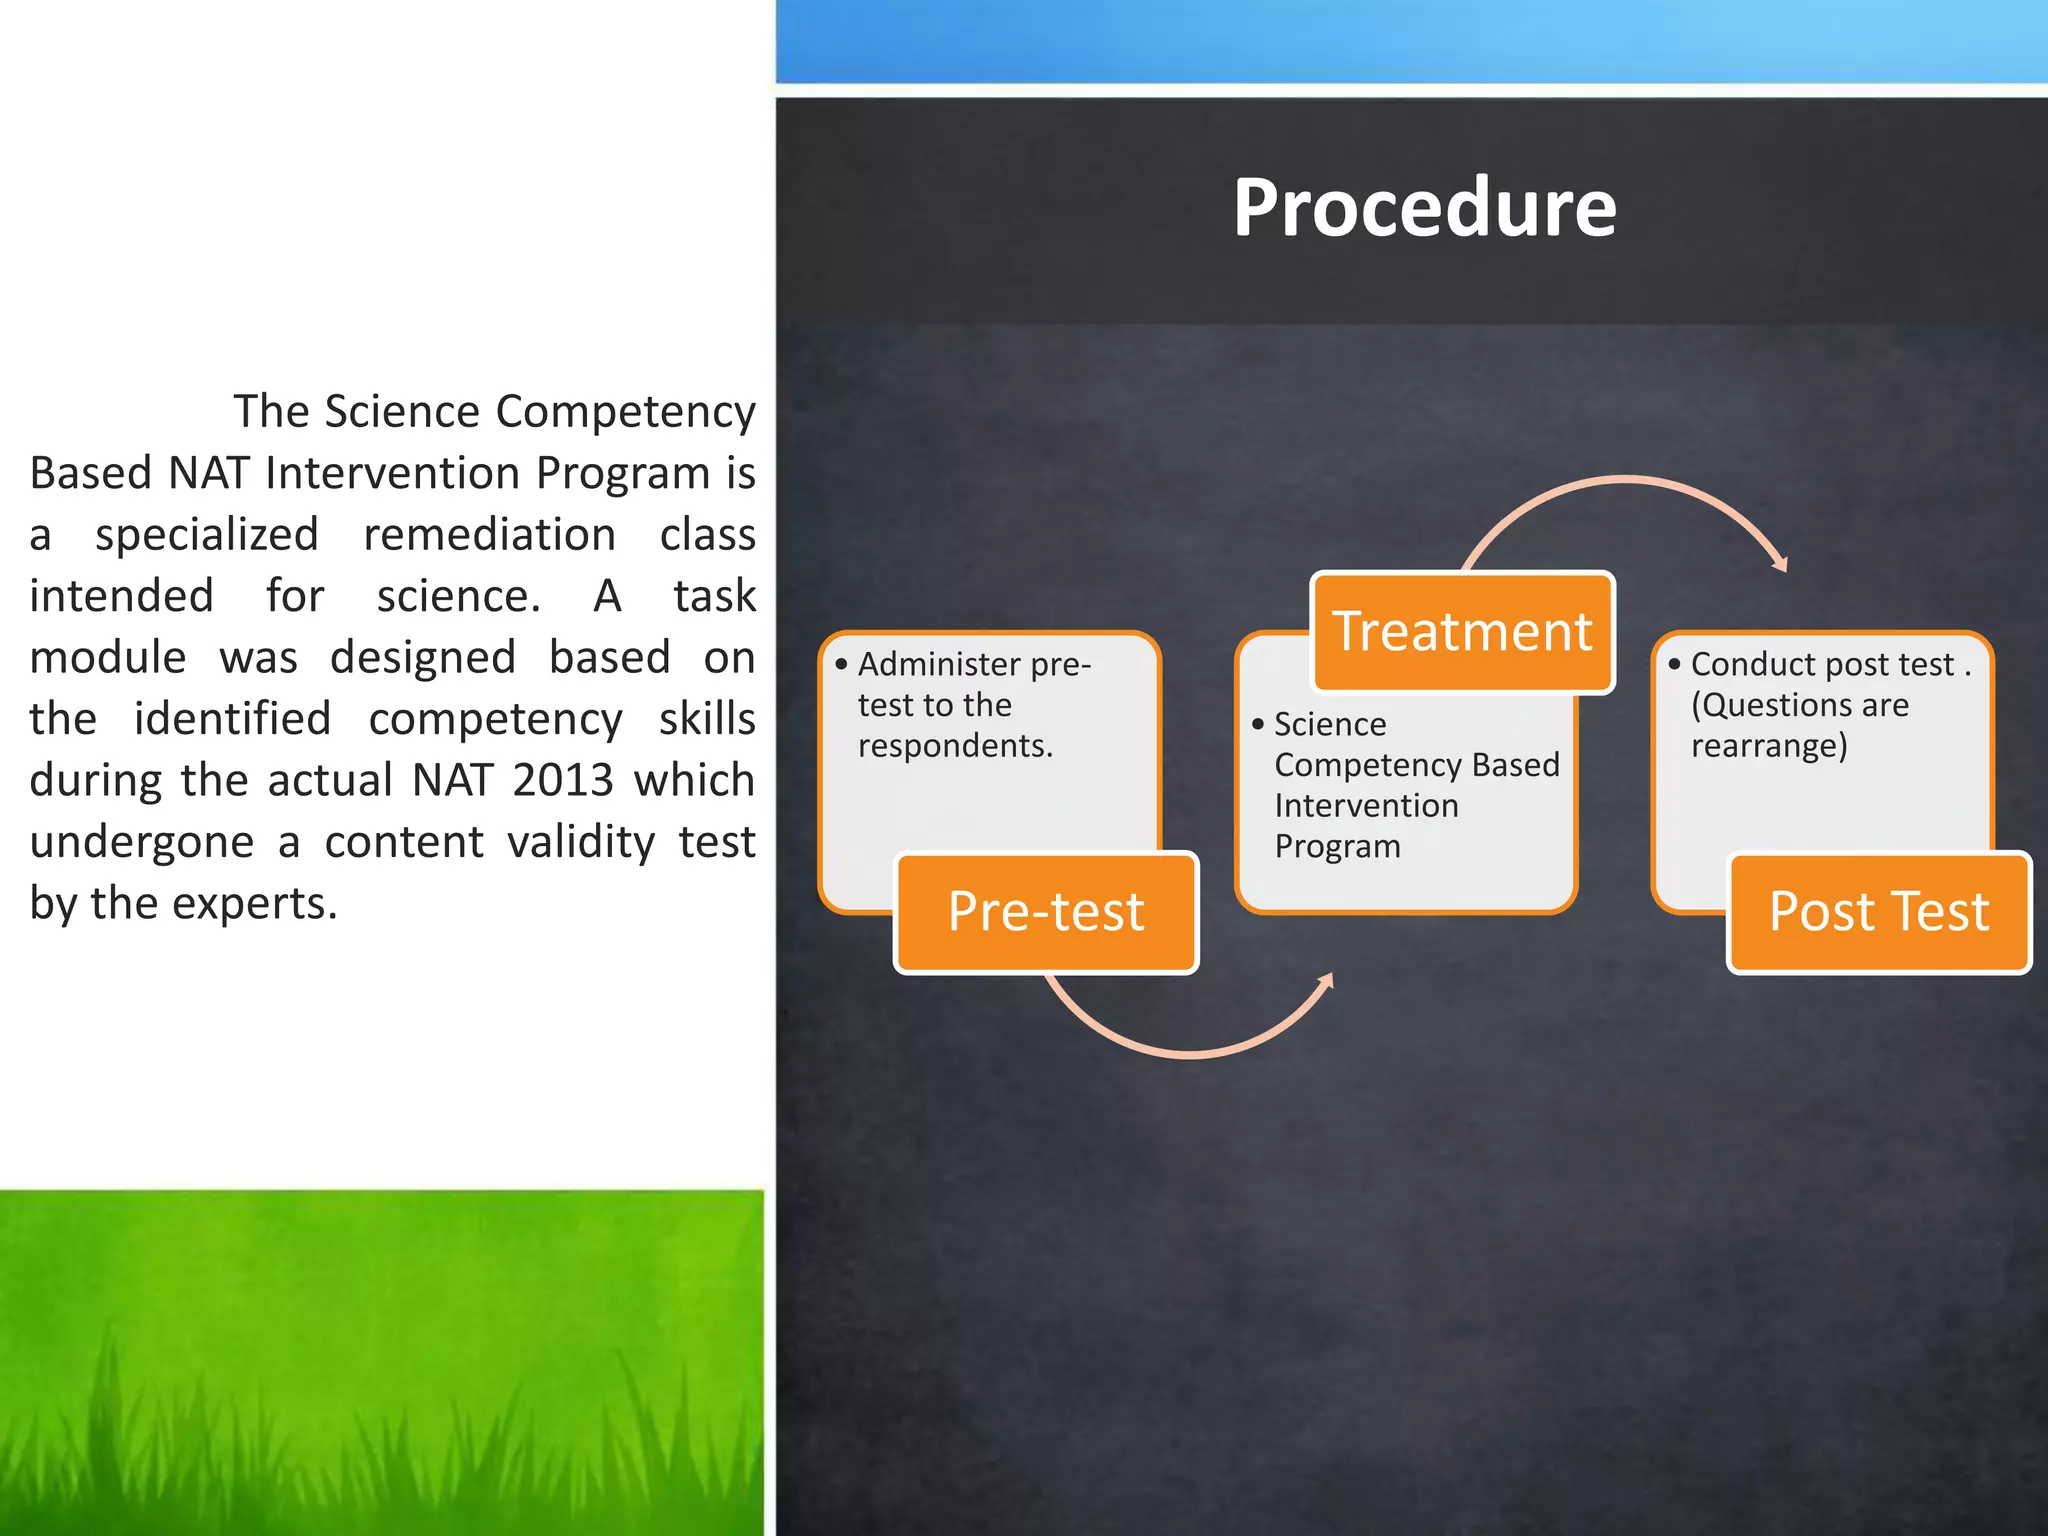
Details on administering pre-tests and implementing the Science Competency-Based Intervention Program with test results.
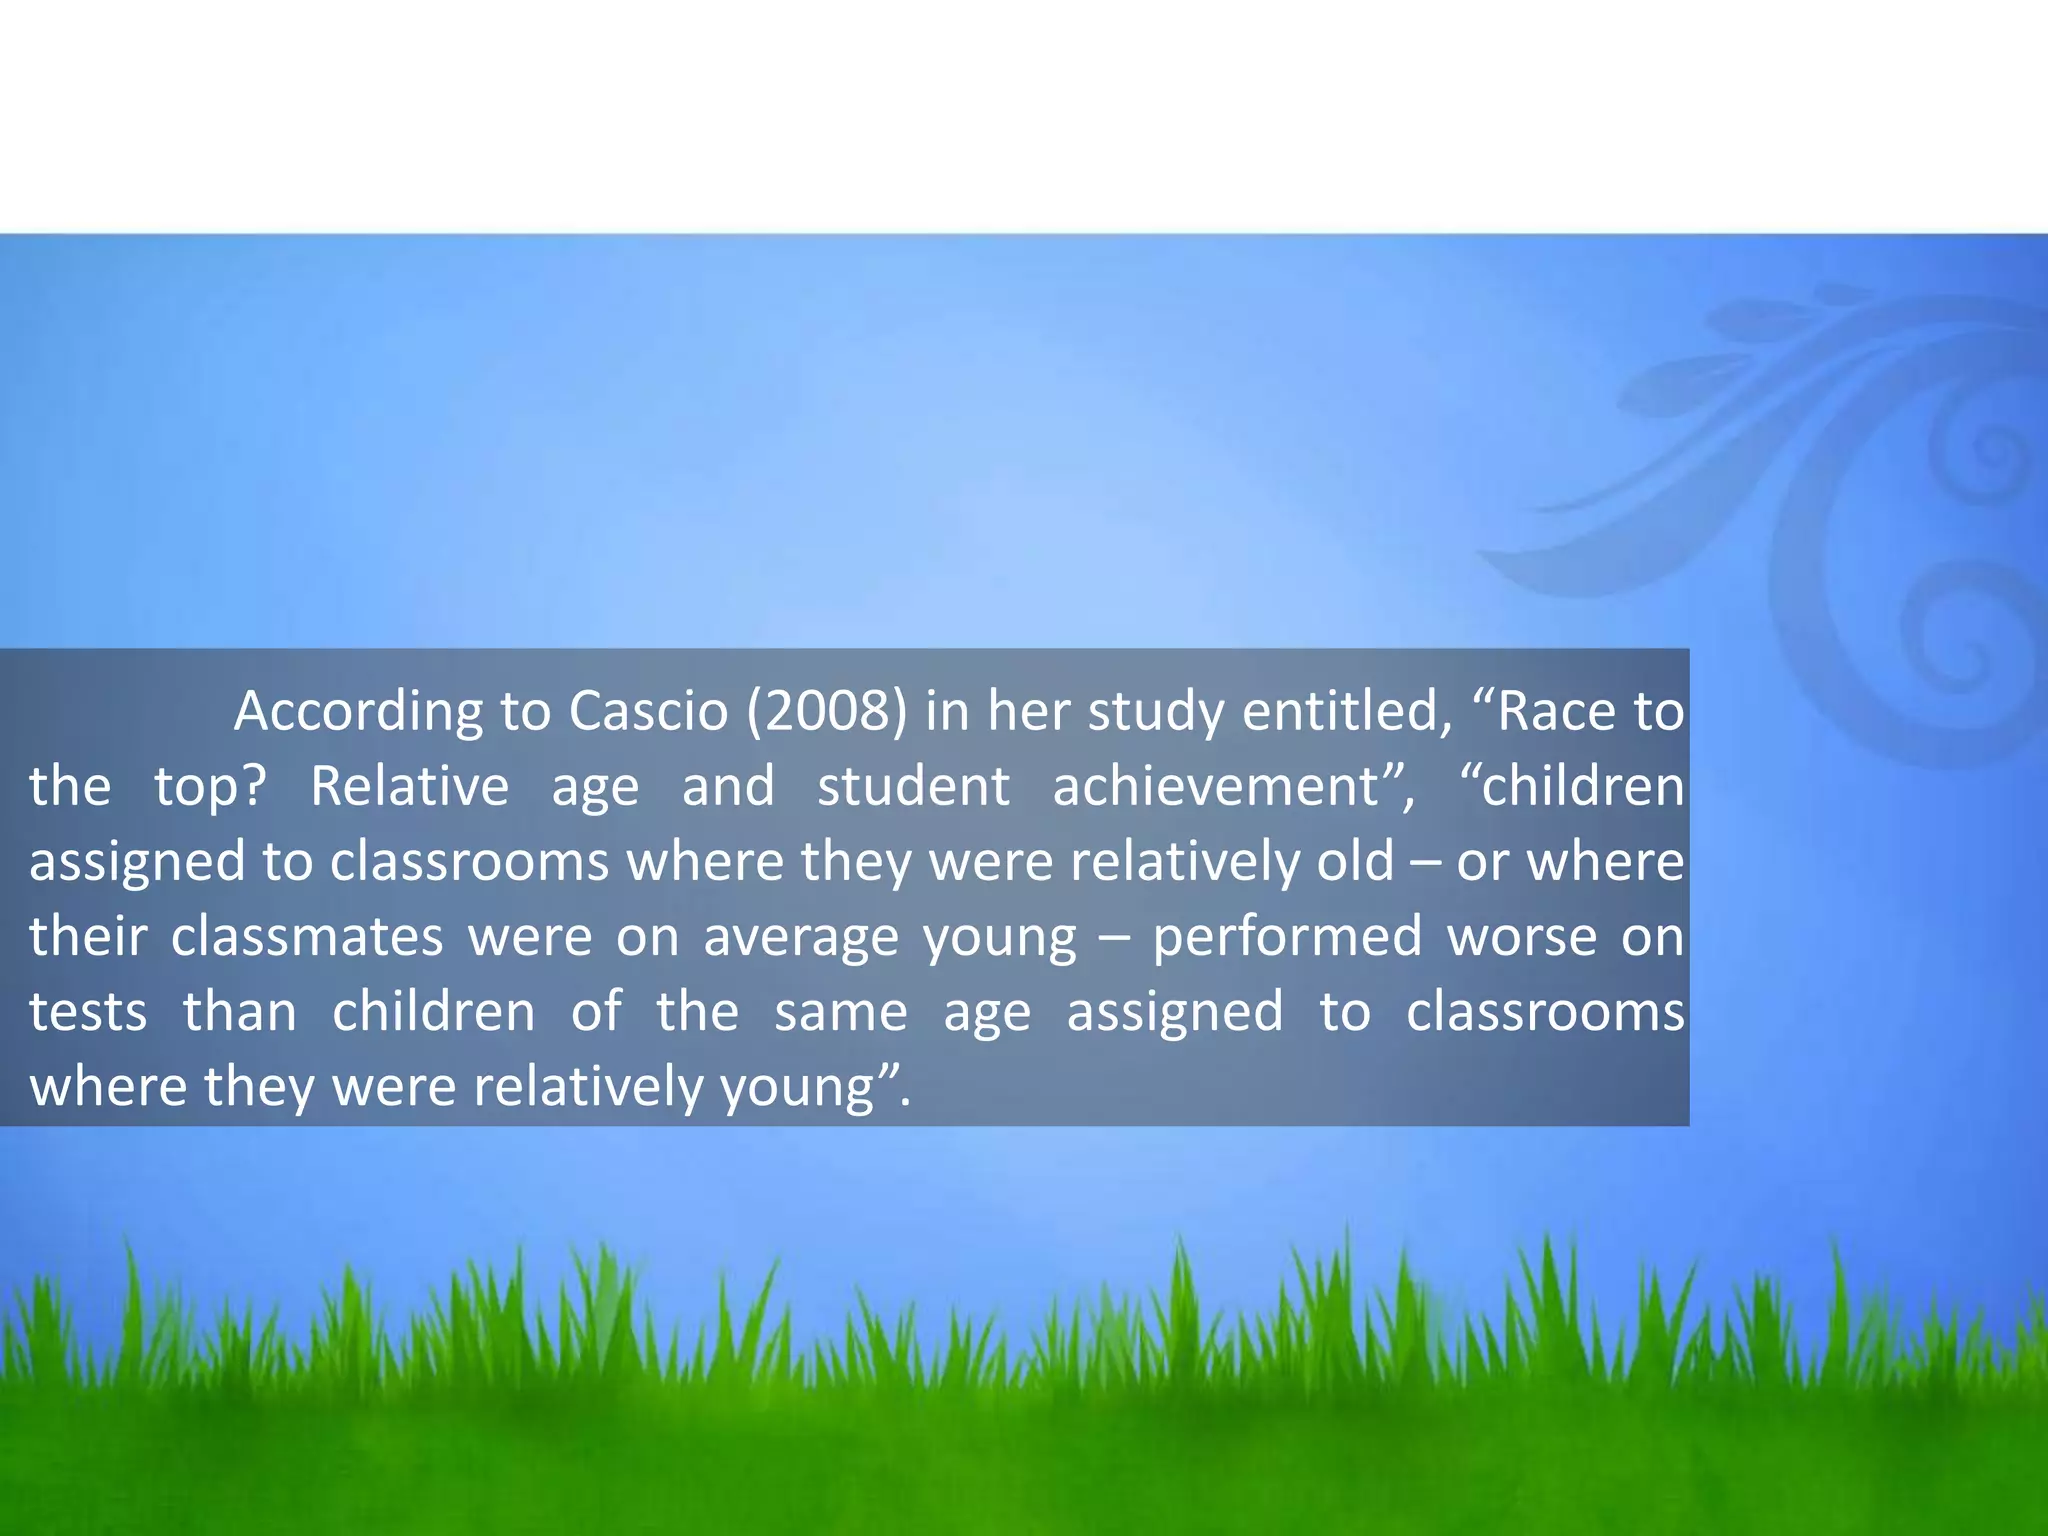
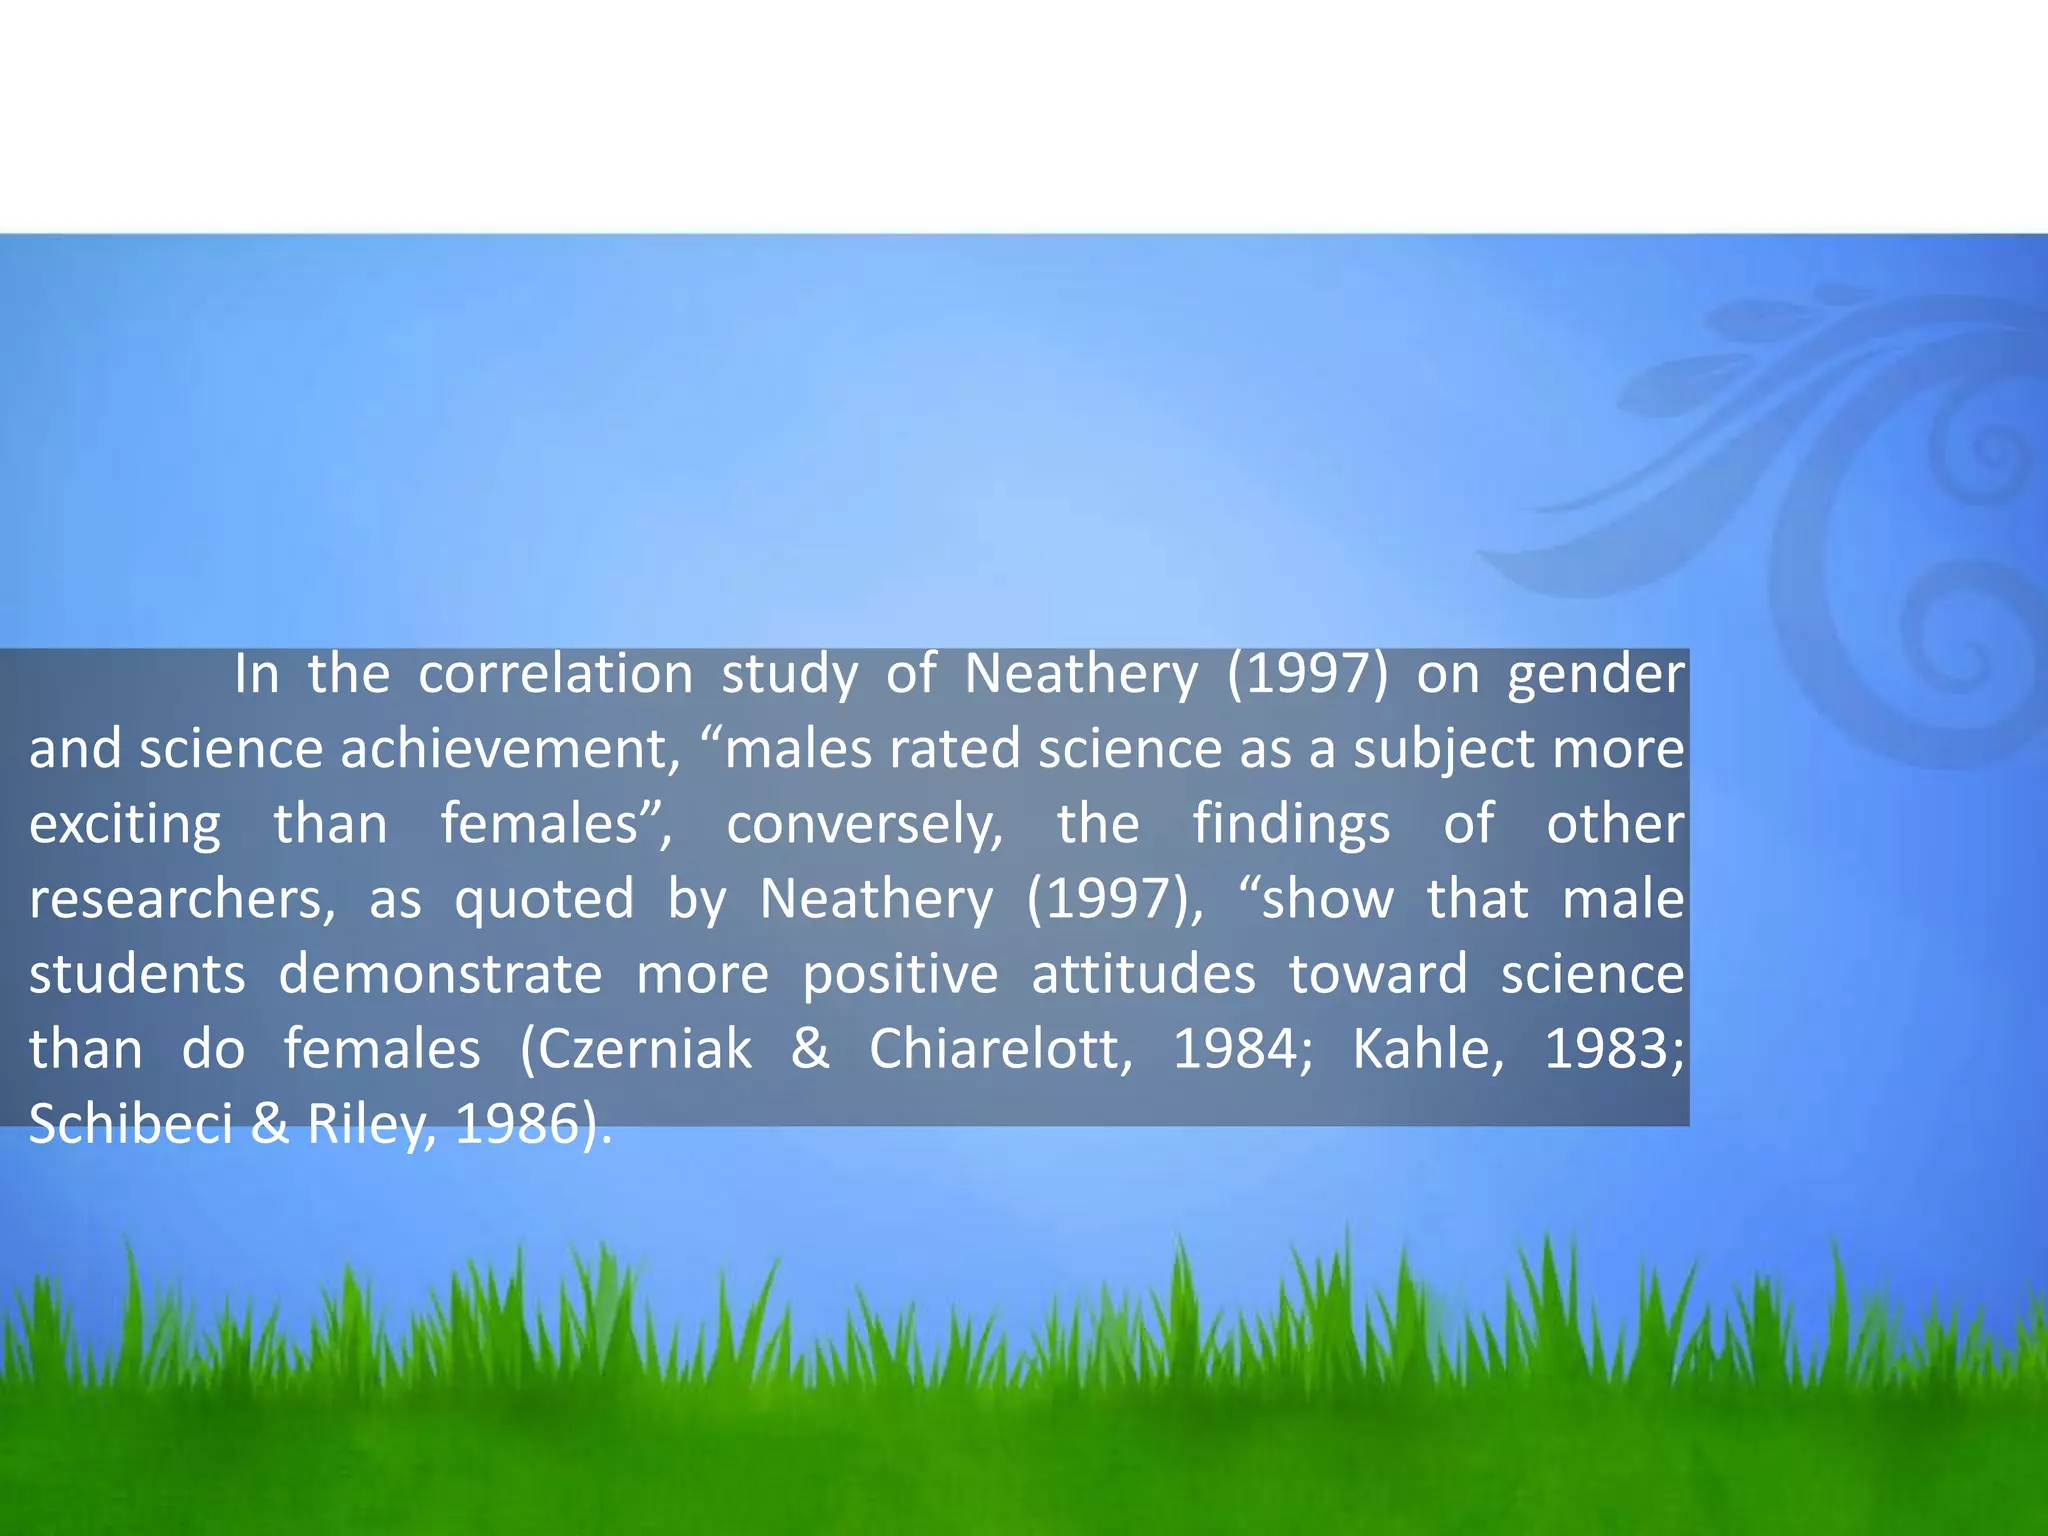
Studies examining the impact of gender and age on test performance, showing no significant disparities in outcomes.
Significant improvement in test scores post-intervention, confirming effectiveness with a mean percentage score surpassing benchmarks.
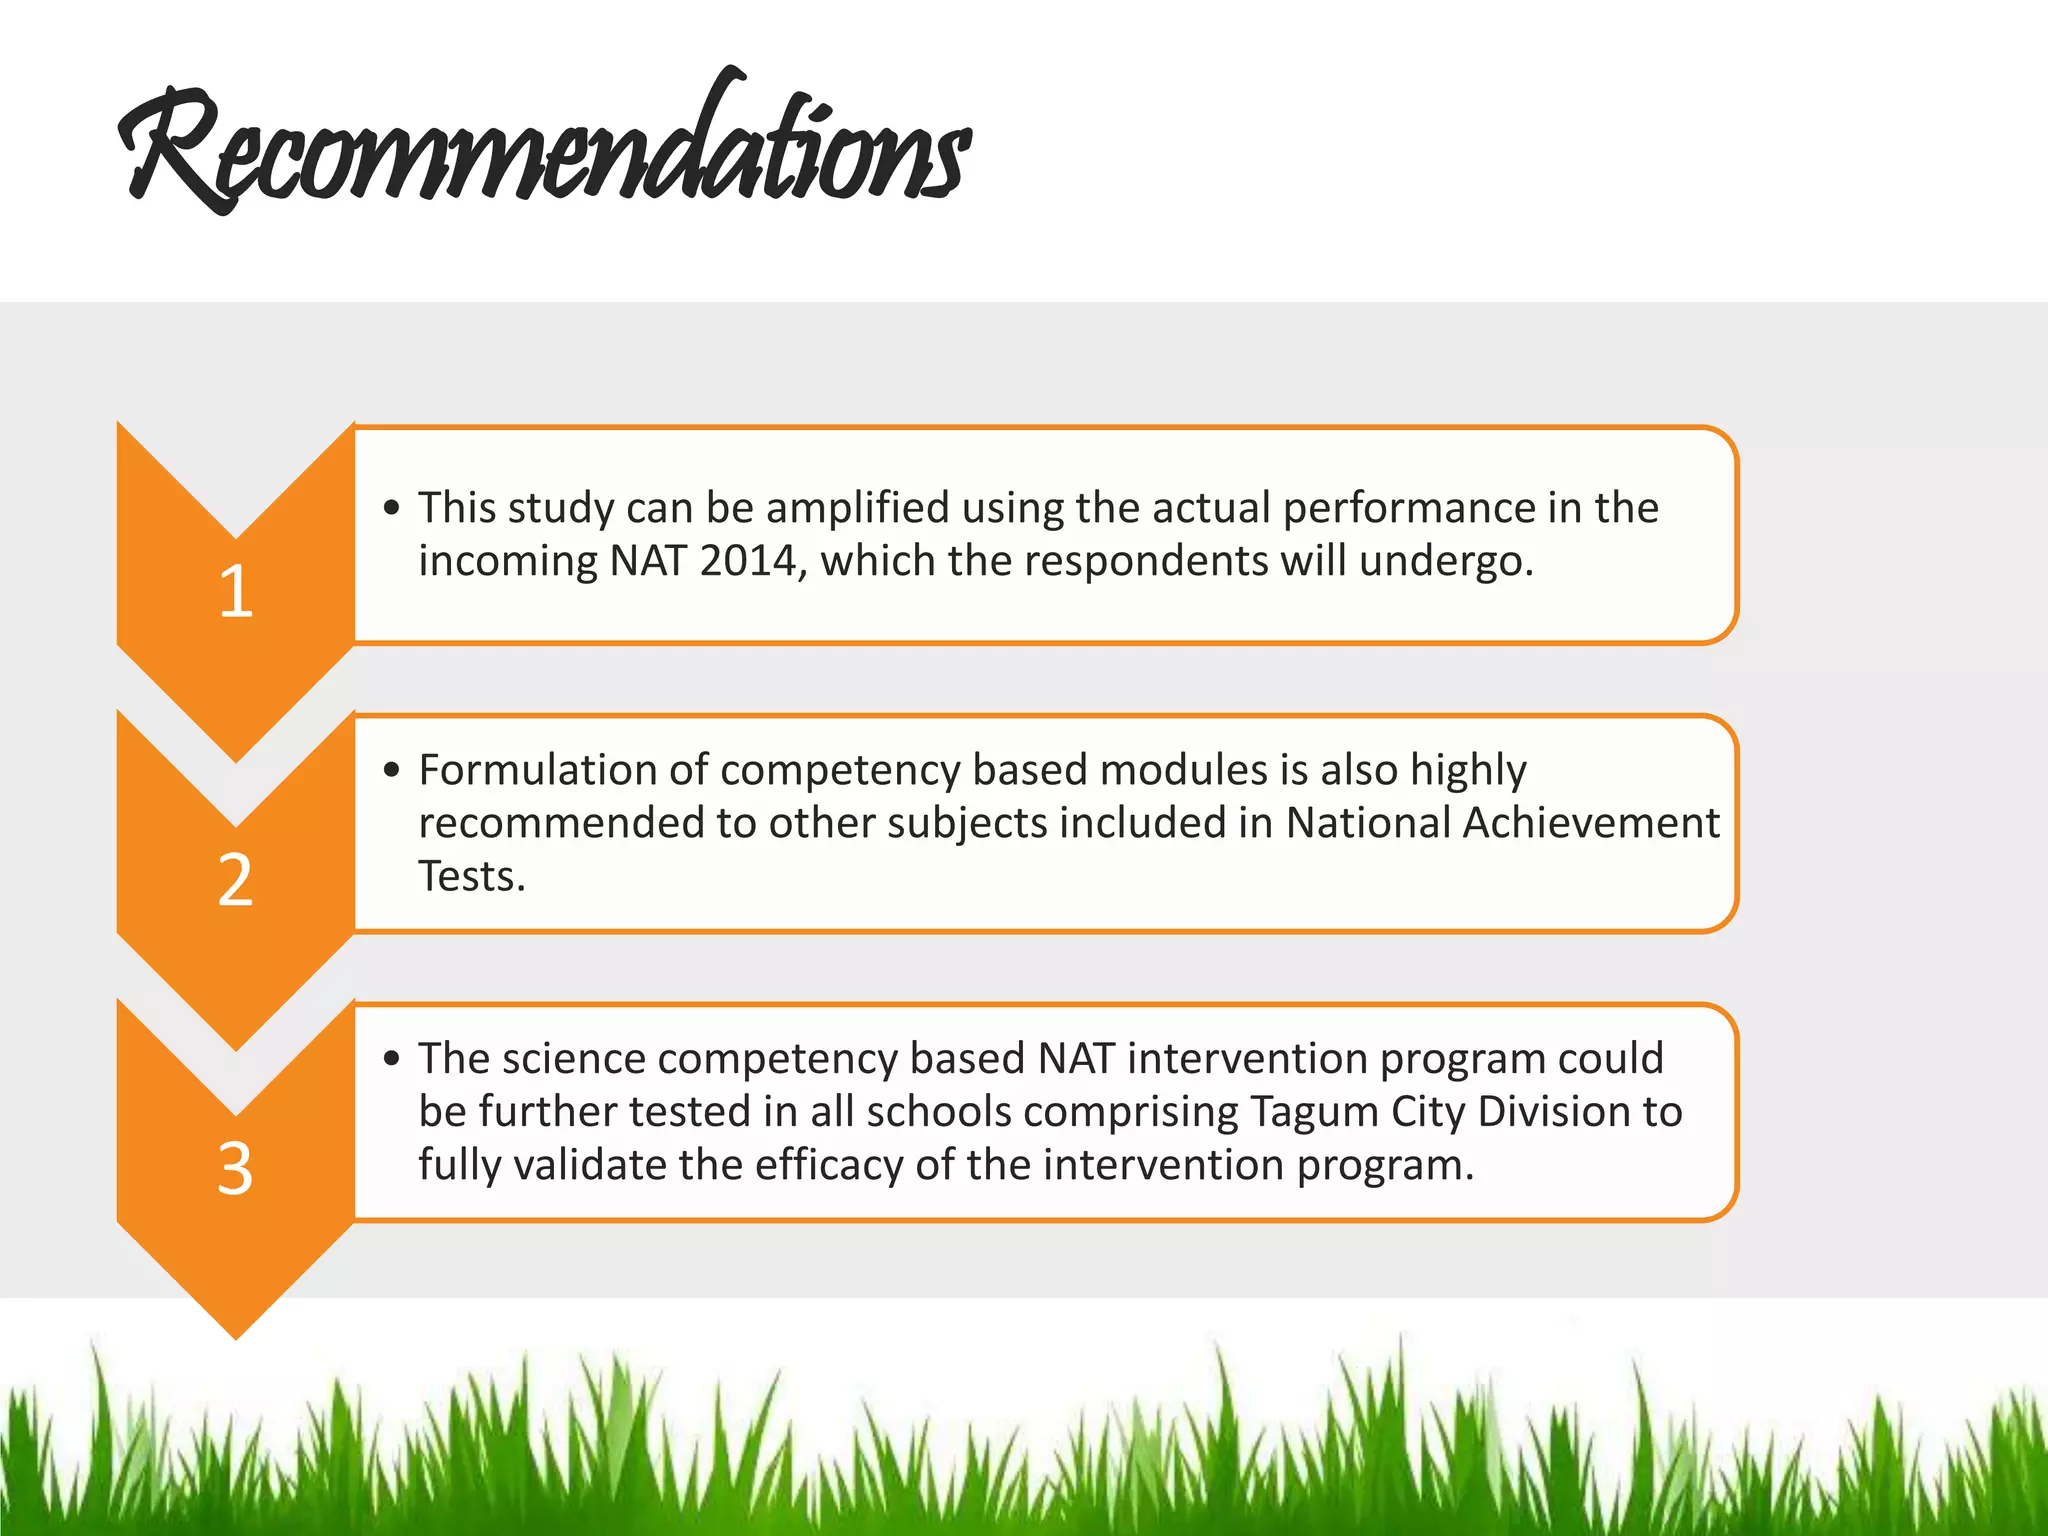
Suggestions to extend the intervention program and formulate additional competency-based modules for other subjects.


