Objectives:
At the endof the lesson, the learners will able to:
Present data in a tabular form, or in a single line
graph.
Interpret data presented in a tabular form, or in
a single line graph.
Solve problems using data for at most two
variables in a tabular form, or in a single line
graph.
IT’S MATH TIME
Papaparapa,papararapapa (2x)
Let’s add the love and the hate, let us
subtract
This is our Math, this is our time
Everybody ready, MATH TIME!
Add, subtract, multiply, divide, MATH
TIME! (3x)
Collecting Data
means gatheringinformation or facts to
analyze, study, or use for decision-
making. This can be done through various
methods, such as surveys, observations,
interviews, experiments, or existing
26.
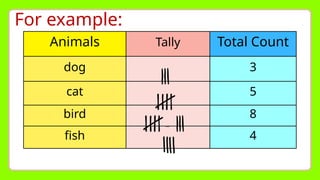
For example:
• Ineducation, teachers collect data on
students' test scores to identify learning
gaps.
• In research, scientists collect data from
experiments to draw conclusions.
• In business, companies collect customer
27.
Interpreting Data
-means analyzingand understanding the
information presented in a table or a single-
line graph to identify patterns, trends, or
insights. It involves making sense of numerical
or categorical data and using it to answer
questions, make decisions, or draw
28.
Tabular Form
Tabular formmeans organizing
data in a table format with rows
and columns. This makes
information easy to read,
compare, and analyze.
Example 1:
Make asimple tally chart for
Grade 4 Courage of San Gabriel
Elementary School, showing a
survey of favorite fruits in a
class:
Apple- 13, banana- 15 , mango-
31.
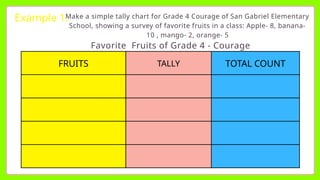
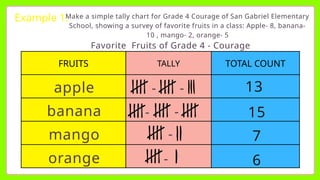
Example 1:
Make asimple tally chart for Grade 4 Courage of San Gabriel Elementary
School, showing a survey of favorite fruits in a class: Apple- 8, banana-
10 , mango- 2, orange- 5
FRUITS TALLY TOTAL COUNT
Favorite Fruits of Grade 4 - Courage
32.
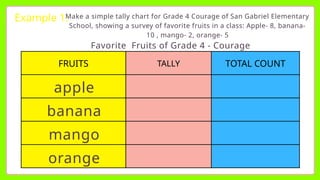
Example 1:
Make asimple tally chart for Grade 4 Courage of San Gabriel Elementary
School, showing a survey of favorite fruits in a class: Apple- 8, banana-
10 , mango- 2, orange- 5
FRUITS TALLY TOTAL COUNT
apple
banana
mango
orange
Favorite Fruits of Grade 4 - Courage
33.
Example 1:
Make asimple tally chart for Grade 4 Courage of San Gabriel Elementary
School, showing a survey of favorite fruits in a class: Apple- 8, banana-
10 , mango- 2, orange- 5
Favorite Fruits of Grade 4 - Courage
FRUITS TALLY TOTAL COUNT
apple
banana
mango
orange
-
-
-
-
-
-
34.
Example 1:
Make asimple tally chart for Grade 4 Courage of San Gabriel Elementary
School, showing a survey of favorite fruits in a class: Apple- 8, banana-
10 , mango- 2, orange- 5
Favorite Fruits of Grade 4 - Courage
FRUITS TALLY TOTAL COUNT
apple
banana
mango
orange
-
-
-
-
-
-
13
15
7
6
35.
Answer the following
questions:
1.What is the most favorite fruits?
2. What fruit is the least favorite?
3.How many Grade 4 pupils
banana
orange
41 pupils
36.
Line Graph
A linegraph is a type of graph
that shows information using
points connected by lines. It is
used to display changes over
time or trends in data
37.
Example 2. Constructa line graph for the
given data.
Ian’s scores in Five Math Quizzes
QUIZ NUMBER SCORE
1
2
3
4
5
5
15
10
5
15
38.
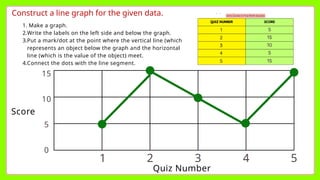
Construct a linegraph for the given data.
1. Make a graph.
2.Write the labels on the left side and below the graph.
3.Put a mark/dot at the point where the vertical line (which
represents an object below the graph and the horizontal
line (which is the value of the object) meet.
4.Connect the dots with the line segment.
39.
Construct a linegraph for the given data.
Quiz Number
Score
5
4
3
2
1
0
5
10
15
1. Make a graph.
2.Write the labels on the left side and below the graph.
3.Put a mark/dot at the point where the vertical line (which
represents an object below the graph and the horizontal
line (which is the value of the object) meet.
4.Connect the dots with the line segment.
40.
Construct a linegraph for the given data.
Quiz Number
Score
5
4
3
2
1
0
5
10
15
1. Make a graph.
2.Write the labels on the left side and below the graph.
3.Put a mark/dot at the point where the vertical line (which
represents an object below the graph and the horizontal
line (which is the value of the object) meet.
4.Connect the dots with the line segment.
41.
Construct a linegraph for the given data.
Quiz Number
Score
5
4
3
2
1
0
5
10
15
1. Make a graph.
2.Write the labels on the left side and below the graph.
3.Put a mark/dot at the point where the vertical line (which
represents an object below the graph and the horizontal
line (which is the value of the object) meet.
4.Connect the dots with the line segment.
42.
Construct a linegraph for the given data.
Quiz Number
Score
5
4
3
2
1
0
5
10
15
1. Make a graph.
2.Write the labels on the left side and below the graph.
3.Put a mark/dot at the point where the vertical line (which
represents an object below the graph and the horizontal
line (which is the value of the object) meet.
4.Connect the dots with the line segment.
43.
Construct a linegraph for the given data.
Quiz Number
Score
5
4
3
2
1
0
5
10
15
1. Make a graph.
2.Write the labels on the left side and below the graph.
3.Put a mark/dot at the point where the vertical line (which
represents an object below the graph and the horizontal
line (which is the value of the object) meet.
4.Connect the dots with the line segment.
44.
Construct a linegraph for the given data.
Quiz Number
Score
5
4
3
2
1
0
5
10
15
1. Make a graph.
2.Write the labels on the left side and below the graph.
3.Put a mark/dot at the point where the vertical line (which
represents an object below the graph and the horizontal
line (which is the value of the object) meet.
4.Connect the dots with the line segment.
45.
Construct a linegraph for the given data.
Quiz Number
Score
5
4
3
2
1
0
5
10
15
1. Make a graph.
2.Write the labels on the left side and below the graph.
3.Put a mark/dot at the point where the vertical line (which
represents an object below the graph and the horizontal
line (which is the value of the object) meet.
4.Connect the dots with the line segment.
46.
Answer the following
questions:
1.What quiz number has the
highest score?
2. What quiz number has the least
score?
3.What is the total score of Ian in
Quiz 2 and 5
Quiz 1 and 5
50
47.
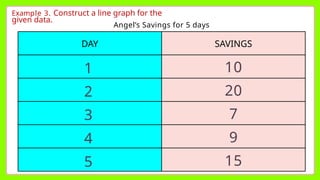
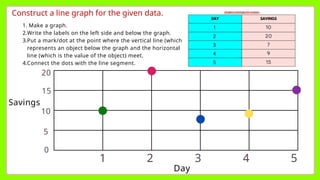
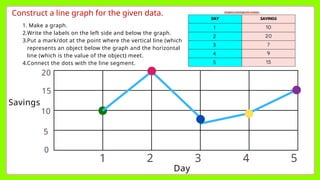
Example 3. Constructa line graph for the
given data.
Angel’s Savings for 5 days
DAY SAVINGS
1
2
3
4
5
10
20
7
9
15
48.
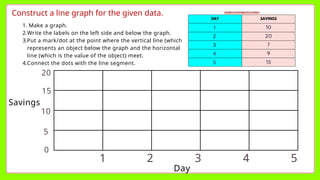
Construct a linegraph for the given data.
1. Make a graph.
2.Write the labels on the left side and below the graph.
3.Put a mark/dot at the point where the vertical line (which
represents an object below the graph and the horizontal
line (which is the value of the object) meet.
4.Connect the dots with the line segment.
49.
Construct a linegraph for the given data.
1. Make a graph.
2.Write the labels on the left side and below the graph.
3.Put a mark/dot at the point where the vertical line (which
represents an object below the graph and the horizontal
line (which is the value of the object) meet.
4.Connect the dots with the line segment.
Day
Savings
5
4
3
2
1
5
10
15
20
0
50.
Construct a linegraph for the given data.
1. Make a graph.
2.Write the labels on the left side and below the graph.
3.Put a mark/dot at the point where the vertical line (which
represents an object below the graph and the horizontal
line (which is the value of the object) meet.
4.Connect the dots with the line segment.
Day
Savings
5
4
3
2
1
5
10
15
20
0
51.
Construct a linegraph for the given data.
1. Make a graph.
2.Write the labels on the left side and below the graph.
3.Put a mark/dot at the point where the vertical line (which
represents an object below the graph and the horizontal
line (which is the value of the object) meet.
4.Connect the dots with the line segment.
Day
Savings
5
4
3
2
1
5
10
15
20
0
52.
Answer the following
questions:
1.How much did Angel’s save on
Day 3?
2. On which day was the highest
amount that Angel saves?
3.What is the total amount Angel
7 pesos
Day 2
61 pesos
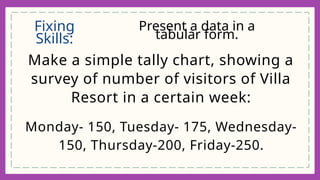
Fixing
Skills:
Present a datain a
tabular form.
Make a simple tally chart, showing a
survey of number of visitors of Villa
Resort in a certain week:
Monday- 150, Tuesday- 175, Wednesday-
150, Thursday-200, Friday-250.
55.
DAY NUMBER OFVISITORS
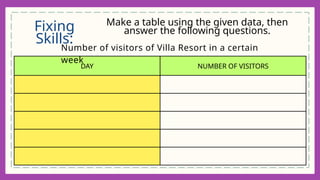
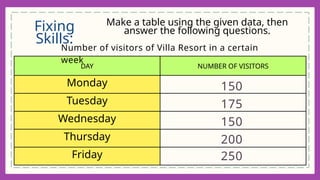
Fixing
Skills:
Make a table using the given data, then
answer the following questions.
Number of visitors of Villa Resort in a certain
week
56.
DAY NUMBER OFVISITORS
Monday
Tuesday
Wednesday
Thursday
Friday
Fixing
Skills:
Make a table using the given data, then
answer the following questions.
Number of visitors of Villa Resort in a certain
week
150
175
150
200
250
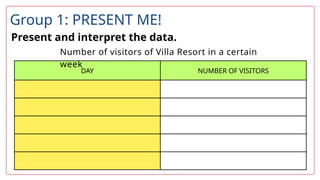
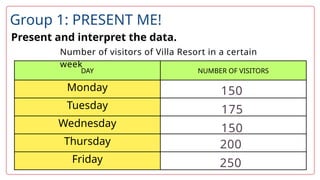
Present and interpretthe data.
DAY NUMBER OF VISITORS
Number of visitors of Villa Resort in a certain
week
Group 1: PRESENT ME!
60.
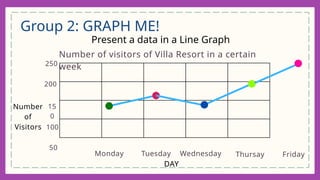
Group 2: GRAPHME!
Present a data in a Line Graph
Number of visitors of Villa Resort in a certain
week
DAY
Number
of
Visitors
Monday
100
15
0
200
250
50
Tuesday Wednesday Friday
Thursay
61.
Solve and answerthe following questions:
1. How many visitors visit on Tuesday?
2. What day has the highest visitors in the Villa
Resort?
3. What day has the least visitors?
4. How many more visitors on Friday than on
Monday?
5. What is the total number of visitors in the
Villa Resort in the given week?
Group 3: SOLVE ME!
Present and interpretthe data.
DAY NUMBER OF VISITORS
Monday
Tuesday
Wednesday
Thursday
Friday
Number of visitors of Villa Resort in a certain
week
150
175
150
200
250
Group 1: PRESENT ME!
65.
Group 2: GRAPHME!
Present a data in a Line Graph
Number of visitors of Villa Resort in a certain
week
DAY
Number
of
Visitors
Monday
100
15
0
200
250
50
Tuesday Wednesday Friday
Thursay
66.
Solve and answerthe following questions:
1. How many visitors visit on Tuesday?
2. What day has the highest visitors in the Villa
Resort?
3. What day has the least visitors?
4. How many more visitors on Friday than on
Monday?
5. What is the total number of visitors in the
Villa Resort in the given week?
Group 3: SOLVE ME!
175 visitors
Friday
Monday &
Wedenesday
100 visitors
925 visitors
67.
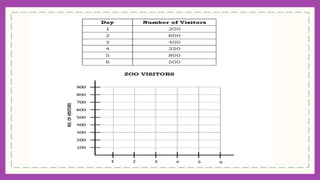
Analyze the givensituation. Draw a line
graph that represents the data on the
table and answer the questions that
follows.
A mini zoo recorded the number of
their visitors for six days. The table
below shows their record.
Evaluation:
69.
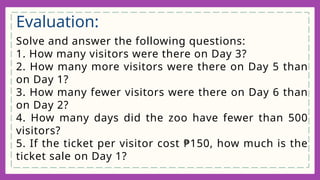
Solve and answerthe following questions:
1. How many visitors were there on Day 3?
2. How many more visitors were there on Day 5 than
on Day 1?
3. How many fewer visitors were there on Day 6 than
on Day 2?
4. How many days did the zoo have fewer than 500
visitors?
5. If the ticket per visitor cost ₱150, how much is the
ticket sale on Day 1?
Evaluation:
70.
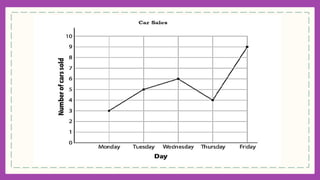
Analyze the situationpresented on a
line graph and answer the questions
that follows.
George works as a salesman in an
authorized car showroom. He records
the number of cars he sold in five days
(Monday to Friday) on a line graph.
Assignment:
72.
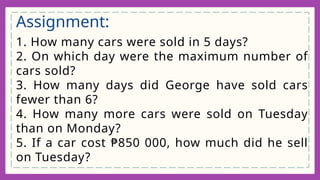
1. How manycars were sold in 5 days?
2. On which day were the maximum number of
cars sold?
3. How many days did George have sold cars
fewer than 6?
4. How many more cars were sold on Tuesday
than on Monday?
5. If a car cost ₱850 000, how much did he sell
on Tuesday?
Assignment: