


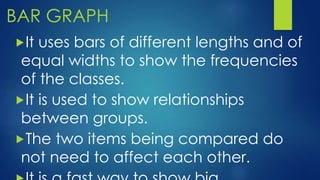

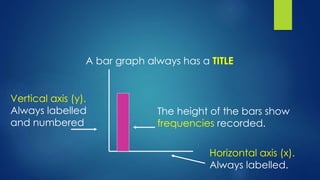
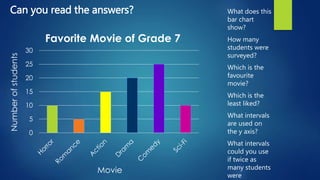


This document provides information about bar graphs: - Bar graphs use bars of equal width to show frequencies of different classes or groups. They can show relationships between two or more items. - The key parts of a bar graph are the title, horizontal and vertical axes labeled with intervals, and bars whose heights represent recorded frequencies. - An example bar graph shows the favorite movie of 30 grade 7 students, with the most popular being at 25 students and the least being at 5 students.