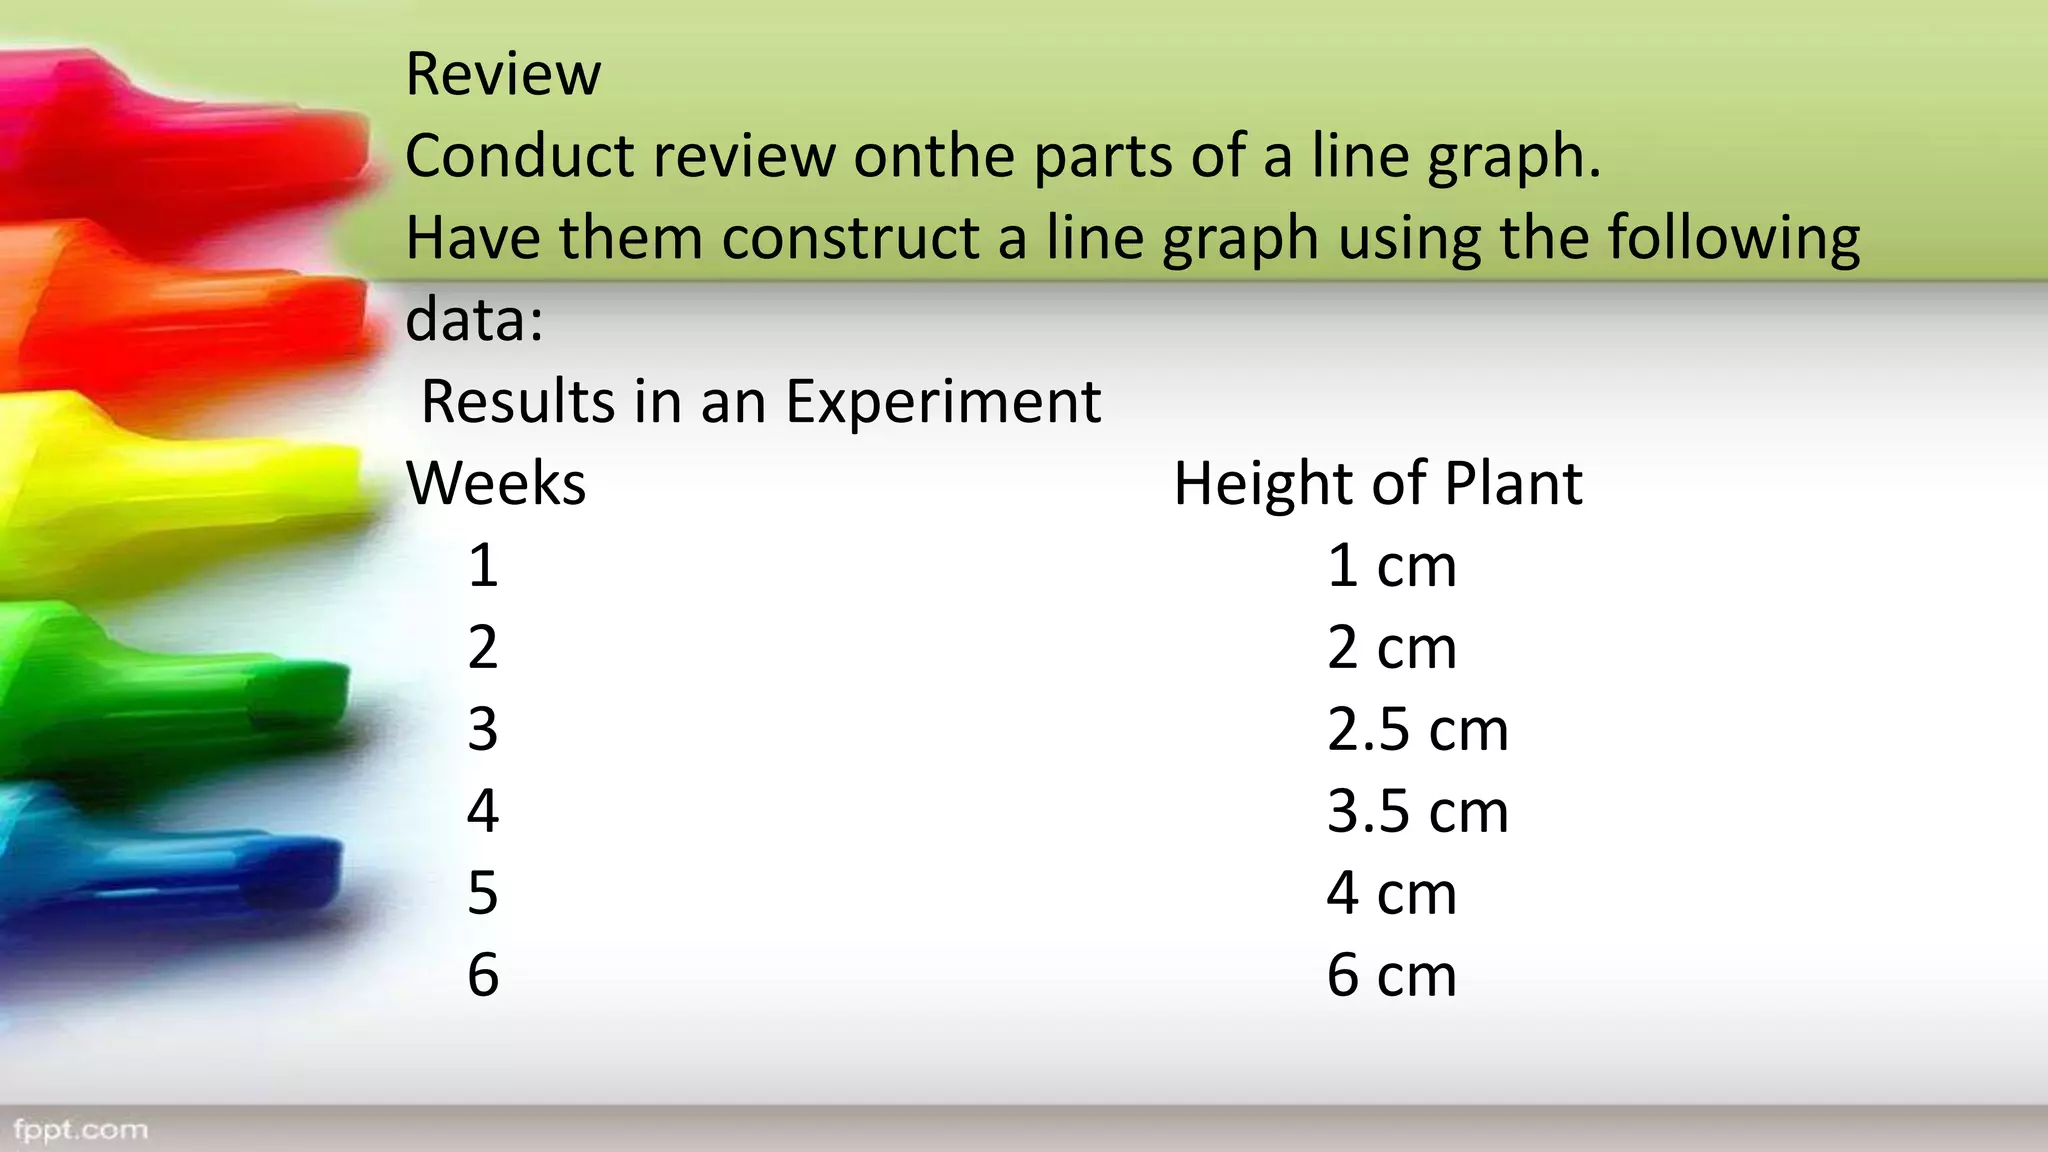
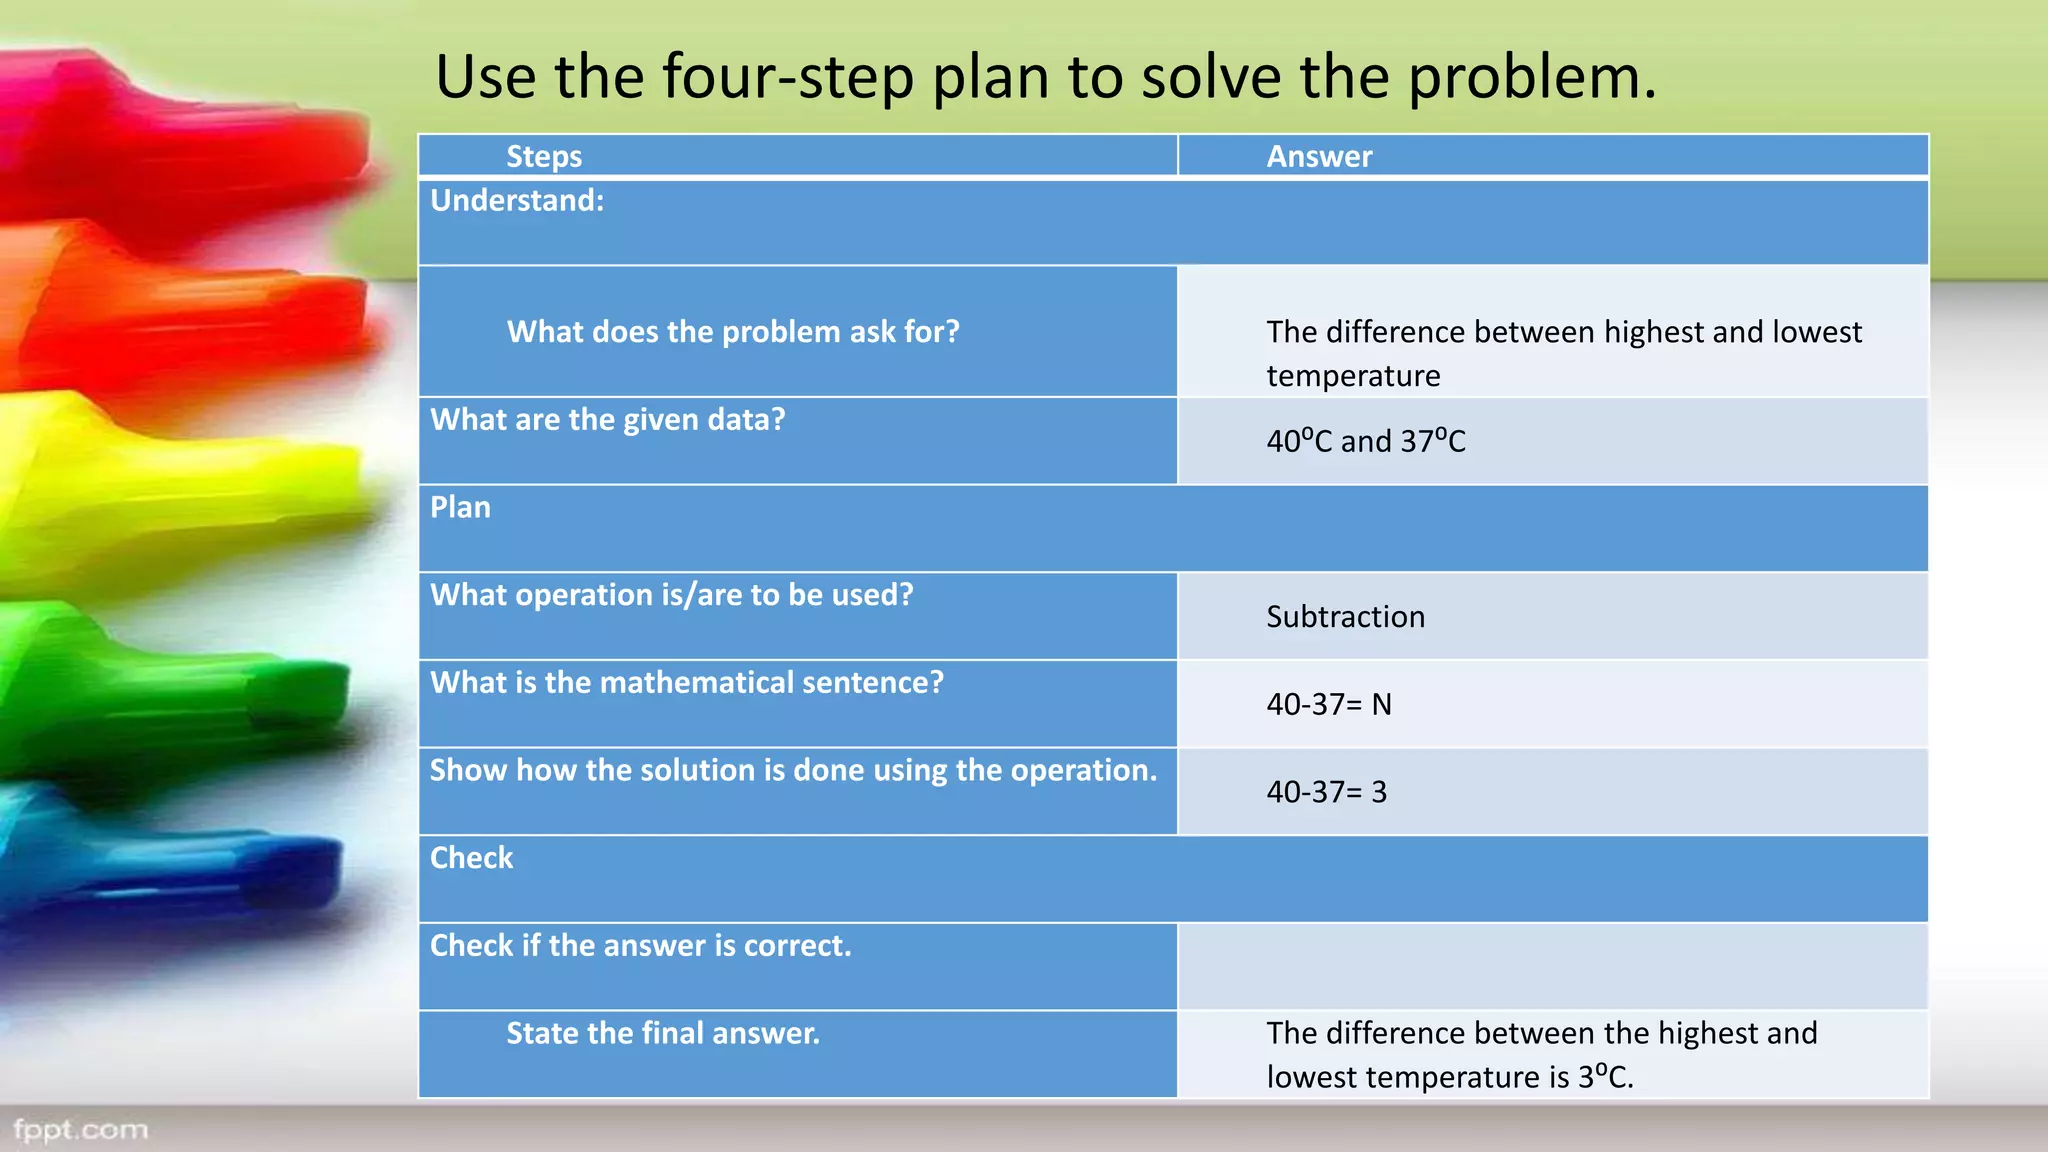
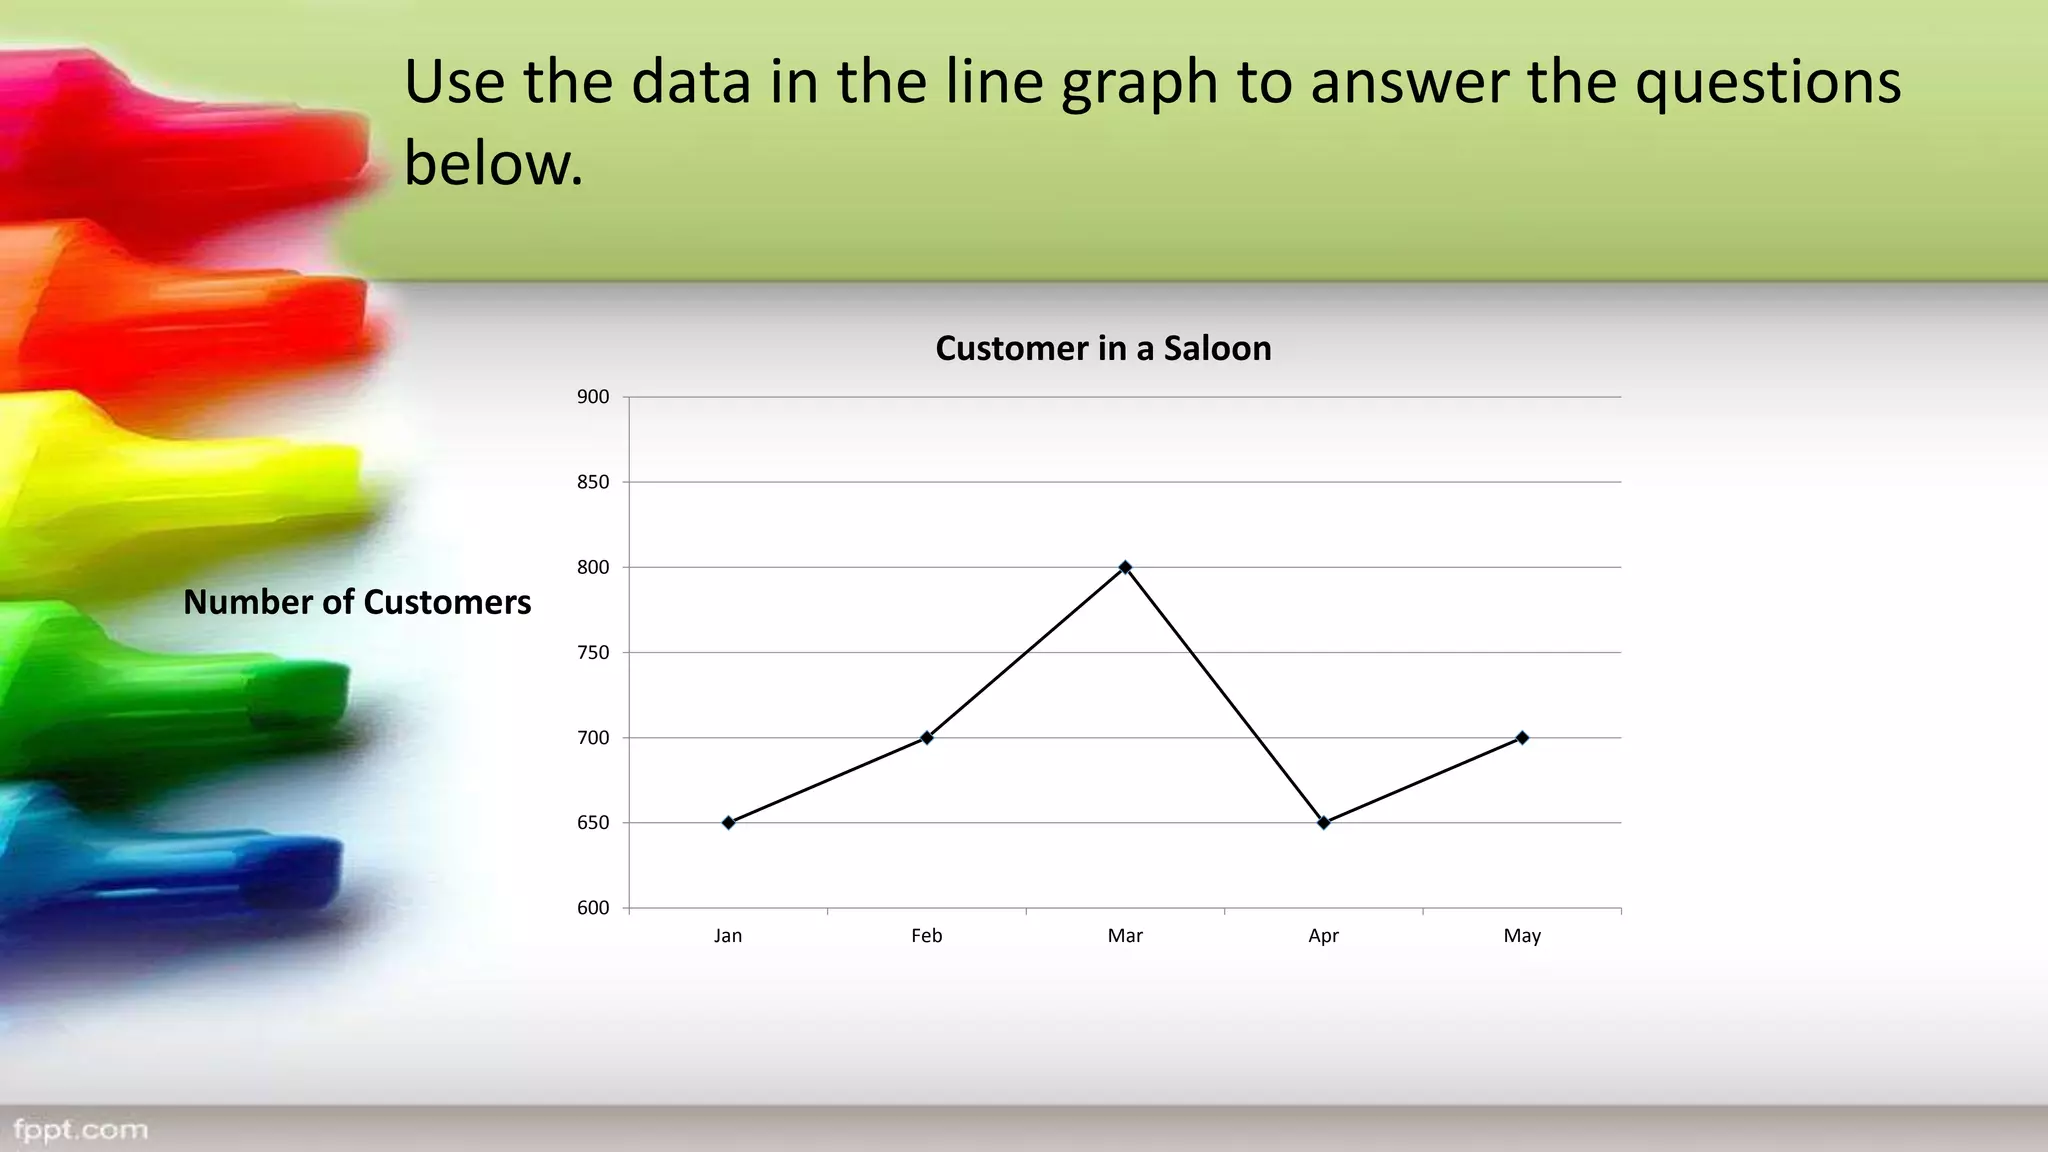
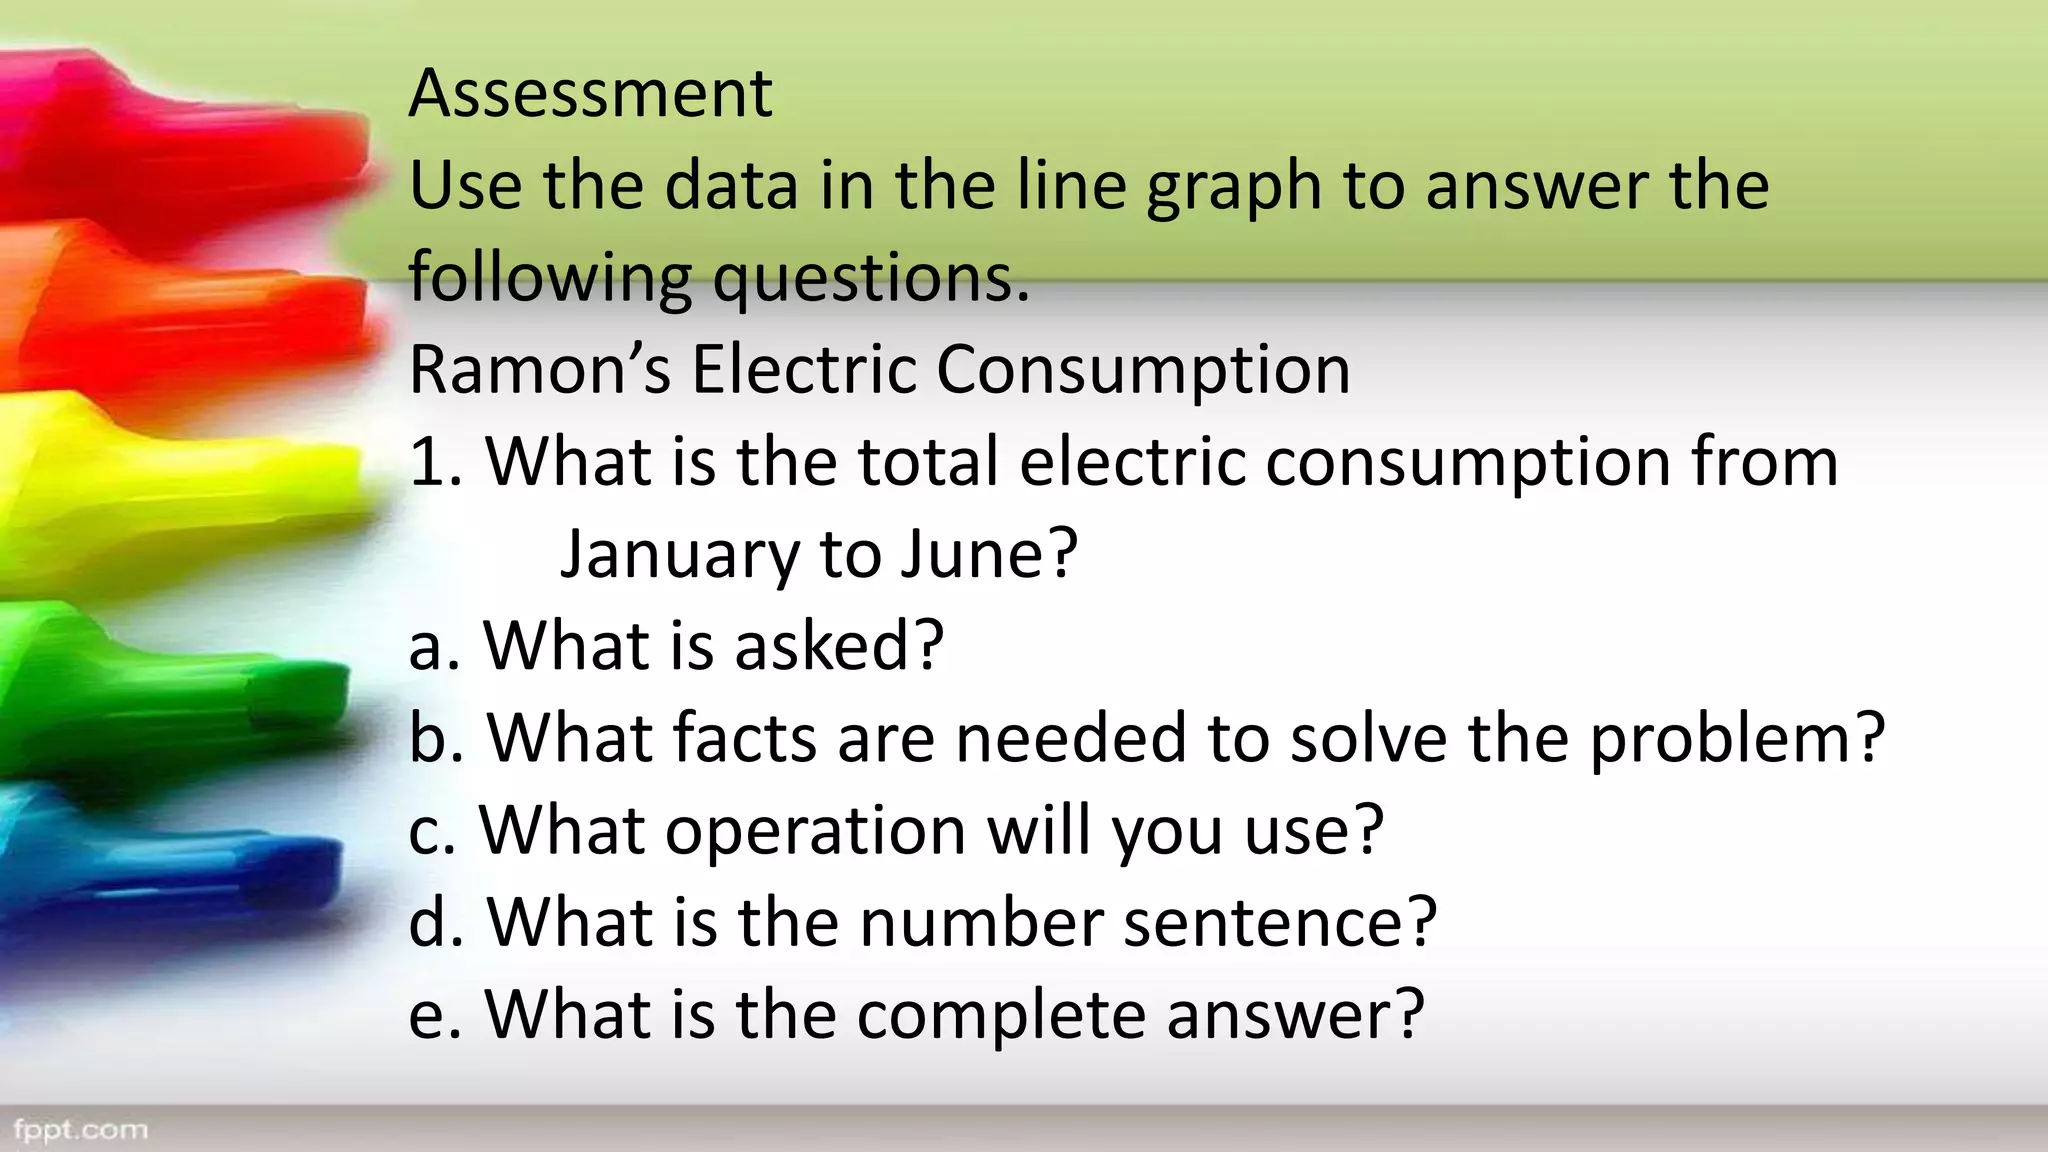
SlideShare a Scribd company logo
Interprets data presented in different kinds of line graphs
(single to doubleline graph)
M5SP-IVh-3.5/Page 65 of 109
1.Drill
Drill on skip counting by 2s, 5s, 10s, etc.
2.Review
Conduct a review on interpreting data presented in
a bar graph.
Gemma’s First Quarter Grade on the Major Subjects
a. In what subject did Gemma have the highest grade?
b. In what subject did she have the lowest grade?
c. In what subjects did she get the same average grade?
d. What is the difference between the highest and lowest grade she got on
the first quarter?
e. What was her average score on the five subjects?
Motivation
How many of you are observant with the day’s
temperature?
Why does a weatherman inform us about
temperature readings?
Why do you think there is a need to check the
day’s temperature from time to time?
Present a line graph with complete parts and let
the pupil interpret the data.
Ask:
1.What are the parts of a line graph?
2.Looking at the data, can you interpret what is
presented by the graph? How?
3.How does a line graph help in data presentation?
4.Is it important to have an accurate data? Why?
Performing the Activities
Group the pupils into five.
Give activity sheets involving line graph to each
group for interpretation.
Ask each group to work together in interpreting
the data on the graph. Once finished, the assign
member will post their work on the board and
discuss their answer.
Explore and Discover!
A line graph is a visual comparison of how
two variables-shown on the x- and y-axes-are related or
varies with each other. It is useful in displaying data or
information that changes continuously overtime. The points
on a line graph are connected by a line.
Five parts of the line graph must be present
for the graph to be complete.
Title
Scale
Labels
Points
Line
Below is an example of a line graph. Study its parts and
answer some of the questions below.
0
10
20
30
40
50
60
70
80
90
5 10 15 20 25 30 35 40 45 50
Distance vs. Time
Time ( sec)
Distance (meters)
What is the title of the line graph?
What information is placed along the vertical axis? On
the horizontal axis?
What is the distance covered by the car after 45 seconds?
At what time did the car reach 80 meters?
What is the speed of the car after 15 seconds?
Study the line graph below. Then, answer the questions
that follow.
NUMBER OF HOUSES CONSTRUCTED FOR FIVE YEARS
0
50
100
150
200
250
2011 2012 2013 2014 2015
Number of Houses
Year
1. What is the graph about?
2. How many houses were constructed in 2012?
3. How many more houses were constructed in 2013
than in 2011?
4. How many houses were constructed from 2011 to
2015?
5. On what year/years was there the same number of
houses constructed?
Study this graph carefully, and then answer the questions
that follow.
0
100
200
300
400
500
600
700
800
900
1000
Sun Mon Tues Wed Thurs Fri Sat
Daily Sales at AlingTaling’s Store
Pesos
Days
1. What is the title of the graph?
2. How much was the sale on Wednesday?
3. On what day was the highest sale?
4. On what day was the sale lowest?
5. How much was the total sales for the week?
Use the graph below to answer the questions below.
COMPARISON OF PLANT GROWTH
0
1
2
3
4
5
6
7
8
Day 1 Day 2 Day 3 Day 4 Day 5
plant outside
plant near the window
Height (centimeters)
1. What is the title of the graph?
2. What is the height of both plants at day 2?
3. Which plant shows great increase in height? Why?
4. What happen to the plant near the window?
1. What is the title of the graph?
2. How much was the sale on Wednesday?
3. On what day was the highest sale?
4. On what day was the sale lowest?
5. How much was the total sales for the week?
What are the parts of a line graph? Why is it useful? How do
we interpret data presented on a line graph?
•A line graph has a title, information on the x-axis (horizontal
axis) and information on the y- axis (vertical axis).
•Changes in the data presented are easily seen on a line
graph.
•To read and interpret the data presented in a line graph, we
usually compare the data in terms of size and amount.
Assessment
Study the line graph, and then answer the question below.
a. What is the title of the graph?
b. How many mangoes were harvested for the first two weeks?
c. In what week was there the greatest amount of harvest?
d. What is the least amount of mango harvested?
e. What is the total amount of harvest for six weeks?
Study this graph carefully, and then answer the questions
that follow.
1. What is the graph about?
2. How much was her initial deposit?
3. In which month was her bank deposit greatest?
4. What was her average deposit??
5. What was her total deposit for six months?
Solves routine and non-routine problems using data
presented in a line graph.
M5SP-IVh-4.5/ Page 65 of 109
Drill
Conduct a drill on reading and interpreting a graph.
1. What is the graph about?
2. On what day did he get the lowest score in Math?
3. On what days were his scores the same?
4. When did he get a perfect score?
5. What was his average score for the week?
Review
Conduct review onthe parts of a line graph.
Have them construct a line graph using the following
data:
Results in an Experiment
Weeks Height of Plant
1 1 cm
2 2 cm
3 2.5 cm
4 3.5 cm
5 4 cm
6 6 cm
Motivation
Is it important to keep track of your performance in
school? What do you do in order to maintain good
performance track?
Presentation
Present a line graph to the class.
Ella’s Grade in Math
Ask:
In what quarter did Ella get the lowest grade? What about the highest grade?
Why do you think Ella got the lowest grade during the 2nd Quarter?
What will you do in order to get good grades?
Performing the Activities
Mr. Sanchez’s Monthly Sales
answer the following questions.
1. What was the sale for the first three consecutive
months?
2. How much more was his sale in March than in
February?
3. What was the difference between the highest
and lowest sale?
4. What was his total sale from January to June?
5. What was his average sale for six months?
Allow each group to present their output.
Ask: How did you find the activity?
How did you solve the problem?
Expected Answer:
Using the four-step plan in solving the problem
• Understand
• Plan
• Solve
• Check and Look Back
Discuss how to solve routine and non-routine problems.
35.5
36
36.5
37
37.5
38
38.5
39
39.5
40
40.5
Day 1 Day 2 Day3 Day 4 Day 5
Temperature in Metro Manila
Temperature (Celsius)
A. What is the difference between the lowest and highest
temperature in Metro Manila?
Use the four-step plan to solve the problem.
Steps Answer
Understand:
What does the problem ask for? The difference between highest and lowest
temperature
What are the given data?
40⁰C and 37⁰C
Plan
What operation is/are to be used?
Subtraction
What is the mathematical sentence?
40-37= N
Show how the solution is done using the operation.
40-37= 3
Check
Check if the answer is correct.
State the final answer. The difference between the highest and
lowest temperature is 3⁰C.
What is the average temperature in Metro Manila for five
days?
Steps Answer
Understand:
What does the problem ask for?
The average temperature in Metro Manila for five days
What are the given data?
39⁰C, 37⁰C, 40 ⁰C, 38⁰C and 40⁰ C
Plan
What operation is/are to be used?
Addition and Division
What is the mathematical sentence?
(39+ 37 + 40 +38 +40)÷ 5= N
Show how the solution is done using the operation. 39+ 37 + 40 +38 +40=194
194 ÷5=38.8
Check
Check if the answer is correct.
State the final answer. The average temperature in Metro Manila for five days is
38.8⁰ C.
Study the table then answer the questions that follow.
0
0.5
1
1.5
2
2.5
3
3.5
Day 1 Day 2 Day 3 Day 4 Day 5
Height of Seedlings
Heigh (cm)
1. What is the change in height after three days?
a. What is asked?
b. What facts are needed to solve the problem?
c. What operation will you use?
d. What is the number sentence?
e. What is the complete answer?
2. What is the difference in height at day five as
compared to day 1?
a. What is asked?
b. What facts are needed to solve the problem?
c. What operation will you use?
d. What is the number sentence?
e. What is the complete answer?
Use the data in the line graph to answer the questions
below.
600
650
700
750
800
850
900
Jan Feb Mar Apr May
Customer in a Saloon
Number of Customers
1. What is the total number of customers at the first three months?
a. What is asked?
b. What facts are needed to solve the problem?
c. What operation will you use?
d. What is the number sentence?
e. What is the complete answer?
2. What was the average number of customers from February to April?
a. What is asked?
b. What facts are needed to solve the problem?
c. What operation will you use?
d. What is the number sentence?
e. What is the complete answer?
3. About how many more customers came into the saloon during the fifth month than
during the fourth month?
a. What is asked?
b. What facts are needed to solve the problem?
c. What operation will you use?
d. What is the number sentence?
e. What is the complete answer?
Use the graph below to answer the questions below.
100
105
110
115
120
125
130
6 7 8 9 10 11
Joel's Height
Height in centimeters
Age
1. What was the increase in Joel’s height from six-year old up to eight-year old?
2. What is the change in his height from seven to eleven-year old?
Lead the pupils in generalizing the following:
Routine problems are problems that follow standard procedure in solving word
problems:
Understand:
•What does the problem ask for?
•What are the given data?
•What is the word clue?
Plan
•What operation is/are to be used?
•What is the mathematical sentence?
Solve
•Show how the solution is done using the operation.
Check
•Check if the answer is correct.
•State the final answer.
Nonroutine problems are problems that can be solved even without following
the steps or procedure
Assessment
Use the data in the line graph to answer the
following questions.
Ramon’s Electric Consumption
1. What is the total electric consumption from
January to June?
a. What is asked?
b. What facts are needed to solve the problem?
c. What operation will you use?
d. What is the number sentence?
e. What is the complete answer?
2.If the cost of electricity per kilowatt is Php. 14.00,
how much would Ramon pay for the month of
May?
a. What is asked?
b. What facts are needed to solve the problem?
c. What operation will you use?
d. What is the number sentence?
e. What is the complete answer?
Immigrants Admitted in One Country from 2010-2015
1.What is the total number of immigrants starting
2010 up to 2015?
2.What is the average number of immigrants for the
last three years?
Draws inferences based on datapresented in a line graph
M5SP-IVh-5.5
Drill
Each group will use the grid board to plot several points
on the graph.
At the signal “Go”, they will start plotting. The first group
to finish will win the game. Let the first group describe
the figure they form based on the points they plotted on
the graph.
(1, 20)
(3, 40)
(4, 60)
(5, 120)
(7, 120)
(7, 60)
(4, 60)
Review
Which of the following line graphs below best describe
the height of a child? Defend your answer.
Motivation
Is it important to get good grades in school?
What will you do in order to attain it?
Presentation
Ana’s Grade in Math
a. At what quarter did Ana get the highest grade in Math?
b. What is the lowest grade she got?
c. Why do you think Ana got low grade on the second
quarter?
Give each group activity sheets involving line graph for
interpretation. Ask the group to work together in
interpreting the data and make inferences out of it. After
they have finished, the leader of each group will display
the output on the board and discuss their answers.
Paulo’s Weight
Each group will discuss their work. After all the groups
have presented their answers to the task given, ask:
How did you find the activity?
How did you make inferences based on the data
observed on the line graph?
Discuss with the pupils how to make inferences
based on the data.
Make a graph out of the given data below. Use the
gridline to plot the points.
HEIGHT OF MONGO PLANT
Number of Weeks Height in centimeter
1 3.5 cm
2 6.5 cm
3 9.5 cm
4 12.5 cm
5 15.5 cm
1. What is the height of the plant on the first week?
2. How do you describe the height of the mongo plant from first to fifth week?
3. What could be its height on week 6? Why did you say so?
Study the graph below and then answer the questions
that follow.
100
150
200
250
300
350
2010 2011 2012 2013 2014 2015
Deworming of Grade V Pupils
Number of Pupils Dewormed
1. How many grade five pupils were dewormed on the first three years?
2. What is the average number of pupils dewormed from 2010 to 2015?
3. If there is a total of 300 pupils in grade V, how many pupils were not dewormed in 2013?
4. What is the difference in the number of grade five pupils dewormed in 2015 than 2014?
5. Why do you think there is a sudden increased in the number of pupils dewormed in
2015?
Metro Manila’s Heat Index in April
30
31
32
33
34
35
36
37
38
39
40
1 8 15 22 29
2011
2010
Temperature (Celsius)
Date in April
1. What was the heat index in Metro Manila on April 15 in 2010? 2011?
2. Did the temperature increase on April 8 in 2010 and 2011?
3. What date in April was the highest heat index for the year 2010? What about in 2011?
4. How do you compare the average heat index in 2010 as compared to 2011?
5. Do you think the heat index in 2012 or 2013 will increase or decrease? Why do you say so?
Summarizing the Lesson
Guide the pupils to give the following generalization.
To draw inferences it is important to:
•observe the parts of the graph
•understand the relationship being illustrated on the
graph
•make prediction based on the describe situation
presented by the data on the graph
Study the line graph them answer the question below.
Baskets Made During Practice
a. How many baskets did each one
make during the third session?
b. Who made more baskets on the
fourth session?
c. What is their average number of
baskets during the five-day
session of practice?
d. How many baskets did each one
make all throughout the
session?
e. Who is more successful in making
a basket?
Solves routine and non-routine problems using data
presented in a line graph
Code M5SP-IVh-4.5, Page 65 of 109
What is the usual temperature in
our country during:
a. Summer days
b. Christmas season
Strategy: Group Activity
a. Divide the class into group of 5s.
b. Give each group activity cards wherein graphs
reflected
and let them interpret the graph and answer questions
such as:
- What data is presented on the x and y-axis?
- Which is the dependent quantity?
- On what axis will you find it?
- How will you find the average of this given
quantities in the line graph?
c. Each group will present their solution on a manila
paper followed by a short discussion or explanation
of their findings.
Directions: Use the graph below to answer the questions
that follow.
a. How many schools were constructed in 1996?
b. How many more schools were constructed in
1998 than in 1997?
c. How many schools were constructed from 1996 to
2 000?
Directions: The graph below shows Carlo’s weight in
kilograms for six months.
Study the graph and answer the questions that follow
How will you solve routine and non-routine problems
Involving line graphs?
Study the graph carefully, then answer the questions
that follow
1. What is the title of the graph?
2. On what day was the sale lowest?
3. On what days were the decrease of sale occur?
4. How much was the total sales?
5. Looking at the data, what can you say about the
average
daily sales of Mang Ben’s Sari-Sari Store?
6. If you were Mang Ben, what will you do to increase the
sales every day?
7. In your opinion, do you think opening business on
Sunday. Is acceptable or not? Why?
1. Chart the following:
- Your own scores in your 5 Math quizzes
- Your own savings in your 5 school days
2. Present these data on a line graph
3. Construct questions based on the data presented
on each line graph
Math 5 Quarter 4 Week 8 D1-5.pptx

More Related Content

What's hot

Volume of Solids
Volume of SolidsVolume of Solids
Volume of Solids
todd1km
 
FINDING ELAPSED TIME; Demonstration teaching
FINDING ELAPSED TIME; Demonstration teaching   FINDING ELAPSED TIME; Demonstration teaching
FINDING ELAPSED TIME; Demonstration teaching
WayneRavi
 
Detailed Lesson Plan on Measures of Variability of Grouped and Ungrouped Data
Detailed Lesson Plan on Measures of Variability of Grouped and Ungrouped DataDetailed Lesson Plan on Measures of Variability of Grouped and Ungrouped Data
Detailed Lesson Plan on Measures of Variability of Grouped and Ungrouped Data
Junila Tejada
 
Estimating square roots
Estimating square rootsEstimating square roots
Estimating square roots
Cindy Smith
 
Grade 1-math-quiz-final
Grade 1-math-quiz-finalGrade 1-math-quiz-final
Grade 1-math-quiz-final
Mehdi Raza
 
Circle and Its Part - Math 7 (3rd Quarter)
Circle and Its Part - Math 7 (3rd Quarter)Circle and Its Part - Math 7 (3rd Quarter)
Circle and Its Part - Math 7 (3rd Quarter)
Carlo Luna
 
Translating Expressions
Translating ExpressionsTranslating Expressions
Translating Expressions
Yelena Melnichenko
 
Math DBOW.pdf
Math DBOW.pdfMath DBOW.pdf
Math DBOW.pdf
MarjieCPanuelos
 
Organizing and presenting data
Organizing and presenting dataOrganizing and presenting data
Organizing and presenting data
Grace Robledo
 
Solving problem involving volume
Solving problem involving volumeSolving problem involving volume
Solving problem involving volume
Deped Tagum City
 
Math 7 | Lesson 2 Set Operations and the Venn Diagram
Math 7 |  Lesson 2 Set Operations and the Venn DiagramMath 7 |  Lesson 2 Set Operations and the Venn Diagram
Math 7 | Lesson 2 Set Operations and the Venn Diagram
Ariel Gilbuena
 
3 math lm q3
3 math lm q33 math lm q3
3 math lm q3
EDITHA HONRADEZ
 
Scientific notation powerpoint
Scientific notation powerpointScientific notation powerpoint
Scientific notation powerpoint
Edison Orgil
 
Adding Integers Ppt
Adding Integers PptAdding Integers Ppt
Adding Integers Ppt
Freedom Preparatory Academy
 
Exponential Notation Slides
Exponential Notation SlidesExponential Notation Slides
Exponential Notation Slides
julienorman80065
 
Dividing a 3 digit Number by a 2 Digit Number
Dividing a 3 digit Number by a 2 Digit Number  Dividing a 3 digit Number by a 2 Digit Number
Dividing a 3 digit Number by a 2 Digit Number
Chris James
 
Math 8 - Linear Inequalities in Two Variables
Math 8 - Linear Inequalities in Two VariablesMath 8 - Linear Inequalities in Two Variables
Math 8 - Linear Inequalities in Two Variables
Carlo Luna
 
Least common multiple
Least common multipleLeast common multiple
Least common multiple
Melanie_Anderson
 
Simplification of Fractions and Operations on Fractions
Simplification of Fractions and Operations on FractionsSimplification of Fractions and Operations on Fractions
Simplification of Fractions and Operations on Fractions
Ver Louie Gautani
 
SHS MATH QUIZ
SHS MATH QUIZSHS MATH QUIZ
SHS MATH QUIZ
John Labrador
 

What's hot (20)

Volume of Solids
Volume of SolidsVolume of Solids
Volume of Solids
 
FINDING ELAPSED TIME; Demonstration teaching
FINDING ELAPSED TIME; Demonstration teaching   FINDING ELAPSED TIME; Demonstration teaching
FINDING ELAPSED TIME; Demonstration teaching
 
Detailed Lesson Plan on Measures of Variability of Grouped and Ungrouped Data
Detailed Lesson Plan on Measures of Variability of Grouped and Ungrouped DataDetailed Lesson Plan on Measures of Variability of Grouped and Ungrouped Data
Detailed Lesson Plan on Measures of Variability of Grouped and Ungrouped Data
 
Estimating square roots
Estimating square rootsEstimating square roots
Estimating square roots
 
Grade 1-math-quiz-final
Grade 1-math-quiz-finalGrade 1-math-quiz-final
Grade 1-math-quiz-final
 
Circle and Its Part - Math 7 (3rd Quarter)
Circle and Its Part - Math 7 (3rd Quarter)Circle and Its Part - Math 7 (3rd Quarter)
Circle and Its Part - Math 7 (3rd Quarter)
 
Translating Expressions
Translating ExpressionsTranslating Expressions
Translating Expressions
 
Math DBOW.pdf
Math DBOW.pdfMath DBOW.pdf
Math DBOW.pdf
 
Organizing and presenting data
Organizing and presenting dataOrganizing and presenting data
Organizing and presenting data
 
Solving problem involving volume
Solving problem involving volumeSolving problem involving volume
Solving problem involving volume
 
Math 7 | Lesson 2 Set Operations and the Venn Diagram
Math 7 |  Lesson 2 Set Operations and the Venn DiagramMath 7 |  Lesson 2 Set Operations and the Venn Diagram
Math 7 | Lesson 2 Set Operations and the Venn Diagram
 
3 math lm q3
3 math lm q33 math lm q3
3 math lm q3
 
Scientific notation powerpoint
Scientific notation powerpointScientific notation powerpoint
Scientific notation powerpoint
 
Adding Integers Ppt
Adding Integers PptAdding Integers Ppt
Adding Integers Ppt
 
Exponential Notation Slides
Exponential Notation SlidesExponential Notation Slides
Exponential Notation Slides
 
Dividing a 3 digit Number by a 2 Digit Number
Dividing a 3 digit Number by a 2 Digit Number  Dividing a 3 digit Number by a 2 Digit Number
Dividing a 3 digit Number by a 2 Digit Number
 
Math 8 - Linear Inequalities in Two Variables
Math 8 - Linear Inequalities in Two VariablesMath 8 - Linear Inequalities in Two Variables
Math 8 - Linear Inequalities in Two Variables
 
Least common multiple
Least common multipleLeast common multiple
Least common multiple
 
Simplification of Fractions and Operations on Fractions
Simplification of Fractions and Operations on FractionsSimplification of Fractions and Operations on Fractions
Simplification of Fractions and Operations on Fractions
 
SHS MATH QUIZ
SHS MATH QUIZSHS MATH QUIZ
SHS MATH QUIZ
 

Similar to Math 5 Quarter 4 Week 8 D1-5.pptx

Demo in Math 5 PPT.pptx melba tag-ulo elem school
Demo in Math 5 PPT.pptx melba tag-ulo elem schoolDemo in Math 5 PPT.pptx melba tag-ulo elem school
Demo in Math 5 PPT.pptx melba tag-ulo elem school
MyrrhBalanayFlorida
 
G7Q4DLL_LC64b.doc
G7Q4DLL_LC64b.docG7Q4DLL_LC64b.doc
G7Q4DLL_LC64b.doc
AngelaCamillePCariag
 
Mathematics- KPUP Sample Test Items- Mr. Marjune M. Nepaya
Mathematics- KPUP Sample Test Items- Mr. Marjune M. NepayaMathematics- KPUP Sample Test Items- Mr. Marjune M. Nepaya
Mathematics- KPUP Sample Test Items- Mr. Marjune M. Nepaya
Marjune Nepaya
 
IELTS Writing Task 1 Charts Lesson
IELTS Writing Task 1 Charts Lesson IELTS Writing Task 1 Charts Lesson
IELTS Writing Task 1 Charts Lesson
British Council
 
Math Module Sample
Math Module SampleMath Module Sample
Math Module Sample
preyaleandrina
 
Higher modern studies extended responses induction
Higher modern studies extended responses  inductionHigher modern studies extended responses  induction
Higher modern studies extended responses induction
mrmarr
 
Di practice set by das sir 09038870684
Di practice set by das sir 09038870684Di practice set by das sir 09038870684
Di practice set by das sir 09038870684
Tamal Kumar Das
 
Mogol johnston 2010_ncea_dif
Mogol johnston 2010_ncea_difMogol johnston 2010_ncea_dif
Mogol johnston 2010_ncea_dif
cv.mogol
 
Seminar #5 writing task 1 introduction
Seminar #5 writing task  1 introductionSeminar #5 writing task  1 introduction
Seminar #5 writing task 1 introduction
GantsetsegS
 
Seminar #5
Seminar #5 Seminar #5
DATA INTERPRETATION.pptx
DATA INTERPRETATION.pptxDATA INTERPRETATION.pptx
DATA INTERPRETATION.pptx
RatneshCrypto
 
1.MATH 221 Statistics for Decision MakingWeek 2 iLabName.docx
1.MATH 221 Statistics for Decision MakingWeek 2 iLabName.docx1.MATH 221 Statistics for Decision MakingWeek 2 iLabName.docx
1.MATH 221 Statistics for Decision MakingWeek 2 iLabName.docx
AlyciaGold776
 
De vry math 399 ilabs & discussions latest 2016 november
De vry math 399 ilabs & discussions latest 2016 novemberDe vry math 399 ilabs & discussions latest 2016 november
De vry math 399 ilabs & discussions latest 2016 november
lenasour
 
De vry math 399 ilabs & discussions latest 2016
De vry math 399 ilabs & discussions latest 2016De vry math 399 ilabs & discussions latest 2016
De vry math 399 ilabs & discussions latest 2016
lenasour
 
Psychometric success numerical ability data interpretation practice test 1
Psychometric success numerical ability   data interpretation practice test 1Psychometric success numerical ability   data interpretation practice test 1
Psychometric success numerical ability data interpretation practice test 1
Pooja Kapoor
 
Psychometric success numerical ability data interpretation practice test 1 (1)
Psychometric success numerical ability   data interpretation practice test 1 (1)Psychometric success numerical ability   data interpretation practice test 1 (1)
Psychometric success numerical ability data interpretation practice test 1 (1)
Roselito Baclay
 
Psychometric success numerical ability data interpretation practice test 1 ...
Psychometric success numerical ability   data interpretation practice test 1 ...Psychometric success numerical ability   data interpretation practice test 1 ...
Psychometric success numerical ability data interpretation practice test 1 ...
Roselito Baclay
 
Psychometric success numerical ability data interpretation practice test 1
Psychometric success numerical ability   data interpretation practice test 1Psychometric success numerical ability   data interpretation practice test 1
Psychometric success numerical ability data interpretation practice test 1
Roselito Baclay
 
Psychometric success numerical ability data interpretation practice test 1 ...
Psychometric success numerical ability   data interpretation practice test 1 ...Psychometric success numerical ability   data interpretation practice test 1 ...
Psychometric success numerical ability data interpretation practice test 1 ...
Roselito Baclay
 
FINAL COT4 finale, finalization, the last one.pptx
FINAL COT4 finale, finalization, the last one.pptxFINAL COT4 finale, finalization, the last one.pptx
FINAL COT4 finale, finalization, the last one.pptx
FredericoSacro2
 

Similar to Math 5 Quarter 4 Week 8 D1-5.pptx (20)

Demo in Math 5 PPT.pptx melba tag-ulo elem school
Demo in Math 5 PPT.pptx melba tag-ulo elem schoolDemo in Math 5 PPT.pptx melba tag-ulo elem school
Demo in Math 5 PPT.pptx melba tag-ulo elem school
 
G7Q4DLL_LC64b.doc
G7Q4DLL_LC64b.docG7Q4DLL_LC64b.doc
G7Q4DLL_LC64b.doc
 
Mathematics- KPUP Sample Test Items- Mr. Marjune M. Nepaya
Mathematics- KPUP Sample Test Items- Mr. Marjune M. NepayaMathematics- KPUP Sample Test Items- Mr. Marjune M. Nepaya
Mathematics- KPUP Sample Test Items- Mr. Marjune M. Nepaya
 
IELTS Writing Task 1 Charts Lesson
IELTS Writing Task 1 Charts Lesson IELTS Writing Task 1 Charts Lesson
IELTS Writing Task 1 Charts Lesson
 
Math Module Sample
Math Module SampleMath Module Sample
Math Module Sample
 
Higher modern studies extended responses induction
Higher modern studies extended responses  inductionHigher modern studies extended responses  induction
Higher modern studies extended responses induction
 
Di practice set by das sir 09038870684
Di practice set by das sir 09038870684Di practice set by das sir 09038870684
Di practice set by das sir 09038870684
 
Mogol johnston 2010_ncea_dif
Mogol johnston 2010_ncea_difMogol johnston 2010_ncea_dif
Mogol johnston 2010_ncea_dif
 
Seminar #5 writing task 1 introduction
Seminar #5 writing task  1 introductionSeminar #5 writing task  1 introduction
Seminar #5 writing task 1 introduction
 
Seminar #5
Seminar #5 Seminar #5
Seminar #5
 
DATA INTERPRETATION.pptx
DATA INTERPRETATION.pptxDATA INTERPRETATION.pptx
DATA INTERPRETATION.pptx
 
1.MATH 221 Statistics for Decision MakingWeek 2 iLabName.docx
1.MATH 221 Statistics for Decision MakingWeek 2 iLabName.docx1.MATH 221 Statistics for Decision MakingWeek 2 iLabName.docx
1.MATH 221 Statistics for Decision MakingWeek 2 iLabName.docx
 
De vry math 399 ilabs & discussions latest 2016 november
De vry math 399 ilabs & discussions latest 2016 novemberDe vry math 399 ilabs & discussions latest 2016 november
De vry math 399 ilabs & discussions latest 2016 november
 
De vry math 399 ilabs & discussions latest 2016
De vry math 399 ilabs & discussions latest 2016De vry math 399 ilabs & discussions latest 2016
De vry math 399 ilabs & discussions latest 2016
 
Psychometric success numerical ability data interpretation practice test 1
Psychometric success numerical ability   data interpretation practice test 1Psychometric success numerical ability   data interpretation practice test 1
Psychometric success numerical ability data interpretation practice test 1
 
Psychometric success numerical ability data interpretation practice test 1 (1)
Psychometric success numerical ability   data interpretation practice test 1 (1)Psychometric success numerical ability   data interpretation practice test 1 (1)
Psychometric success numerical ability data interpretation practice test 1 (1)
 
Psychometric success numerical ability data interpretation practice test 1 ...
Psychometric success numerical ability   data interpretation practice test 1 ...Psychometric success numerical ability   data interpretation practice test 1 ...
Psychometric success numerical ability data interpretation practice test 1 ...
 
Psychometric success numerical ability data interpretation practice test 1
Psychometric success numerical ability   data interpretation practice test 1Psychometric success numerical ability   data interpretation practice test 1
Psychometric success numerical ability data interpretation practice test 1
 
Psychometric success numerical ability data interpretation practice test 1 ...
Psychometric success numerical ability   data interpretation practice test 1 ...Psychometric success numerical ability   data interpretation practice test 1 ...
Psychometric success numerical ability data interpretation practice test 1 ...
 
FINAL COT4 finale, finalization, the last one.pptx
FINAL COT4 finale, finalization, the last one.pptxFINAL COT4 finale, finalization, the last one.pptx
FINAL COT4 finale, finalization, the last one.pptx
 

Recently uploaded

Bed Making ( Introduction, Purpose, Types, Articles, Scientific principles, N...
Bed Making ( Introduction, Purpose, Types, Articles, Scientific principles, N...Bed Making ( Introduction, Purpose, Types, Articles, Scientific principles, N...
Bed Making ( Introduction, Purpose, Types, Articles, Scientific principles, N...
Leena Ghag-Sakpal
 
Leveraging Generative AI to Drive Nonprofit Innovation
Leveraging Generative AI to Drive Nonprofit InnovationLeveraging Generative AI to Drive Nonprofit Innovation
Leveraging Generative AI to Drive Nonprofit Innovation
TechSoup
 
Constructing Your Course Container for Effective Communication
Constructing Your Course Container for Effective CommunicationConstructing Your Course Container for Effective Communication
Constructing Your Course Container for Effective Communication
Chevonnese Chevers Whyte, MBA, B.Sc.
 
The basics of sentences session 6pptx.pptx
The basics of sentences session 6pptx.pptxThe basics of sentences session 6pptx.pptx
The basics of sentences session 6pptx.pptx
heathfieldcps1
 
Chapter wise All Notes of First year Basic Civil Engineering.pptx
Chapter wise All Notes of First year Basic Civil Engineering.pptxChapter wise All Notes of First year Basic Civil Engineering.pptx
Chapter wise All Notes of First year Basic Civil Engineering.pptx
Denish Jangid
 
IGCSE Biology Chapter 14- Reproduction in Plants.pdf
IGCSE Biology Chapter 14- Reproduction in Plants.pdfIGCSE Biology Chapter 14- Reproduction in Plants.pdf
IGCSE Biology Chapter 14- Reproduction in Plants.pdf
Amin Marwan
 
RHEOLOGY Physical pharmaceutics-II notes for B.pharm 4th sem students
RHEOLOGY Physical pharmaceutics-II notes for B.pharm 4th sem studentsRHEOLOGY Physical pharmaceutics-II notes for B.pharm 4th sem students
RHEOLOGY Physical pharmaceutics-II notes for B.pharm 4th sem students
Himanshu Rai
 
ZK on Polkadot zero knowledge proofs - sub0.pptx
ZK on Polkadot zero knowledge proofs - sub0.pptxZK on Polkadot zero knowledge proofs - sub0.pptx
ZK on Polkadot zero knowledge proofs - sub0.pptx
dot55audits
 
Hindi varnamala | hindi alphabet PPT.pdf
Hindi varnamala | hindi alphabet PPT.pdfHindi varnamala | hindi alphabet PPT.pdf
Hindi varnamala | hindi alphabet PPT.pdf
Dr. Mulla Adam Ali
 
Philippine Edukasyong Pantahanan at Pangkabuhayan (EPP) Curriculum
Philippine Edukasyong Pantahanan at Pangkabuhayan (EPP) CurriculumPhilippine Edukasyong Pantahanan at Pangkabuhayan (EPP) Curriculum
Philippine Edukasyong Pantahanan at Pangkabuhayan (EPP) Curriculum
MJDuyan
 
MARY JANE WILSON, A “BOA MÃE” .
MARY JANE WILSON, A “BOA MÃE”           .MARY JANE WILSON, A “BOA MÃE”           .
MARY JANE WILSON, A “BOA MÃE” .
Colégio Santa Teresinha
 
Pengantar Penggunaan Flutter - Dart programming language1.pptx
Pengantar Penggunaan Flutter - Dart programming language1.pptxPengantar Penggunaan Flutter - Dart programming language1.pptx
Pengantar Penggunaan Flutter - Dart programming language1.pptx
Fajar Baskoro
 
spot a liar (Haiqa 146).pptx Technical writhing and presentation skills
spot a liar (Haiqa 146).pptx Technical writhing and presentation skillsspot a liar (Haiqa 146).pptx Technical writhing and presentation skills
spot a liar (Haiqa 146).pptx Technical writhing and presentation skills
haiqairshad
 
Main Java[All of the Base Concepts}.docx
Main Java[All of the Base Concepts}.docxMain Java[All of the Base Concepts}.docx
Main Java[All of the Base Concepts}.docx
adhitya5119
 
Traditional Musical Instruments of Arunachal Pradesh and Uttar Pradesh - RAYH...
Traditional Musical Instruments of Arunachal Pradesh and Uttar Pradesh - RAYH...Traditional Musical Instruments of Arunachal Pradesh and Uttar Pradesh - RAYH...
Traditional Musical Instruments of Arunachal Pradesh and Uttar Pradesh - RAYH...
imrankhan141184
 
Film vocab for eal 3 students: Australia the movie
Film vocab for eal 3 students: Australia the movieFilm vocab for eal 3 students: Australia the movie
Film vocab for eal 3 students: Australia the movie
Nicholas Montgomery
 
Your Skill Boost Masterclass: Strategies for Effective Upskilling
Your Skill Boost Masterclass: Strategies for Effective UpskillingYour Skill Boost Masterclass: Strategies for Effective Upskilling
Your Skill Boost Masterclass: Strategies for Effective Upskilling
Excellence Foundation for South Sudan
 
Wound healing PPT
Wound healing PPTWound healing PPT
Wound healing PPT
Jyoti Chand
 
BÀI TẬP BỔ TRỢ TIẾNG ANH 8 CẢ NĂM - GLOBAL SUCCESS - NĂM HỌC 2023-2024 (CÓ FI...
BÀI TẬP BỔ TRỢ TIẾNG ANH 8 CẢ NĂM - GLOBAL SUCCESS - NĂM HỌC 2023-2024 (CÓ FI...BÀI TẬP BỔ TRỢ TIẾNG ANH 8 CẢ NĂM - GLOBAL SUCCESS - NĂM HỌC 2023-2024 (CÓ FI...
BÀI TẬP BỔ TRỢ TIẾNG ANH 8 CẢ NĂM - GLOBAL SUCCESS - NĂM HỌC 2023-2024 (CÓ FI...
Nguyen Thanh Tu Collection
 
Temple of Asclepius in Thrace. Excavation results
Temple of Asclepius in Thrace. Excavation resultsTemple of Asclepius in Thrace. Excavation results
Temple of Asclepius in Thrace. Excavation results
Krassimira Luka
 

Recently uploaded (20)

Bed Making ( Introduction, Purpose, Types, Articles, Scientific principles, N...
Bed Making ( Introduction, Purpose, Types, Articles, Scientific principles, N...Bed Making ( Introduction, Purpose, Types, Articles, Scientific principles, N...
Bed Making ( Introduction, Purpose, Types, Articles, Scientific principles, N...
 
Leveraging Generative AI to Drive Nonprofit Innovation
Leveraging Generative AI to Drive Nonprofit InnovationLeveraging Generative AI to Drive Nonprofit Innovation
Leveraging Generative AI to Drive Nonprofit Innovation
 
Constructing Your Course Container for Effective Communication
Constructing Your Course Container for Effective CommunicationConstructing Your Course Container for Effective Communication
Constructing Your Course Container for Effective Communication
 
The basics of sentences session 6pptx.pptx
The basics of sentences session 6pptx.pptxThe basics of sentences session 6pptx.pptx
The basics of sentences session 6pptx.pptx
 
Chapter wise All Notes of First year Basic Civil Engineering.pptx
Chapter wise All Notes of First year Basic Civil Engineering.pptxChapter wise All Notes of First year Basic Civil Engineering.pptx
Chapter wise All Notes of First year Basic Civil Engineering.pptx
 
IGCSE Biology Chapter 14- Reproduction in Plants.pdf
IGCSE Biology Chapter 14- Reproduction in Plants.pdfIGCSE Biology Chapter 14- Reproduction in Plants.pdf
IGCSE Biology Chapter 14- Reproduction in Plants.pdf
 
RHEOLOGY Physical pharmaceutics-II notes for B.pharm 4th sem students
RHEOLOGY Physical pharmaceutics-II notes for B.pharm 4th sem studentsRHEOLOGY Physical pharmaceutics-II notes for B.pharm 4th sem students
RHEOLOGY Physical pharmaceutics-II notes for B.pharm 4th sem students
 
ZK on Polkadot zero knowledge proofs - sub0.pptx
ZK on Polkadot zero knowledge proofs - sub0.pptxZK on Polkadot zero knowledge proofs - sub0.pptx
ZK on Polkadot zero knowledge proofs - sub0.pptx
 
Hindi varnamala | hindi alphabet PPT.pdf
Hindi varnamala | hindi alphabet PPT.pdfHindi varnamala | hindi alphabet PPT.pdf
Hindi varnamala | hindi alphabet PPT.pdf
 
Philippine Edukasyong Pantahanan at Pangkabuhayan (EPP) Curriculum
Philippine Edukasyong Pantahanan at Pangkabuhayan (EPP) CurriculumPhilippine Edukasyong Pantahanan at Pangkabuhayan (EPP) Curriculum
Philippine Edukasyong Pantahanan at Pangkabuhayan (EPP) Curriculum
 
MARY JANE WILSON, A “BOA MÃE” .
MARY JANE WILSON, A “BOA MÃE”           .MARY JANE WILSON, A “BOA MÃE”           .
MARY JANE WILSON, A “BOA MÃE” .
 
Pengantar Penggunaan Flutter - Dart programming language1.pptx
Pengantar Penggunaan Flutter - Dart programming language1.pptxPengantar Penggunaan Flutter - Dart programming language1.pptx
Pengantar Penggunaan Flutter - Dart programming language1.pptx
 
spot a liar (Haiqa 146).pptx Technical writhing and presentation skills
spot a liar (Haiqa 146).pptx Technical writhing and presentation skillsspot a liar (Haiqa 146).pptx Technical writhing and presentation skills
spot a liar (Haiqa 146).pptx Technical writhing and presentation skills
 
Main Java[All of the Base Concepts}.docx
Main Java[All of the Base Concepts}.docxMain Java[All of the Base Concepts}.docx
Main Java[All of the Base Concepts}.docx
 
Traditional Musical Instruments of Arunachal Pradesh and Uttar Pradesh - RAYH...
Traditional Musical Instruments of Arunachal Pradesh and Uttar Pradesh - RAYH...Traditional Musical Instruments of Arunachal Pradesh and Uttar Pradesh - RAYH...
Traditional Musical Instruments of Arunachal Pradesh and Uttar Pradesh - RAYH...
 
Film vocab for eal 3 students: Australia the movie
Film vocab for eal 3 students: Australia the movieFilm vocab for eal 3 students: Australia the movie
Film vocab for eal 3 students: Australia the movie
 
Your Skill Boost Masterclass: Strategies for Effective Upskilling
Your Skill Boost Masterclass: Strategies for Effective UpskillingYour Skill Boost Masterclass: Strategies for Effective Upskilling
Your Skill Boost Masterclass: Strategies for Effective Upskilling
 
Wound healing PPT
Wound healing PPTWound healing PPT
Wound healing PPT
 
BÀI TẬP BỔ TRỢ TIẾNG ANH 8 CẢ NĂM - GLOBAL SUCCESS - NĂM HỌC 2023-2024 (CÓ FI...
BÀI TẬP BỔ TRỢ TIẾNG ANH 8 CẢ NĂM - GLOBAL SUCCESS - NĂM HỌC 2023-2024 (CÓ FI...BÀI TẬP BỔ TRỢ TIẾNG ANH 8 CẢ NĂM - GLOBAL SUCCESS - NĂM HỌC 2023-2024 (CÓ FI...
BÀI TẬP BỔ TRỢ TIẾNG ANH 8 CẢ NĂM - GLOBAL SUCCESS - NĂM HỌC 2023-2024 (CÓ FI...
 
Temple of Asclepius in Thrace. Excavation results
Temple of Asclepius in Thrace. Excavation resultsTemple of Asclepius in Thrace. Excavation results
Temple of Asclepius in Thrace. Excavation results
 

Math 5 Quarter 4 Week 8 D1-5.pptx

  • 1. Interprets data presented in different kinds of line graphs (single to doubleline graph) M5SP-IVh-3.5/Page 65 of 109
  • 2. 1.Drill Drill on skip counting by 2s, 5s, 10s, etc. 2.Review Conduct a review on interpreting data presented in a bar graph.
  • 3. Gemma’s First Quarter Grade on the Major Subjects a. In what subject did Gemma have the highest grade? b. In what subject did she have the lowest grade? c. In what subjects did she get the same average grade? d. What is the difference between the highest and lowest grade she got on the first quarter? e. What was her average score on the five subjects?
  • 4. Motivation How many of you are observant with the day’s temperature? Why does a weatherman inform us about temperature readings? Why do you think there is a need to check the day’s temperature from time to time?
  • 5. Present a line graph with complete parts and let the pupil interpret the data. Ask: 1.What are the parts of a line graph? 2.Looking at the data, can you interpret what is presented by the graph? How? 3.How does a line graph help in data presentation? 4.Is it important to have an accurate data? Why?
  • 6. Performing the Activities Group the pupils into five. Give activity sheets involving line graph to each group for interpretation. Ask each group to work together in interpreting the data on the graph. Once finished, the assign member will post their work on the board and discuss their answer.
  • 7.
  • 8. Explore and Discover! A line graph is a visual comparison of how two variables-shown on the x- and y-axes-are related or varies with each other. It is useful in displaying data or information that changes continuously overtime. The points on a line graph are connected by a line. Five parts of the line graph must be present for the graph to be complete. Title Scale Labels Points Line
  • 9. Below is an example of a line graph. Study its parts and answer some of the questions below. 0 10 20 30 40 50 60 70 80 90 5 10 15 20 25 30 35 40 45 50 Distance vs. Time Time ( sec) Distance (meters)
  • 10. What is the title of the line graph? What information is placed along the vertical axis? On the horizontal axis? What is the distance covered by the car after 45 seconds? At what time did the car reach 80 meters? What is the speed of the car after 15 seconds?
  • 11. Study the line graph below. Then, answer the questions that follow. NUMBER OF HOUSES CONSTRUCTED FOR FIVE YEARS 0 50 100 150 200 250 2011 2012 2013 2014 2015 Number of Houses Year
  • 12. 1. What is the graph about? 2. How many houses were constructed in 2012? 3. How many more houses were constructed in 2013 than in 2011? 4. How many houses were constructed from 2011 to 2015? 5. On what year/years was there the same number of houses constructed?
  • 13. Study this graph carefully, and then answer the questions that follow. 0 100 200 300 400 500 600 700 800 900 1000 Sun Mon Tues Wed Thurs Fri Sat Daily Sales at AlingTaling’s Store Pesos Days
  • 14. 1. What is the title of the graph? 2. How much was the sale on Wednesday? 3. On what day was the highest sale? 4. On what day was the sale lowest? 5. How much was the total sales for the week?
  • 15. Use the graph below to answer the questions below. COMPARISON OF PLANT GROWTH 0 1 2 3 4 5 6 7 8 Day 1 Day 2 Day 3 Day 4 Day 5 plant outside plant near the window Height (centimeters) 1. What is the title of the graph? 2. What is the height of both plants at day 2? 3. Which plant shows great increase in height? Why? 4. What happen to the plant near the window?
  • 16. 1. What is the title of the graph? 2. How much was the sale on Wednesday? 3. On what day was the highest sale? 4. On what day was the sale lowest? 5. How much was the total sales for the week?
  • 17. What are the parts of a line graph? Why is it useful? How do we interpret data presented on a line graph? •A line graph has a title, information on the x-axis (horizontal axis) and information on the y- axis (vertical axis). •Changes in the data presented are easily seen on a line graph. •To read and interpret the data presented in a line graph, we usually compare the data in terms of size and amount.
  • 18. Assessment Study the line graph, and then answer the question below. a. What is the title of the graph? b. How many mangoes were harvested for the first two weeks? c. In what week was there the greatest amount of harvest? d. What is the least amount of mango harvested? e. What is the total amount of harvest for six weeks?
  • 19. Study this graph carefully, and then answer the questions that follow. 1. What is the graph about? 2. How much was her initial deposit? 3. In which month was her bank deposit greatest? 4. What was her average deposit?? 5. What was her total deposit for six months?
  • 20. Solves routine and non-routine problems using data presented in a line graph. M5SP-IVh-4.5/ Page 65 of 109
  • 21. Drill Conduct a drill on reading and interpreting a graph. 1. What is the graph about? 2. On what day did he get the lowest score in Math? 3. On what days were his scores the same? 4. When did he get a perfect score? 5. What was his average score for the week?
  • 22. Review Conduct review onthe parts of a line graph. Have them construct a line graph using the following data: Results in an Experiment Weeks Height of Plant 1 1 cm 2 2 cm 3 2.5 cm 4 3.5 cm 5 4 cm 6 6 cm
  • 23. Motivation Is it important to keep track of your performance in school? What do you do in order to maintain good performance track?
  • 24. Presentation Present a line graph to the class. Ella’s Grade in Math Ask: In what quarter did Ella get the lowest grade? What about the highest grade? Why do you think Ella got the lowest grade during the 2nd Quarter? What will you do in order to get good grades?
  • 25. Performing the Activities Mr. Sanchez’s Monthly Sales answer the following questions. 1. What was the sale for the first three consecutive months? 2. How much more was his sale in March than in February? 3. What was the difference between the highest and lowest sale? 4. What was his total sale from January to June? 5. What was his average sale for six months?
  • 26. Allow each group to present their output. Ask: How did you find the activity? How did you solve the problem? Expected Answer: Using the four-step plan in solving the problem • Understand • Plan • Solve • Check and Look Back Discuss how to solve routine and non-routine problems.
  • 27. 35.5 36 36.5 37 37.5 38 38.5 39 39.5 40 40.5 Day 1 Day 2 Day3 Day 4 Day 5 Temperature in Metro Manila Temperature (Celsius) A. What is the difference between the lowest and highest temperature in Metro Manila?
  • 28. Use the four-step plan to solve the problem. Steps Answer Understand: What does the problem ask for? The difference between highest and lowest temperature What are the given data? 40⁰C and 37⁰C Plan What operation is/are to be used? Subtraction What is the mathematical sentence? 40-37= N Show how the solution is done using the operation. 40-37= 3 Check Check if the answer is correct. State the final answer. The difference between the highest and lowest temperature is 3⁰C.
  • 29. What is the average temperature in Metro Manila for five days? Steps Answer Understand: What does the problem ask for? The average temperature in Metro Manila for five days What are the given data? 39⁰C, 37⁰C, 40 ⁰C, 38⁰C and 40⁰ C Plan What operation is/are to be used? Addition and Division What is the mathematical sentence? (39+ 37 + 40 +38 +40)÷ 5= N Show how the solution is done using the operation. 39+ 37 + 40 +38 +40=194 194 ÷5=38.8 Check Check if the answer is correct. State the final answer. The average temperature in Metro Manila for five days is 38.8⁰ C.
  • 30. Study the table then answer the questions that follow. 0 0.5 1 1.5 2 2.5 3 3.5 Day 1 Day 2 Day 3 Day 4 Day 5 Height of Seedlings Heigh (cm)
  • 31. 1. What is the change in height after three days? a. What is asked? b. What facts are needed to solve the problem? c. What operation will you use? d. What is the number sentence? e. What is the complete answer? 2. What is the difference in height at day five as compared to day 1? a. What is asked? b. What facts are needed to solve the problem? c. What operation will you use? d. What is the number sentence? e. What is the complete answer?
  • 32. Use the data in the line graph to answer the questions below. 600 650 700 750 800 850 900 Jan Feb Mar Apr May Customer in a Saloon Number of Customers
  • 33. 1. What is the total number of customers at the first three months? a. What is asked? b. What facts are needed to solve the problem? c. What operation will you use? d. What is the number sentence? e. What is the complete answer? 2. What was the average number of customers from February to April? a. What is asked? b. What facts are needed to solve the problem? c. What operation will you use? d. What is the number sentence? e. What is the complete answer? 3. About how many more customers came into the saloon during the fifth month than during the fourth month? a. What is asked? b. What facts are needed to solve the problem? c. What operation will you use? d. What is the number sentence? e. What is the complete answer?
  • 34. Use the graph below to answer the questions below. 100 105 110 115 120 125 130 6 7 8 9 10 11 Joel's Height Height in centimeters Age 1. What was the increase in Joel’s height from six-year old up to eight-year old? 2. What is the change in his height from seven to eleven-year old?
  • 35. Lead the pupils in generalizing the following: Routine problems are problems that follow standard procedure in solving word problems: Understand: •What does the problem ask for? •What are the given data? •What is the word clue? Plan •What operation is/are to be used? •What is the mathematical sentence? Solve •Show how the solution is done using the operation. Check •Check if the answer is correct. •State the final answer. Nonroutine problems are problems that can be solved even without following the steps or procedure
  • 36. Assessment Use the data in the line graph to answer the following questions. Ramon’s Electric Consumption 1. What is the total electric consumption from January to June? a. What is asked? b. What facts are needed to solve the problem? c. What operation will you use? d. What is the number sentence? e. What is the complete answer?
  • 37. 2.If the cost of electricity per kilowatt is Php. 14.00, how much would Ramon pay for the month of May? a. What is asked? b. What facts are needed to solve the problem? c. What operation will you use? d. What is the number sentence? e. What is the complete answer?
  • 38. Immigrants Admitted in One Country from 2010-2015 1.What is the total number of immigrants starting 2010 up to 2015? 2.What is the average number of immigrants for the last three years?
  • 39. Draws inferences based on datapresented in a line graph M5SP-IVh-5.5
  • 40. Drill Each group will use the grid board to plot several points on the graph. At the signal “Go”, they will start plotting. The first group to finish will win the game. Let the first group describe the figure they form based on the points they plotted on the graph. (1, 20) (3, 40) (4, 60) (5, 120) (7, 120) (7, 60) (4, 60)
  • 41.
  • 42. Review Which of the following line graphs below best describe the height of a child? Defend your answer.
  • 43. Motivation Is it important to get good grades in school? What will you do in order to attain it?
  • 44. Presentation Ana’s Grade in Math a. At what quarter did Ana get the highest grade in Math? b. What is the lowest grade she got? c. Why do you think Ana got low grade on the second quarter?
  • 45. Give each group activity sheets involving line graph for interpretation. Ask the group to work together in interpreting the data and make inferences out of it. After they have finished, the leader of each group will display the output on the board and discuss their answers.
  • 47. Each group will discuss their work. After all the groups have presented their answers to the task given, ask: How did you find the activity? How did you make inferences based on the data observed on the line graph? Discuss with the pupils how to make inferences based on the data.
  • 48. Make a graph out of the given data below. Use the gridline to plot the points. HEIGHT OF MONGO PLANT Number of Weeks Height in centimeter 1 3.5 cm 2 6.5 cm 3 9.5 cm 4 12.5 cm 5 15.5 cm 1. What is the height of the plant on the first week? 2. How do you describe the height of the mongo plant from first to fifth week? 3. What could be its height on week 6? Why did you say so?
  • 49. Study the graph below and then answer the questions that follow. 100 150 200 250 300 350 2010 2011 2012 2013 2014 2015 Deworming of Grade V Pupils Number of Pupils Dewormed 1. How many grade five pupils were dewormed on the first three years? 2. What is the average number of pupils dewormed from 2010 to 2015? 3. If there is a total of 300 pupils in grade V, how many pupils were not dewormed in 2013? 4. What is the difference in the number of grade five pupils dewormed in 2015 than 2014? 5. Why do you think there is a sudden increased in the number of pupils dewormed in 2015?
  • 50. Metro Manila’s Heat Index in April 30 31 32 33 34 35 36 37 38 39 40 1 8 15 22 29 2011 2010 Temperature (Celsius) Date in April 1. What was the heat index in Metro Manila on April 15 in 2010? 2011? 2. Did the temperature increase on April 8 in 2010 and 2011? 3. What date in April was the highest heat index for the year 2010? What about in 2011? 4. How do you compare the average heat index in 2010 as compared to 2011? 5. Do you think the heat index in 2012 or 2013 will increase or decrease? Why do you say so?
  • 51. Summarizing the Lesson Guide the pupils to give the following generalization. To draw inferences it is important to: •observe the parts of the graph •understand the relationship being illustrated on the graph •make prediction based on the describe situation presented by the data on the graph
  • 52. Study the line graph them answer the question below. Baskets Made During Practice a. How many baskets did each one make during the third session? b. Who made more baskets on the fourth session? c. What is their average number of baskets during the five-day session of practice? d. How many baskets did each one make all throughout the session? e. Who is more successful in making a basket?
  • 53. Solves routine and non-routine problems using data presented in a line graph Code M5SP-IVh-4.5, Page 65 of 109
  • 54. What is the usual temperature in our country during: a. Summer days b. Christmas season
  • 55. Strategy: Group Activity a. Divide the class into group of 5s. b. Give each group activity cards wherein graphs reflected and let them interpret the graph and answer questions such as: - What data is presented on the x and y-axis? - Which is the dependent quantity? - On what axis will you find it? - How will you find the average of this given quantities in the line graph? c. Each group will present their solution on a manila paper followed by a short discussion or explanation of their findings.
  • 56. Directions: Use the graph below to answer the questions that follow. a. How many schools were constructed in 1996? b. How many more schools were constructed in 1998 than in 1997? c. How many schools were constructed from 1996 to 2 000?
  • 57. Directions: The graph below shows Carlo’s weight in kilograms for six months. Study the graph and answer the questions that follow
  • 58. How will you solve routine and non-routine problems Involving line graphs?
  • 59. Study the graph carefully, then answer the questions that follow 1. What is the title of the graph? 2. On what day was the sale lowest? 3. On what days were the decrease of sale occur? 4. How much was the total sales? 5. Looking at the data, what can you say about the average daily sales of Mang Ben’s Sari-Sari Store? 6. If you were Mang Ben, what will you do to increase the sales every day? 7. In your opinion, do you think opening business on Sunday. Is acceptable or not? Why?
  • 60. 1. Chart the following: - Your own scores in your 5 Math quizzes - Your own savings in your 5 school days 2. Present these data on a line graph 3. Construct questions based on the data presented on each line graph