
Download as PDF, PPTX
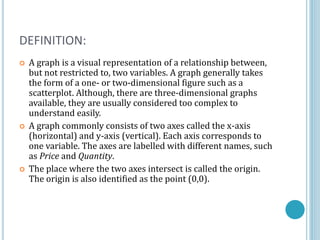
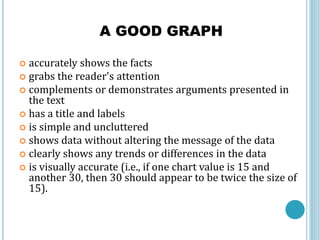
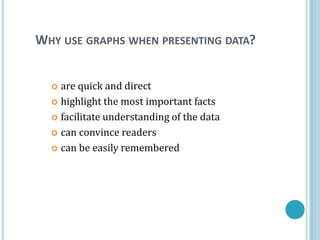
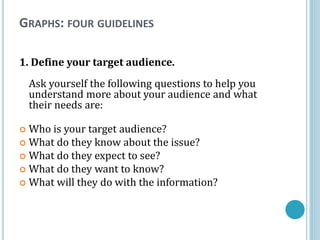
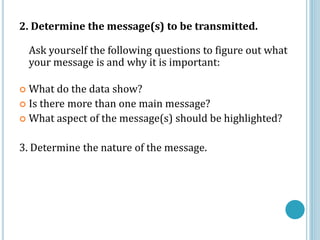
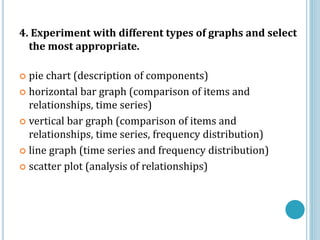


This document provides information about graphs, including their definition, purpose, types, and guidelines for creating effective graphs. A graph is a visual representation of the relationship between two variables plotted on x and y axes. Good graphs accurately portray data in a clear, simple manner to help readers understand relationships and trends. Common graph types include bar graphs, pie charts, pictographs, and line graphs, each suited for certain types of data. Guidelines for graphing include understanding the audience and message, and experimenting with different graph styles to pick the most appropriate one.


