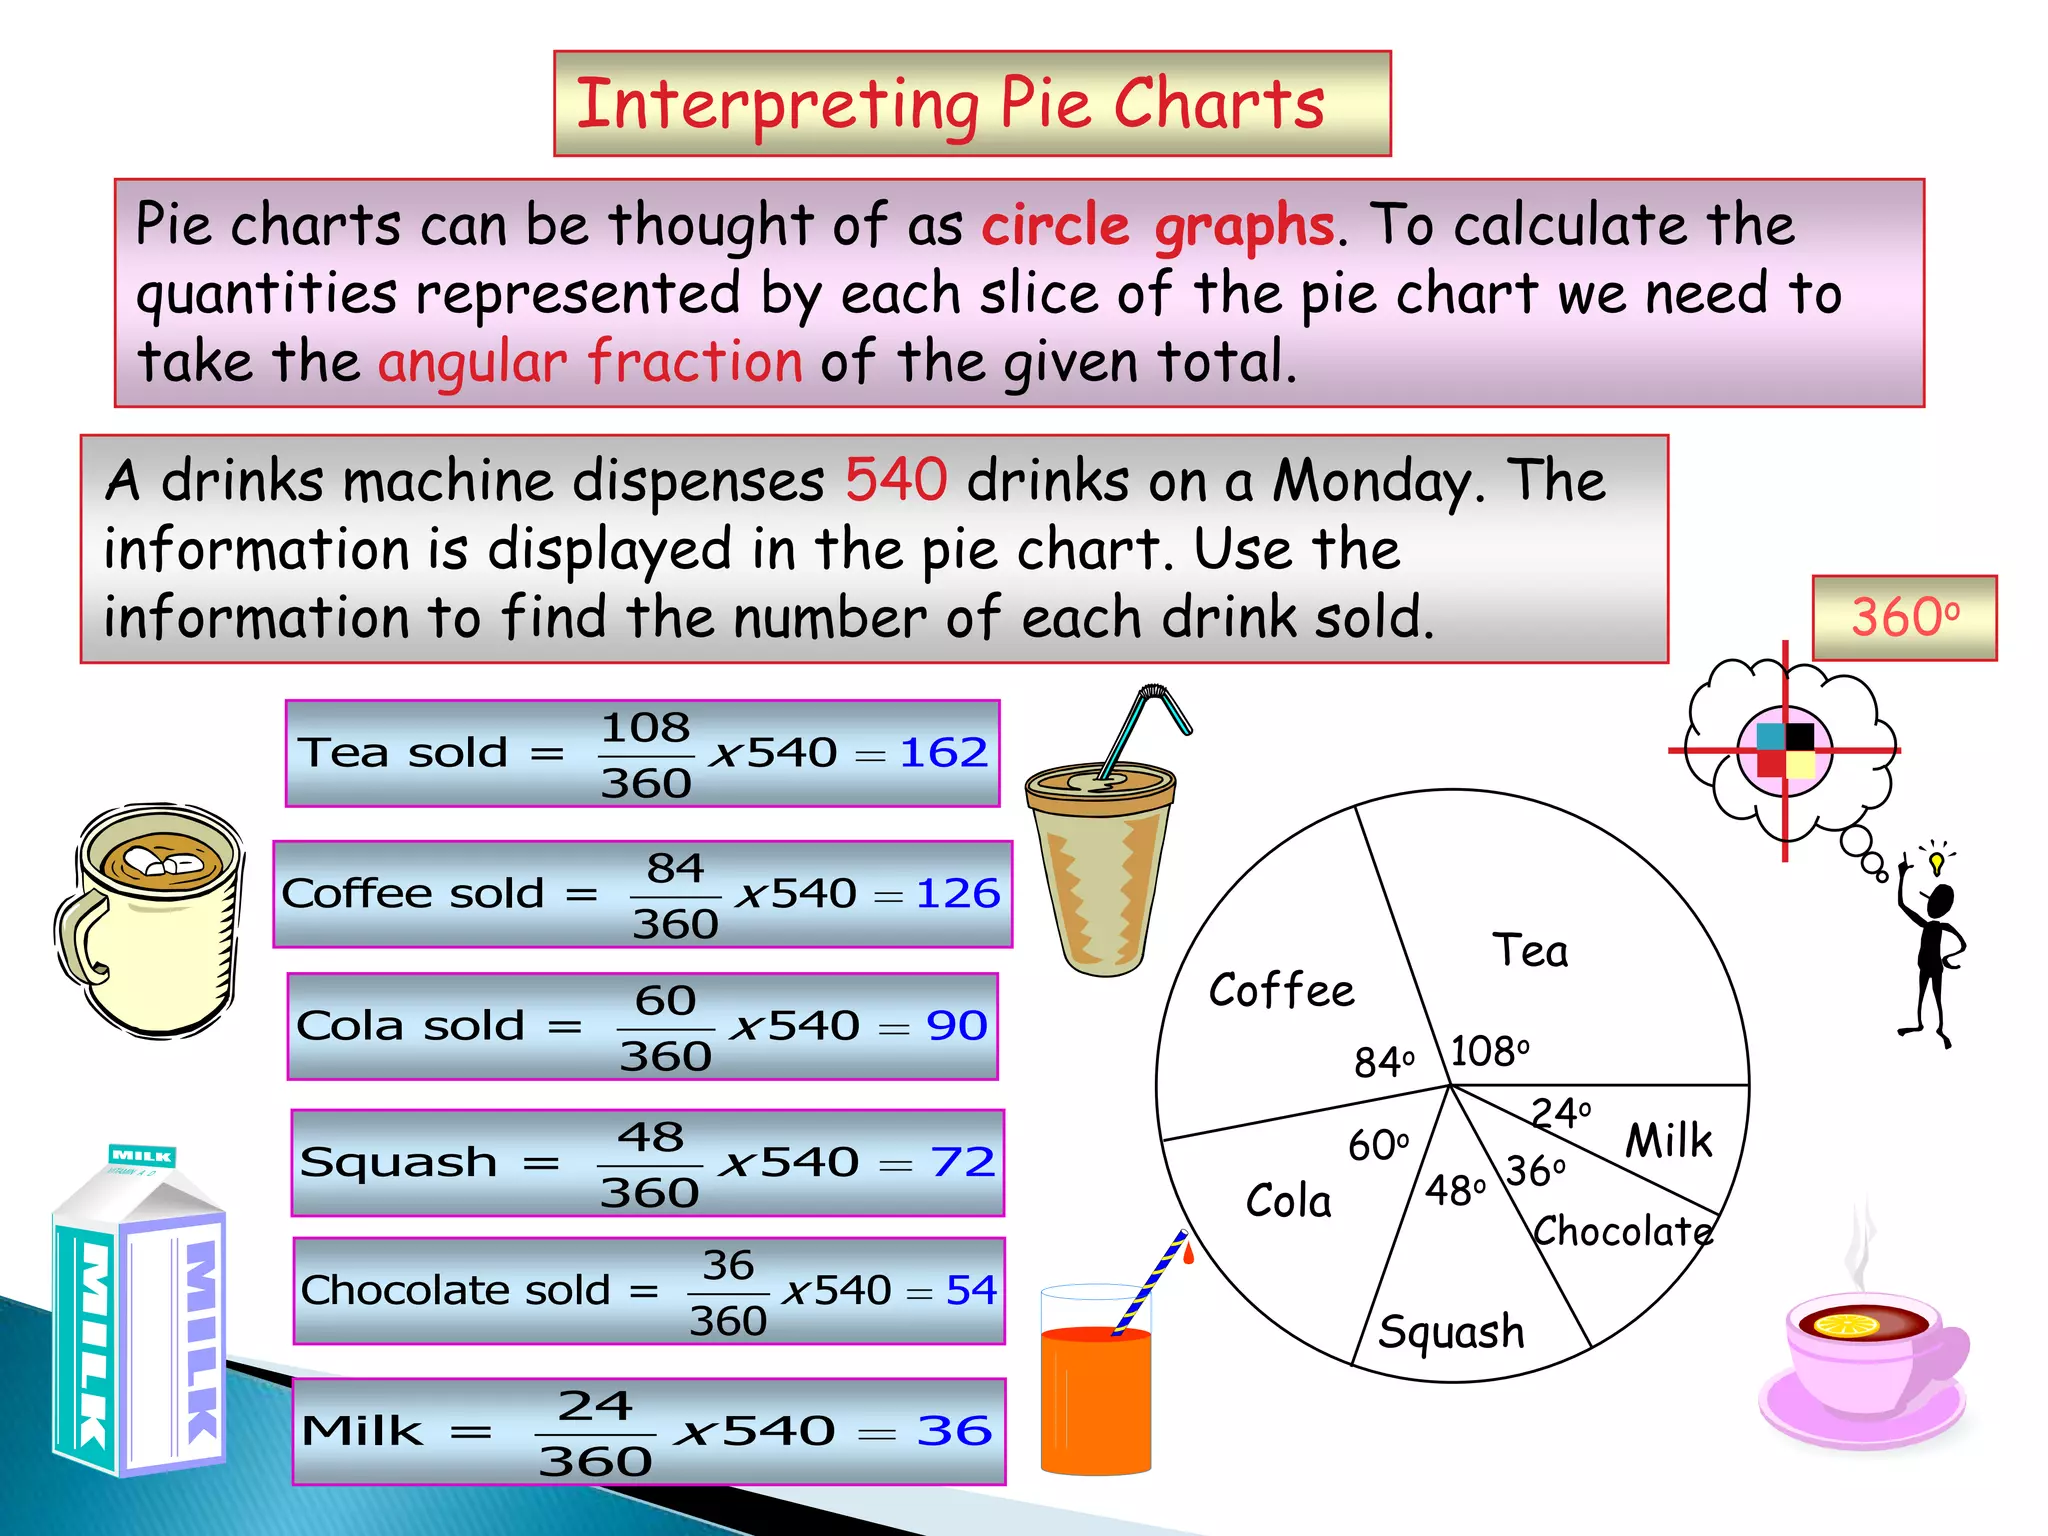
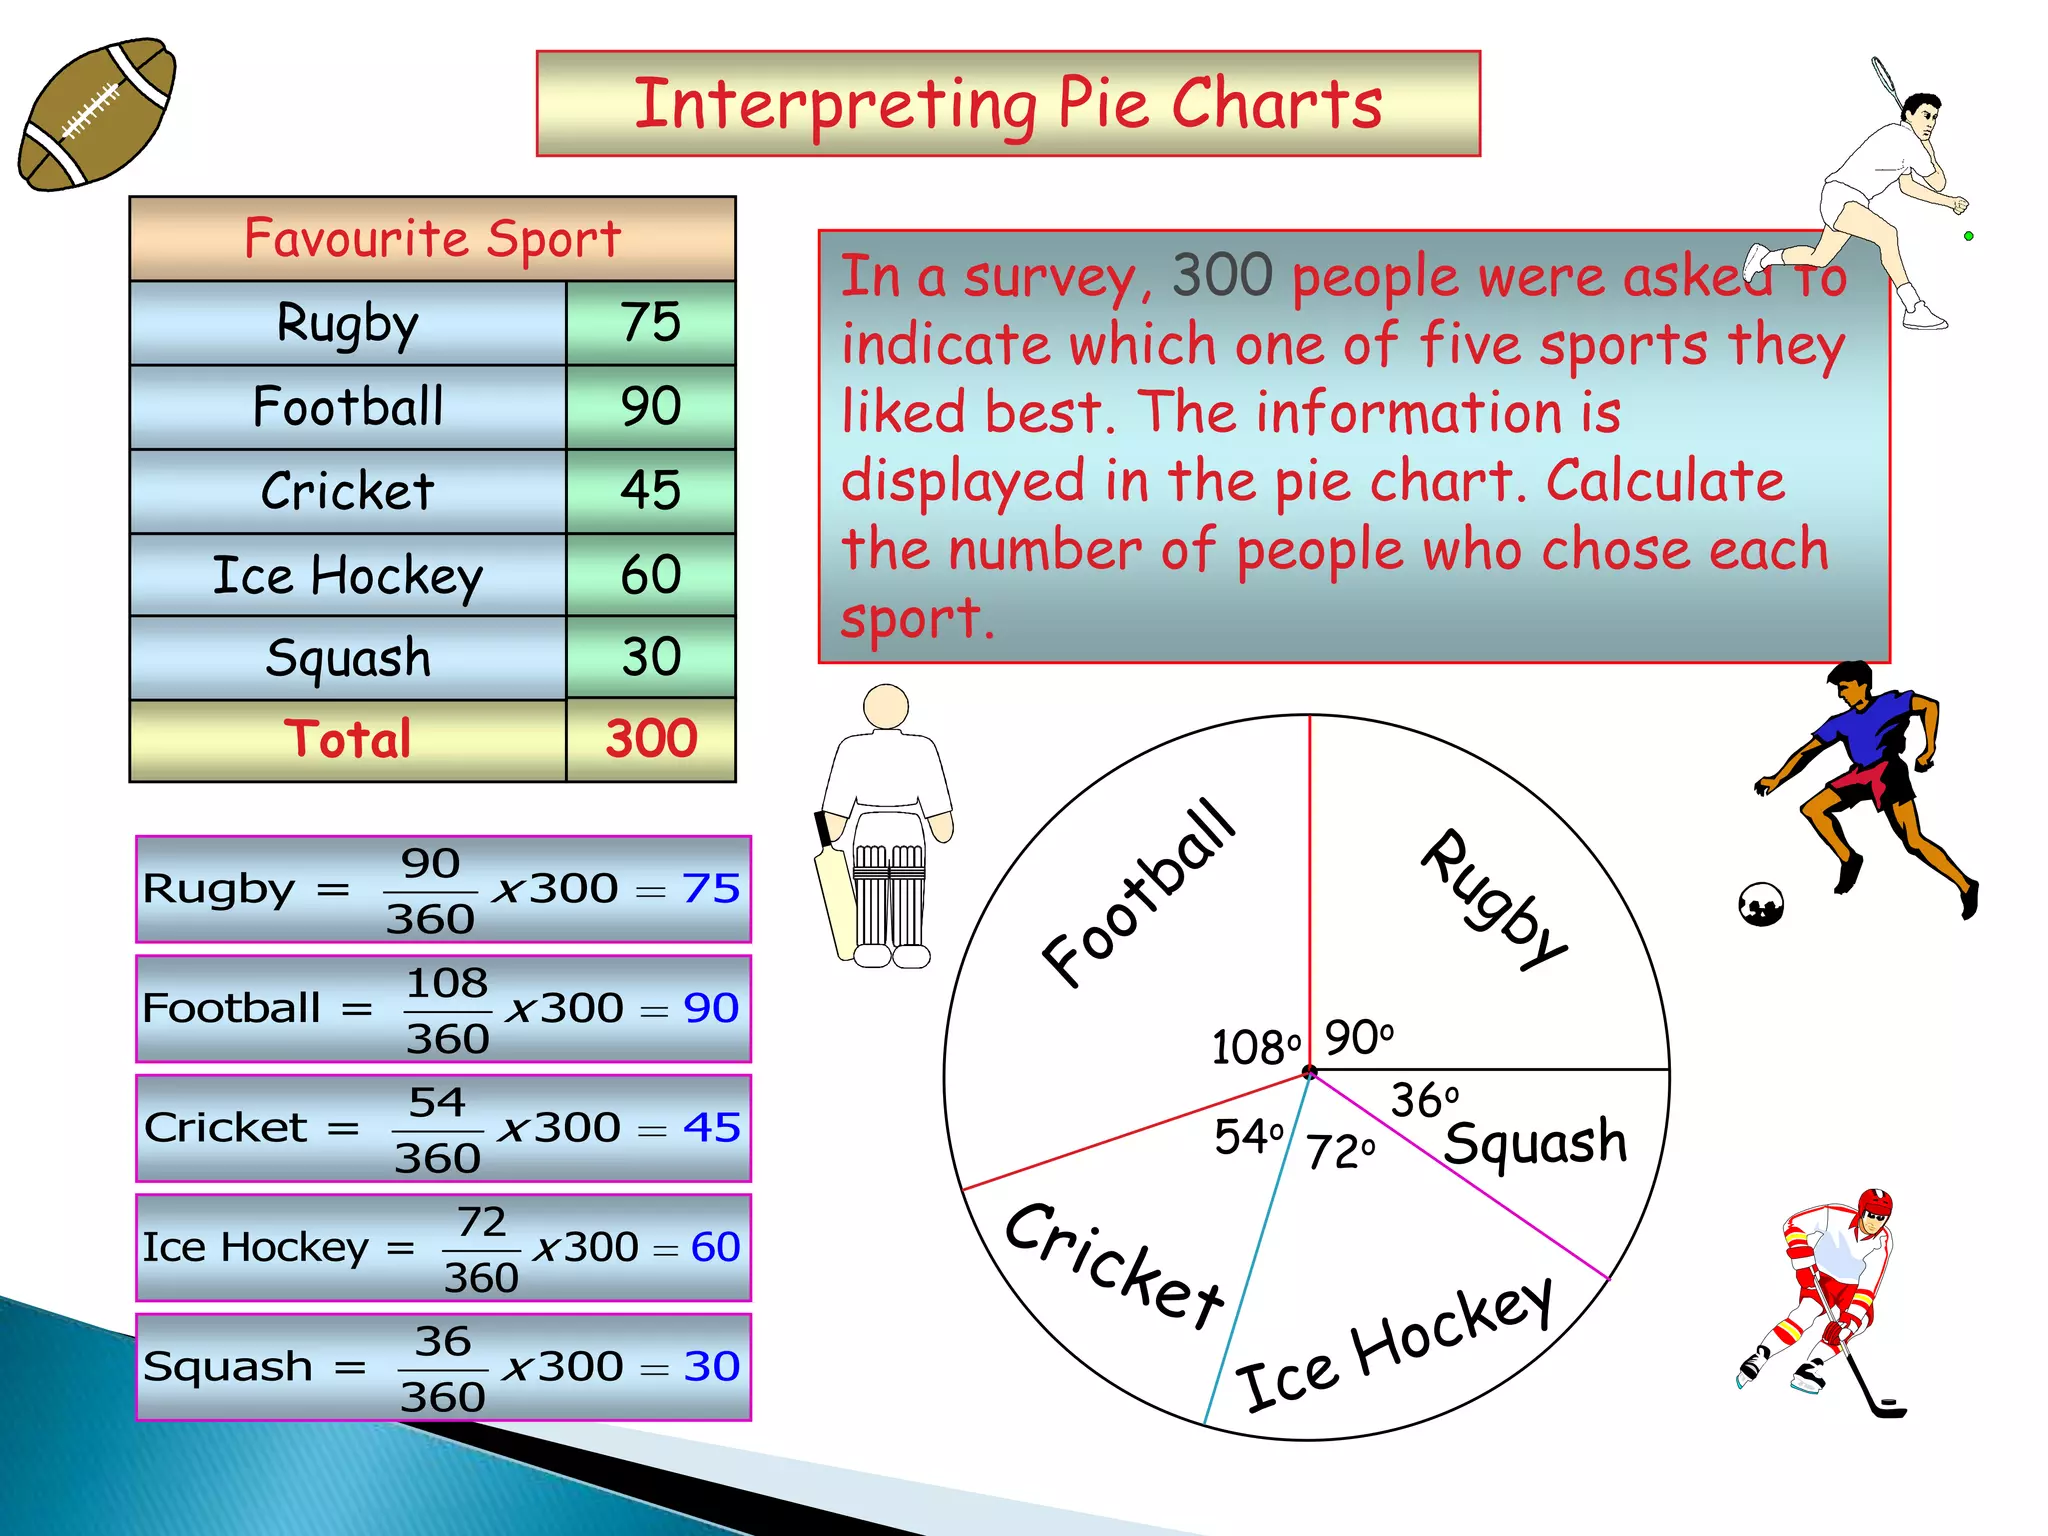
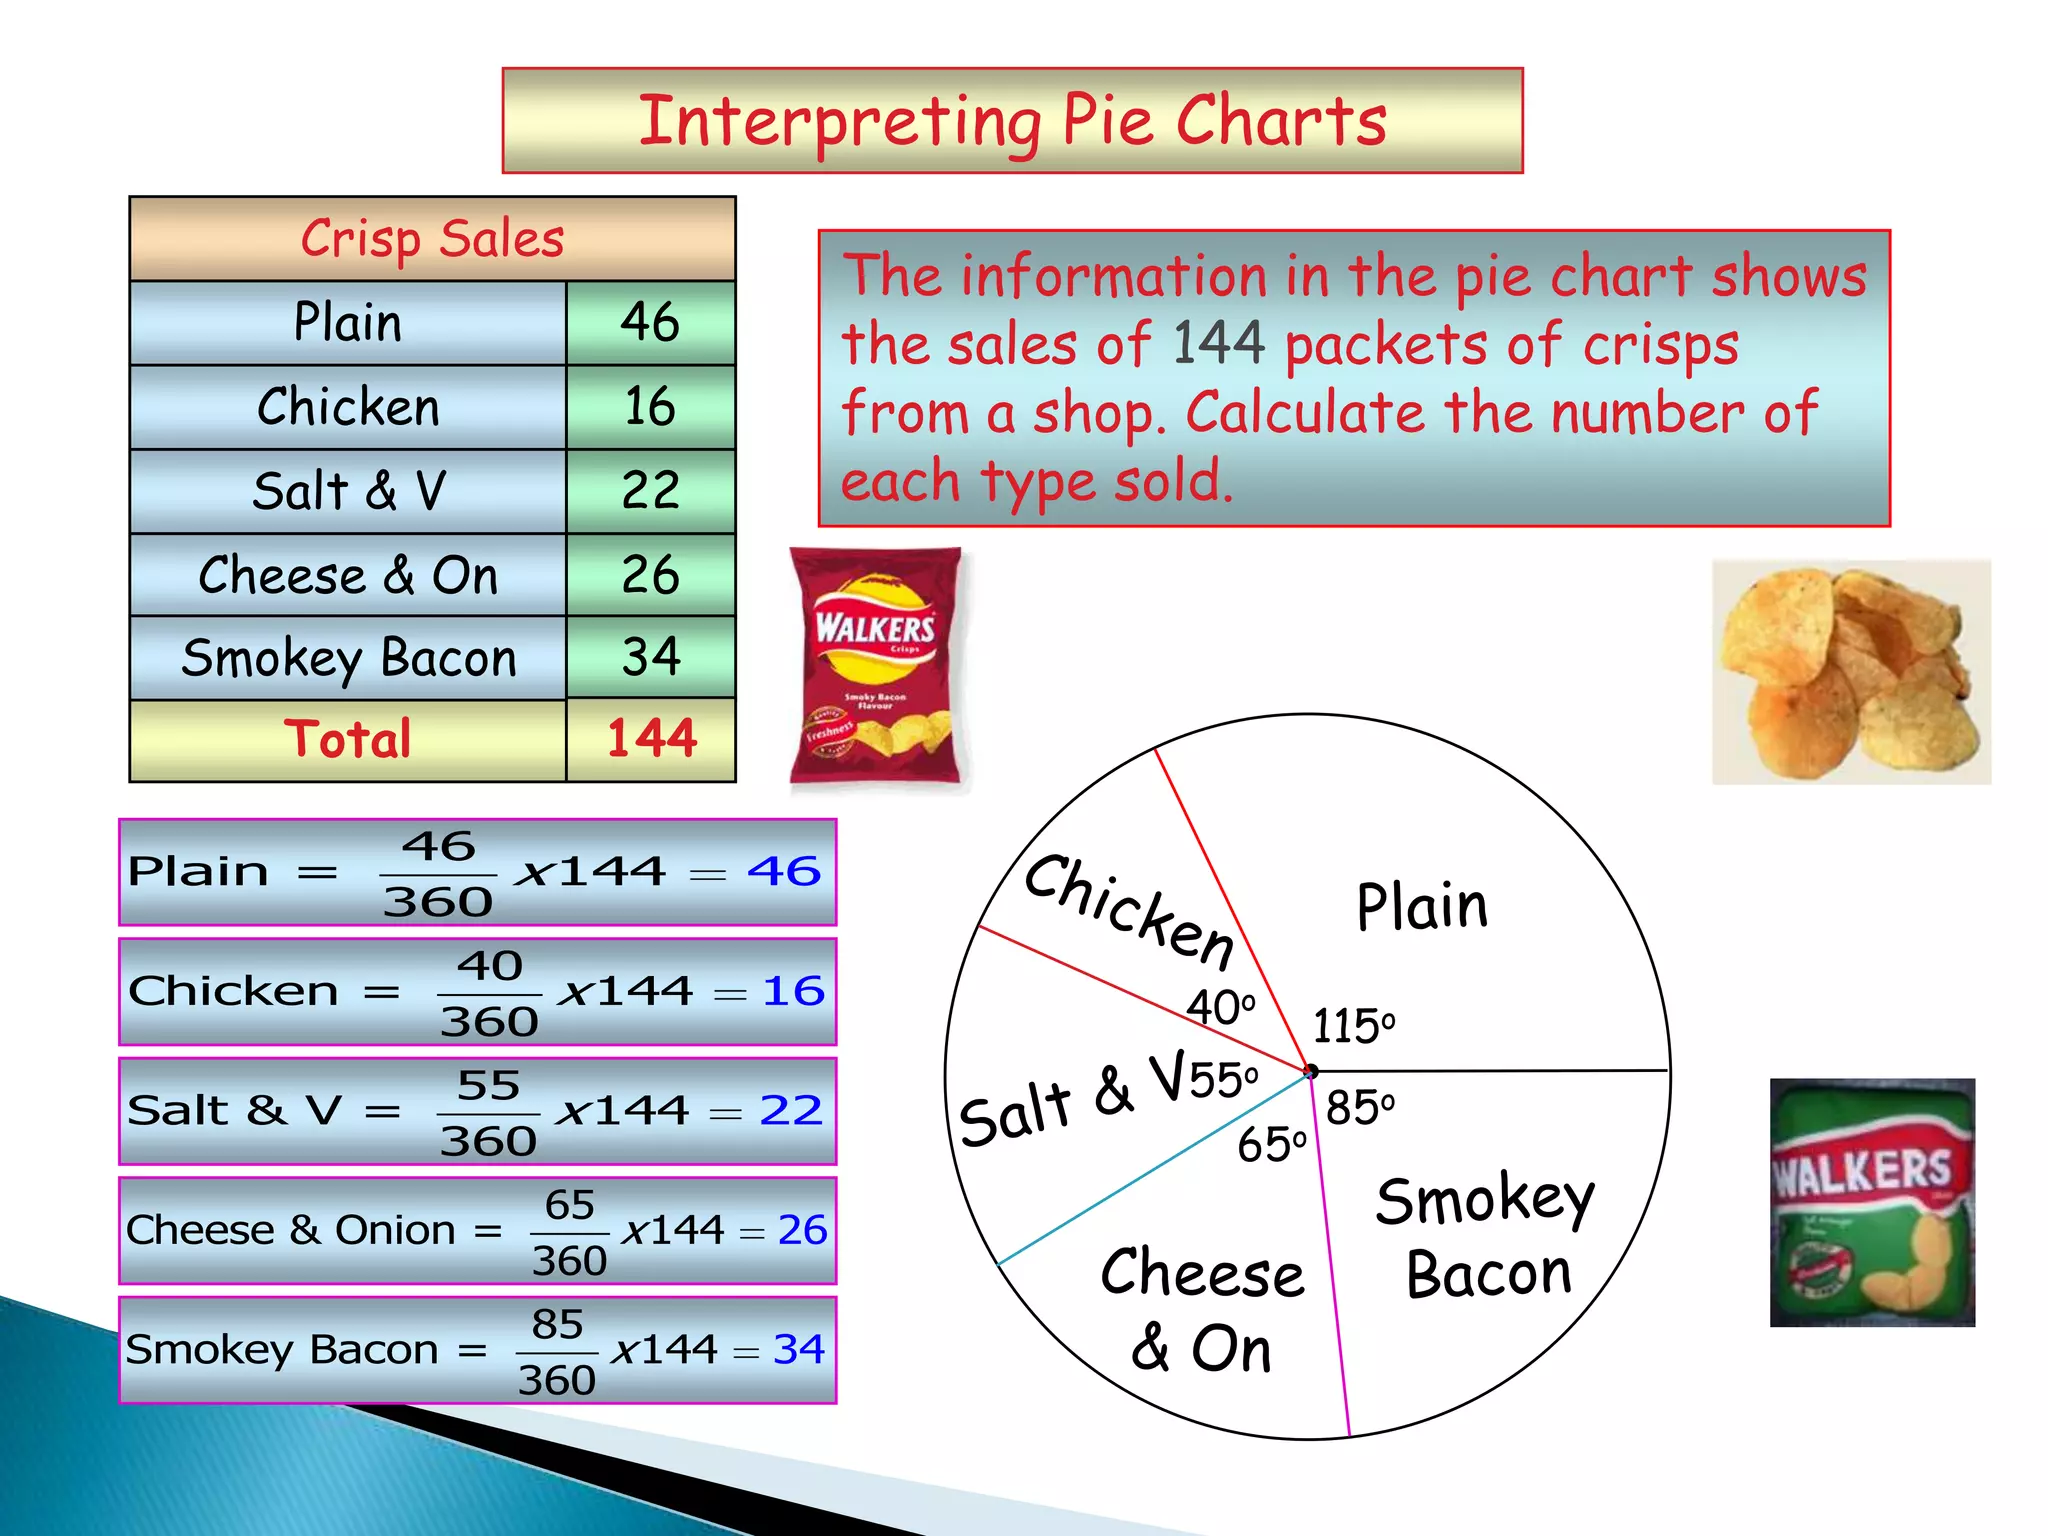
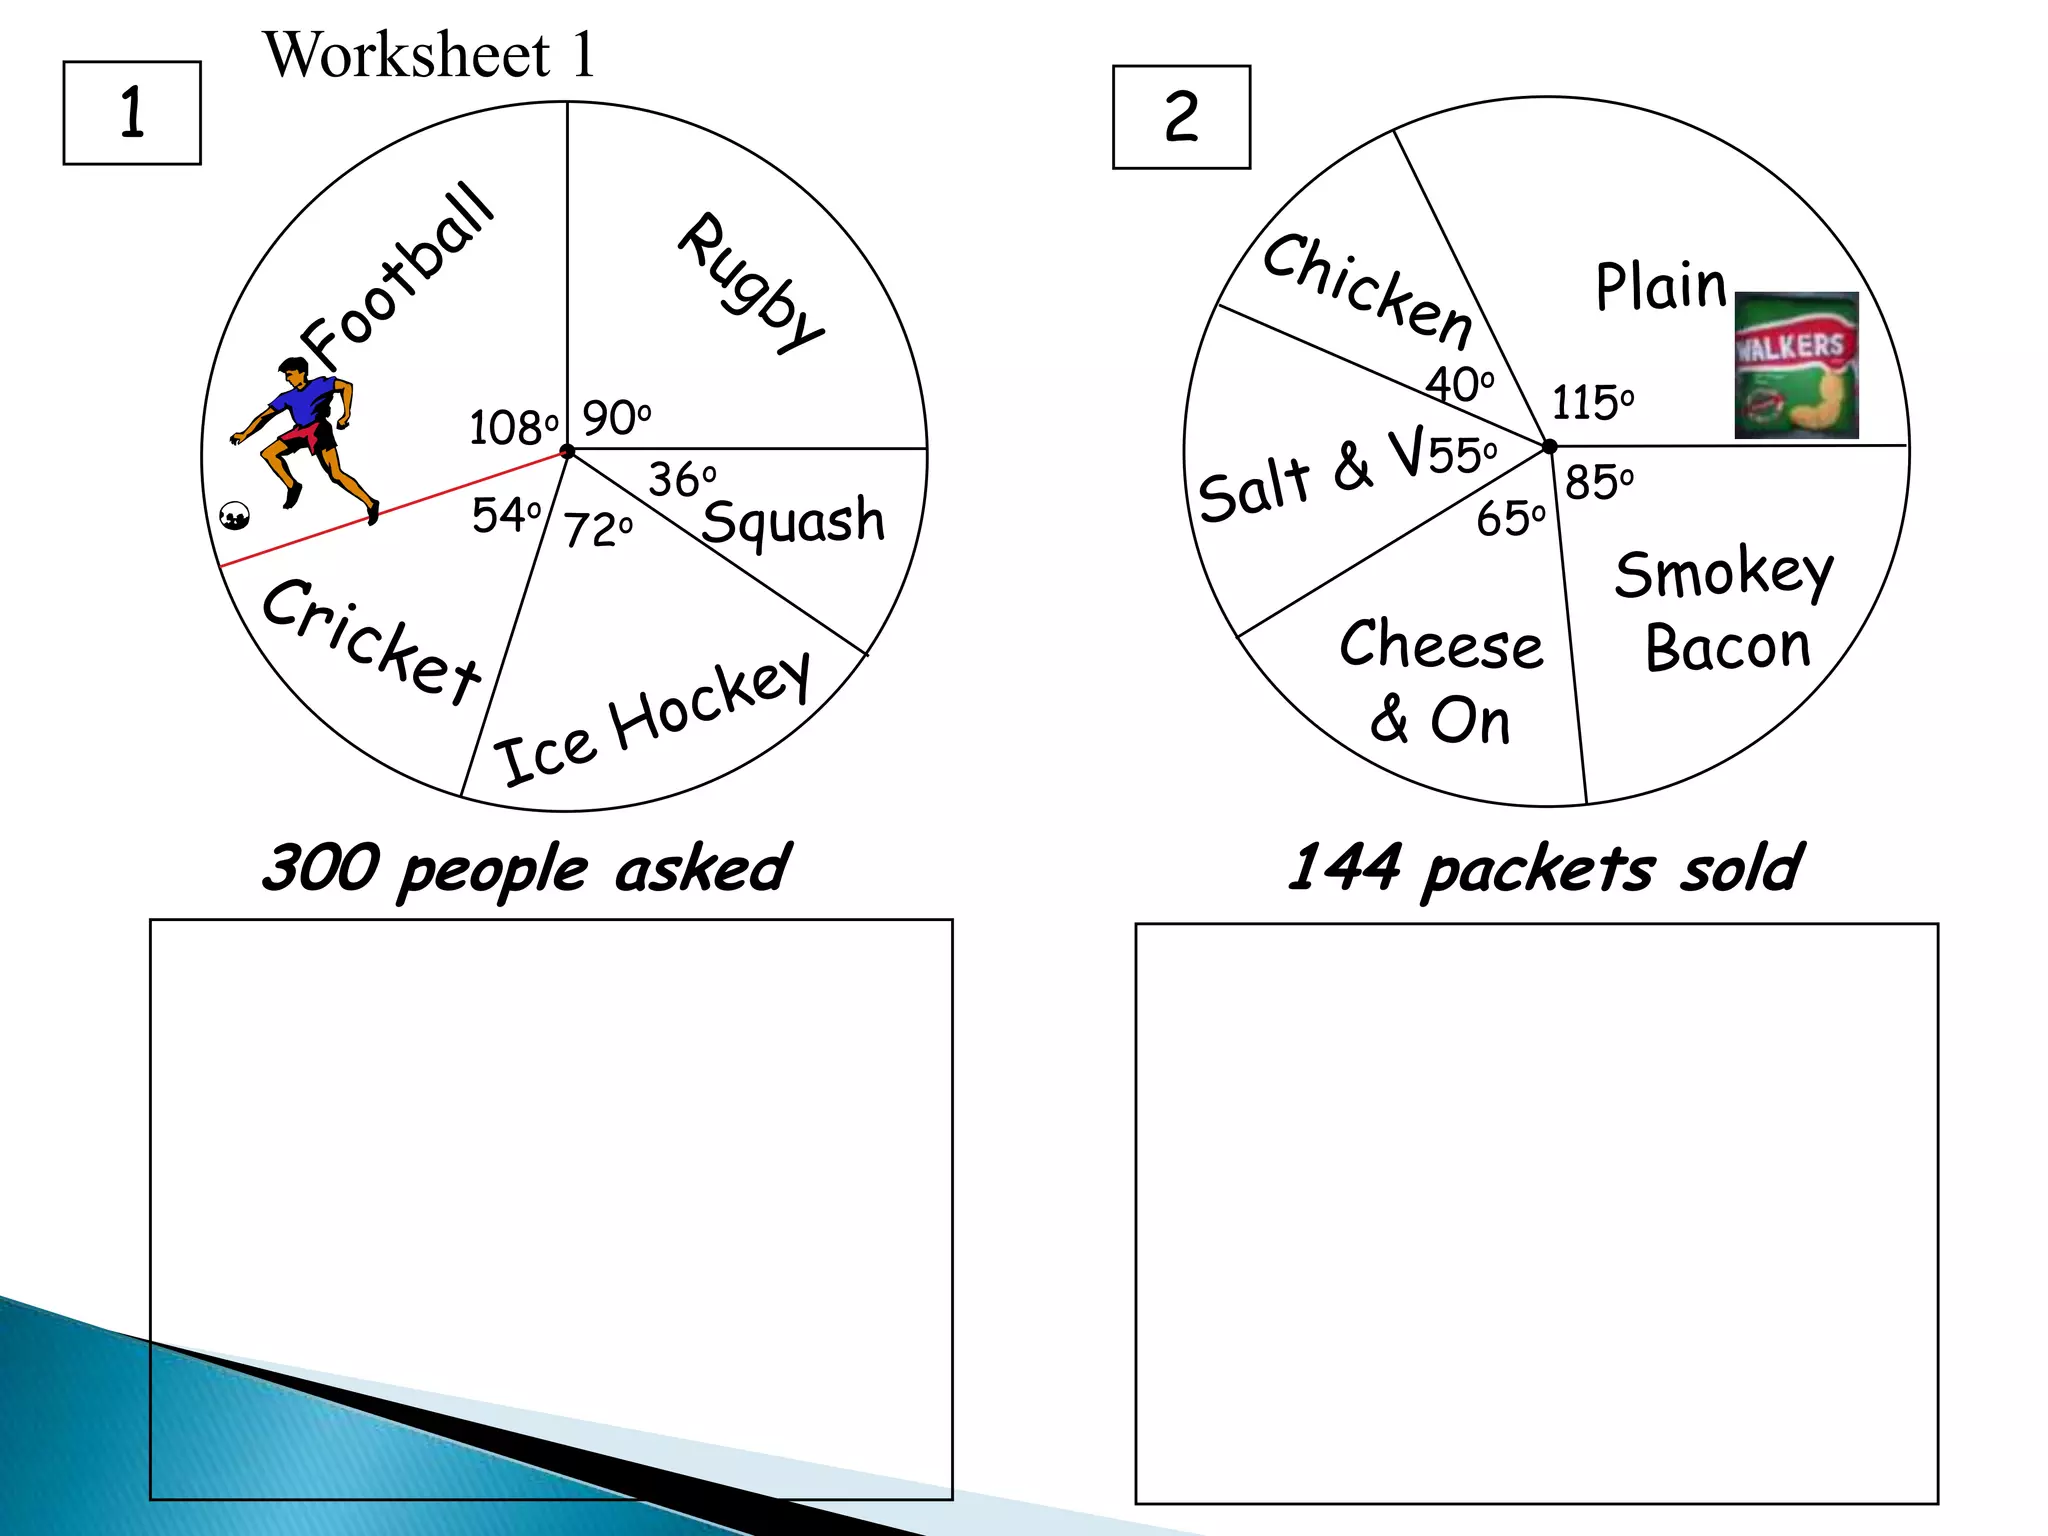
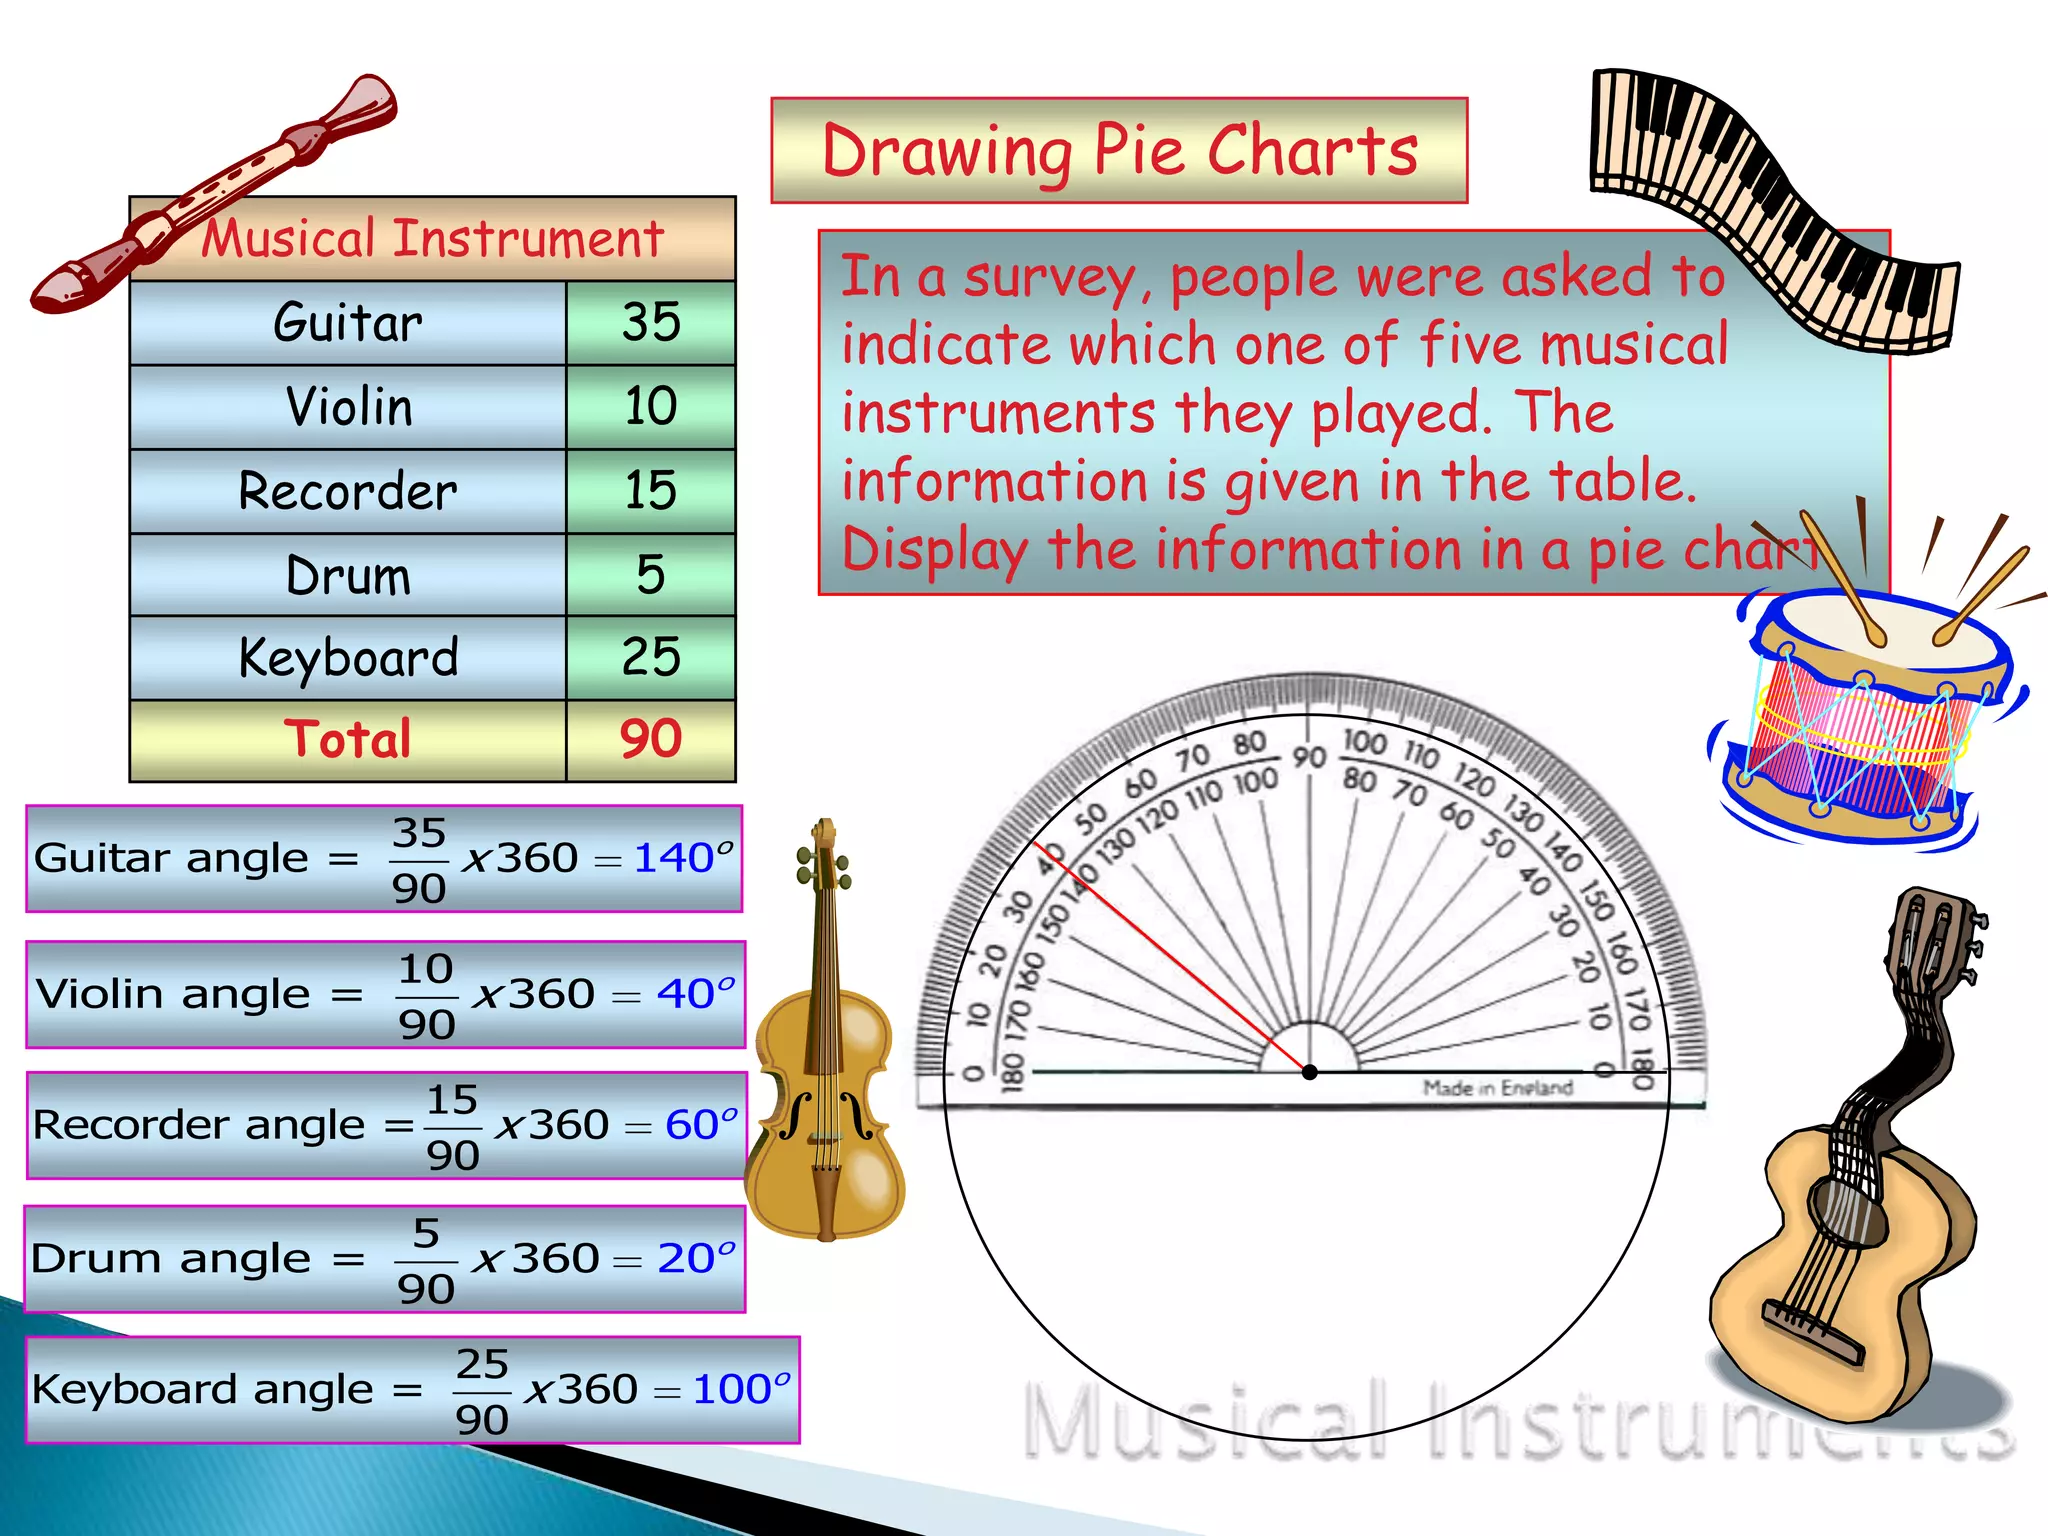
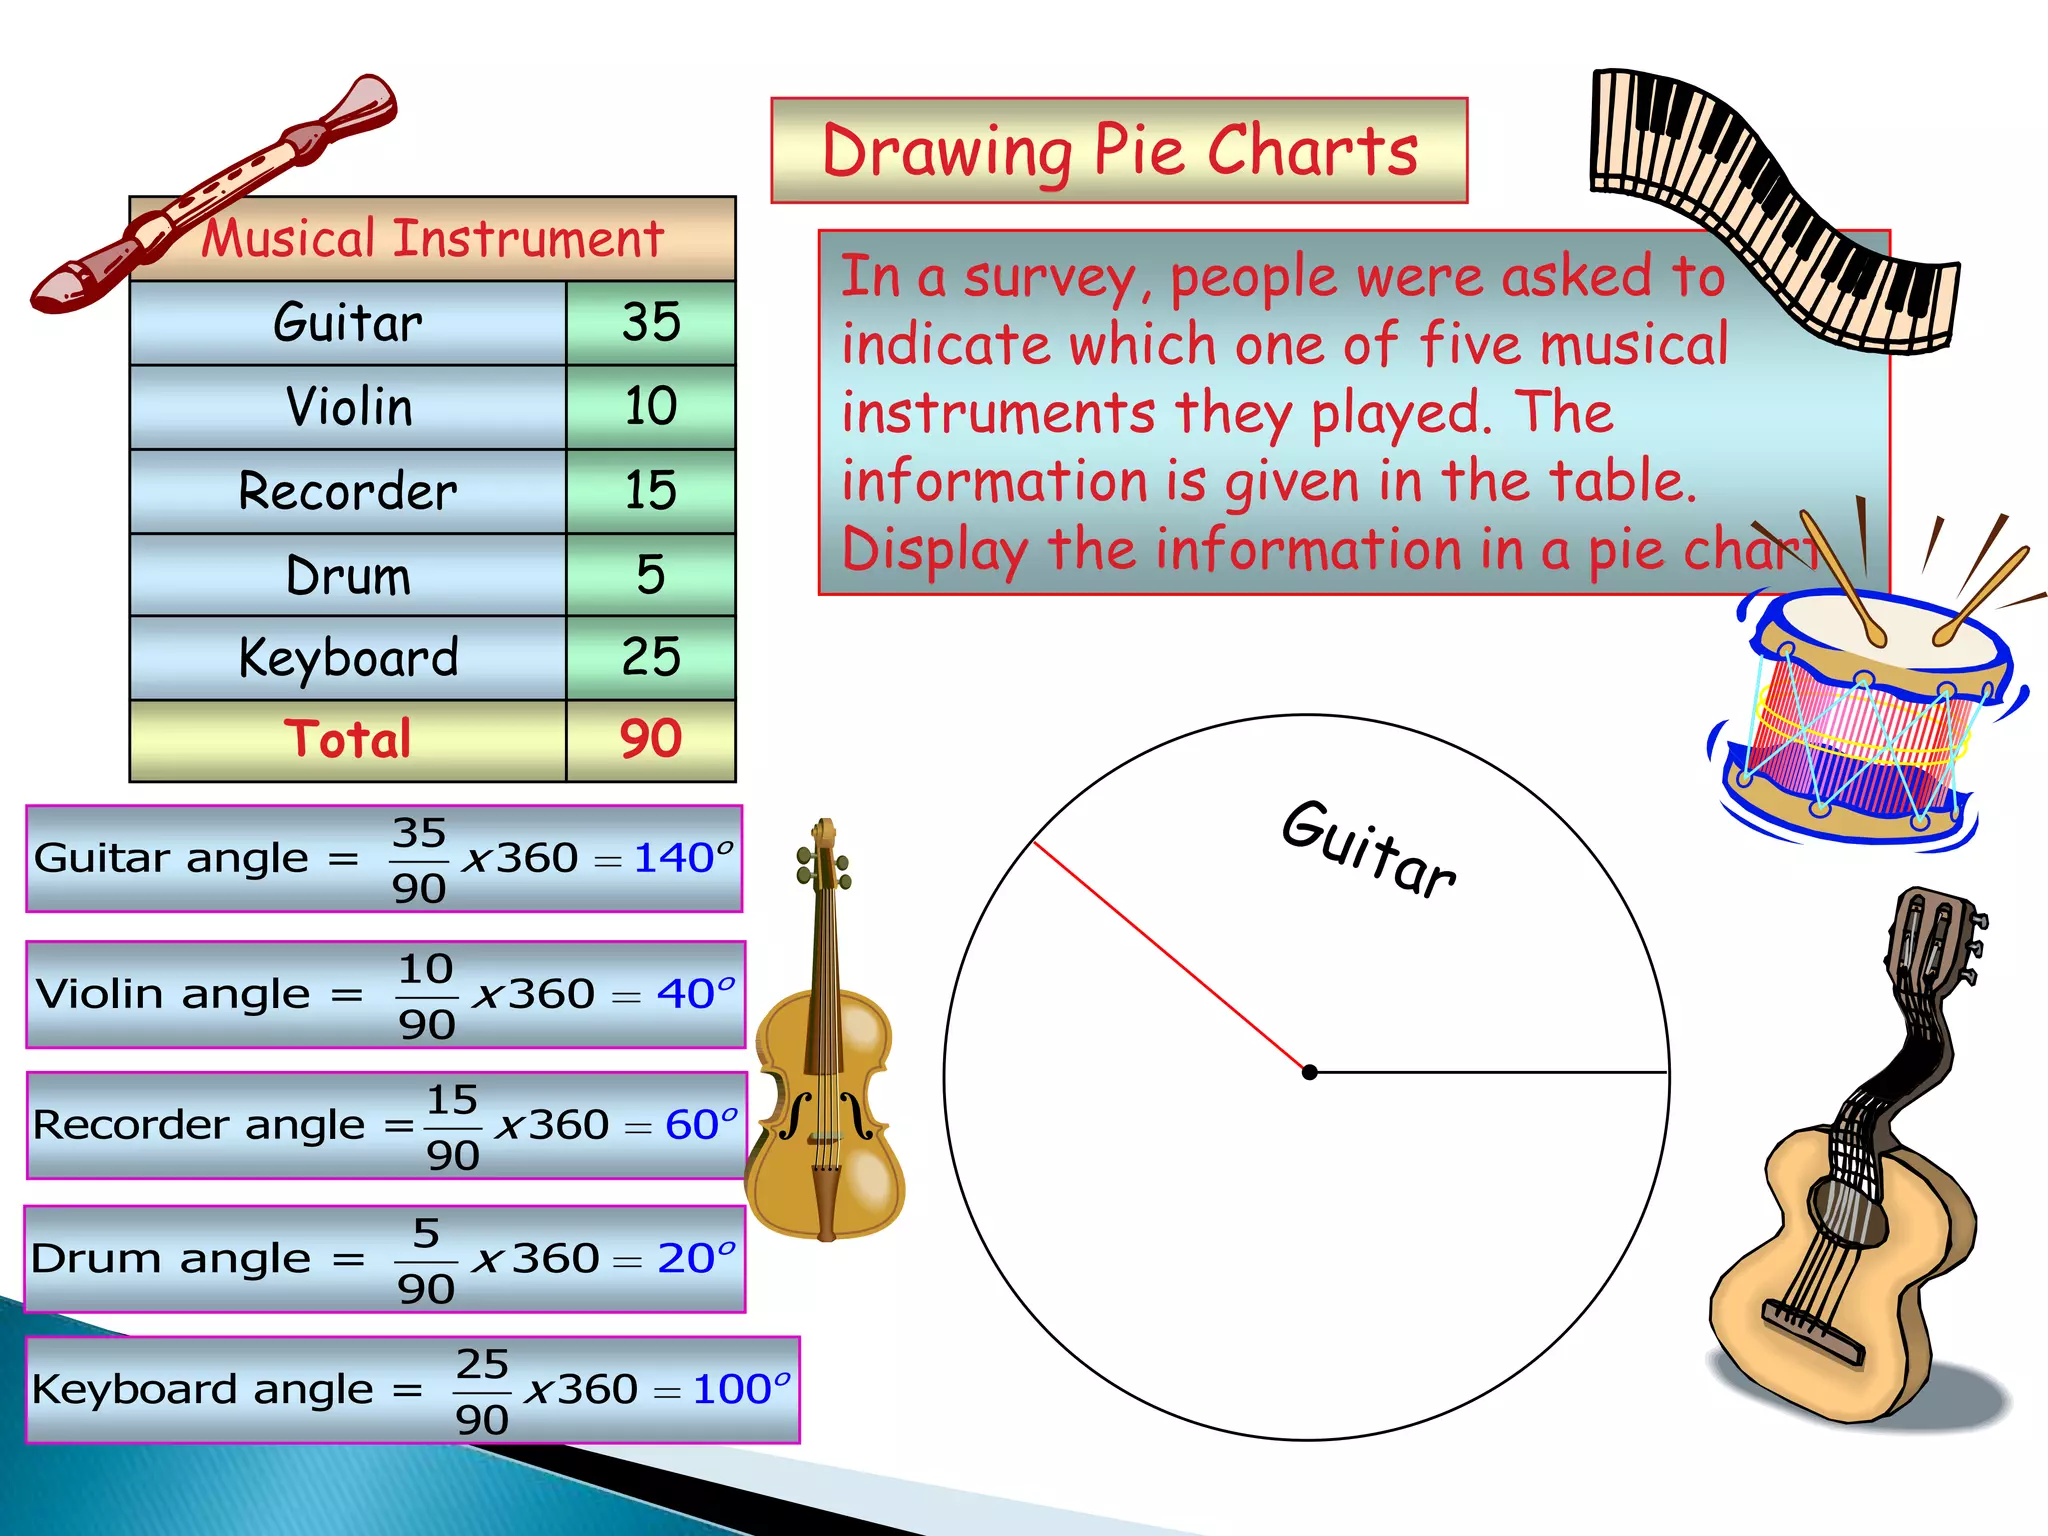
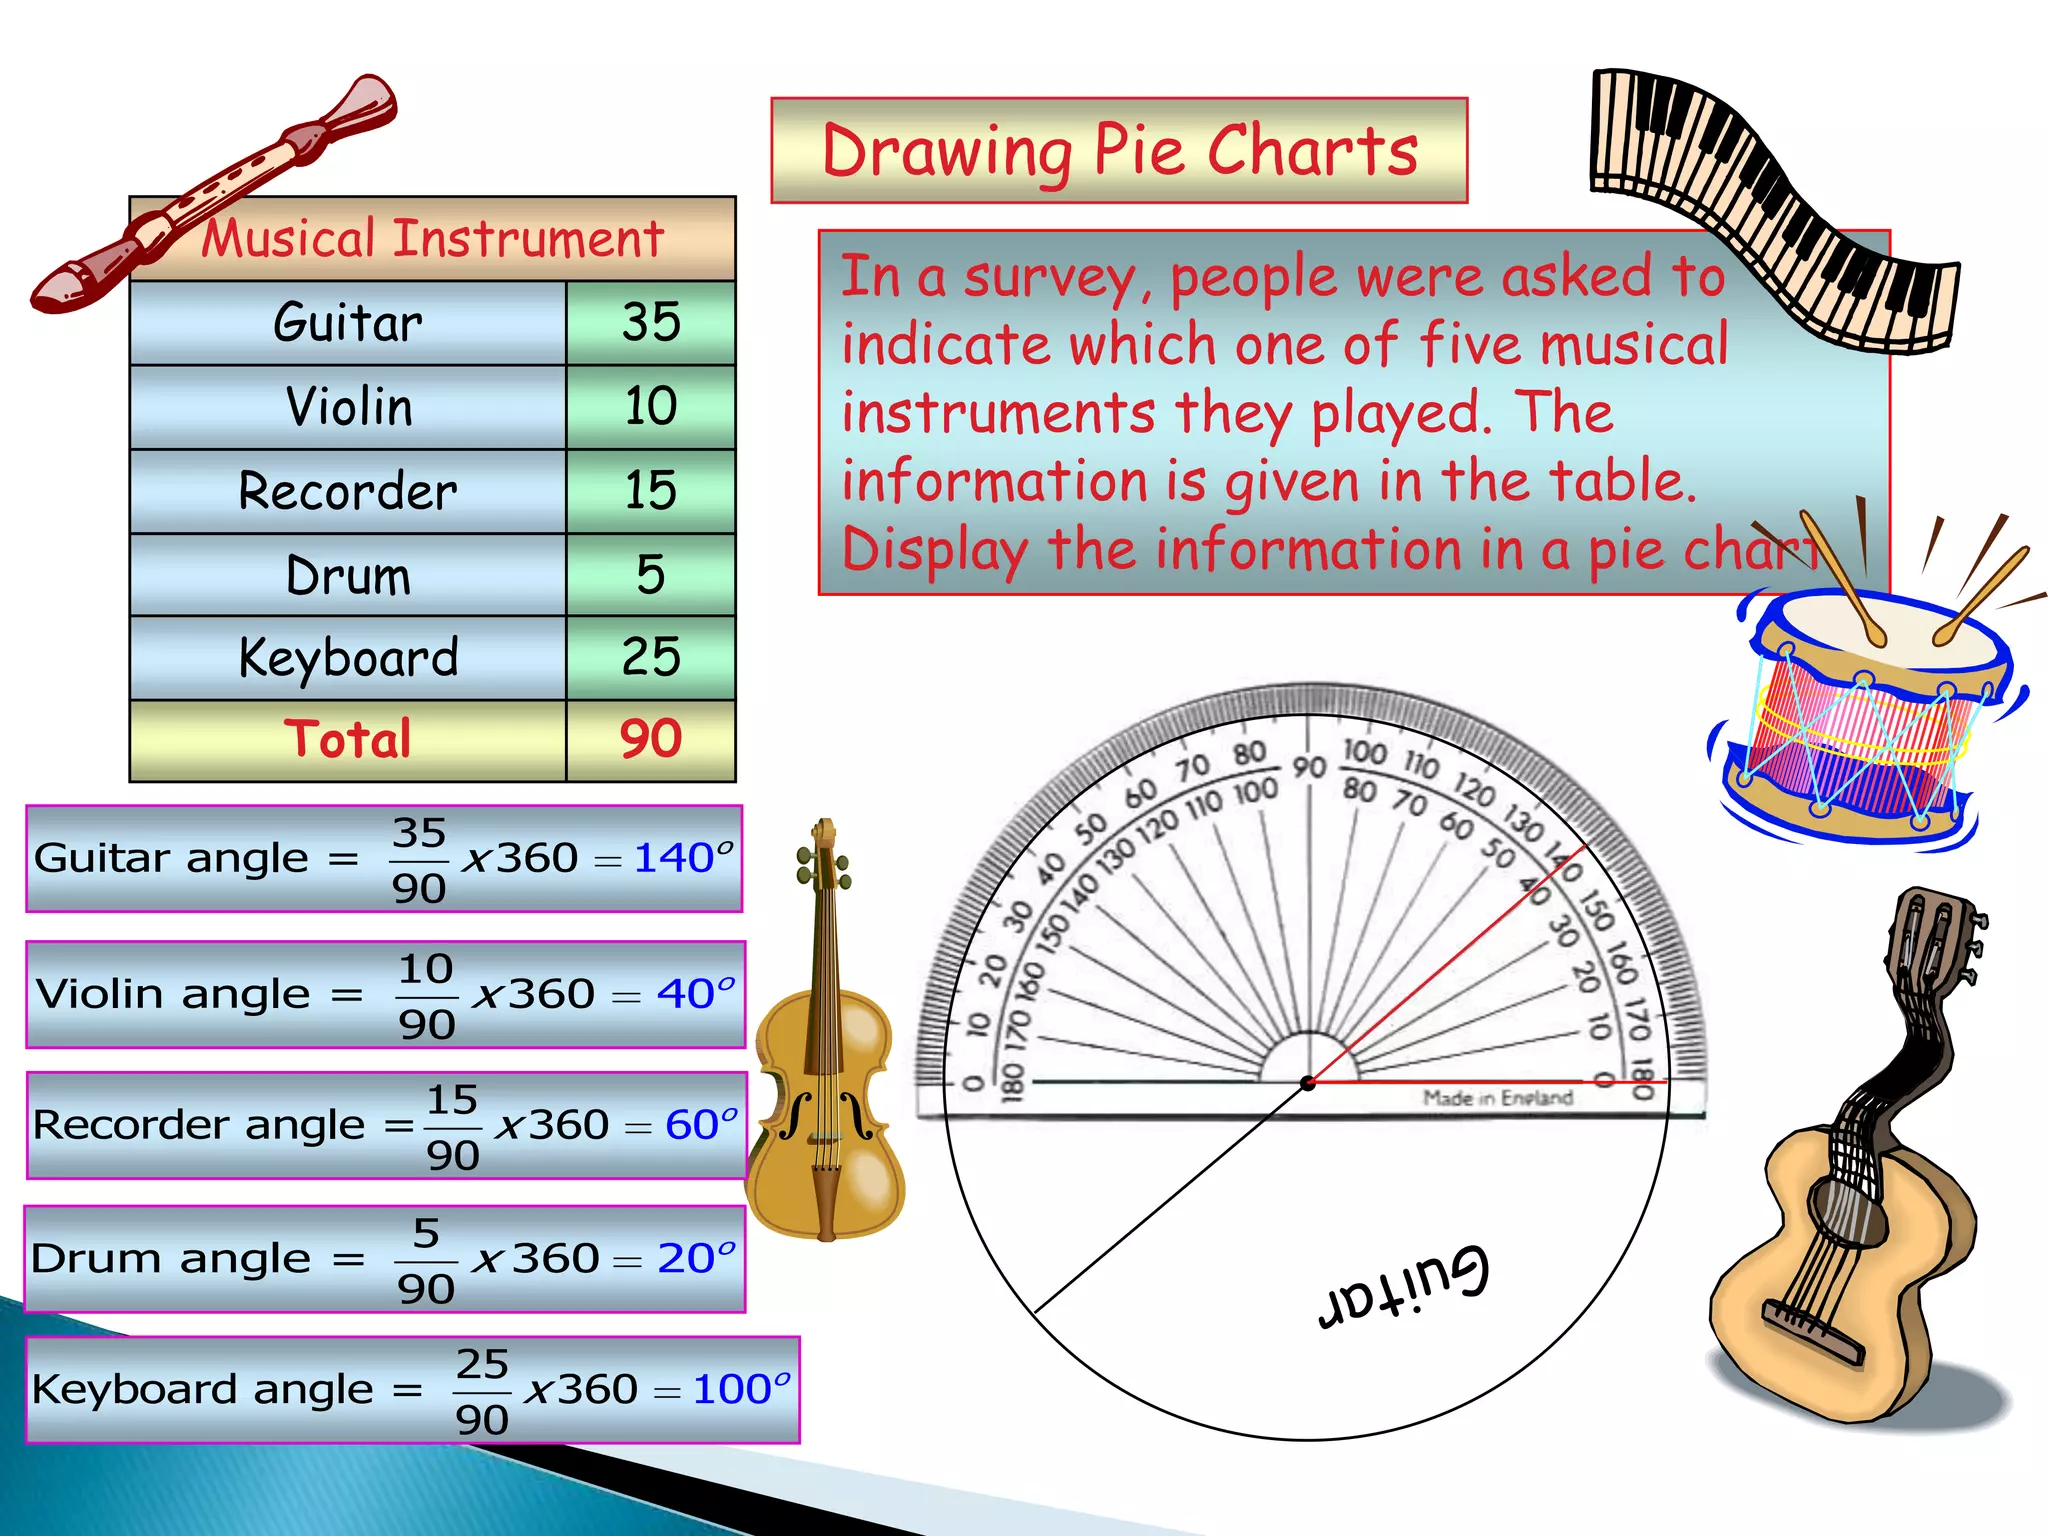
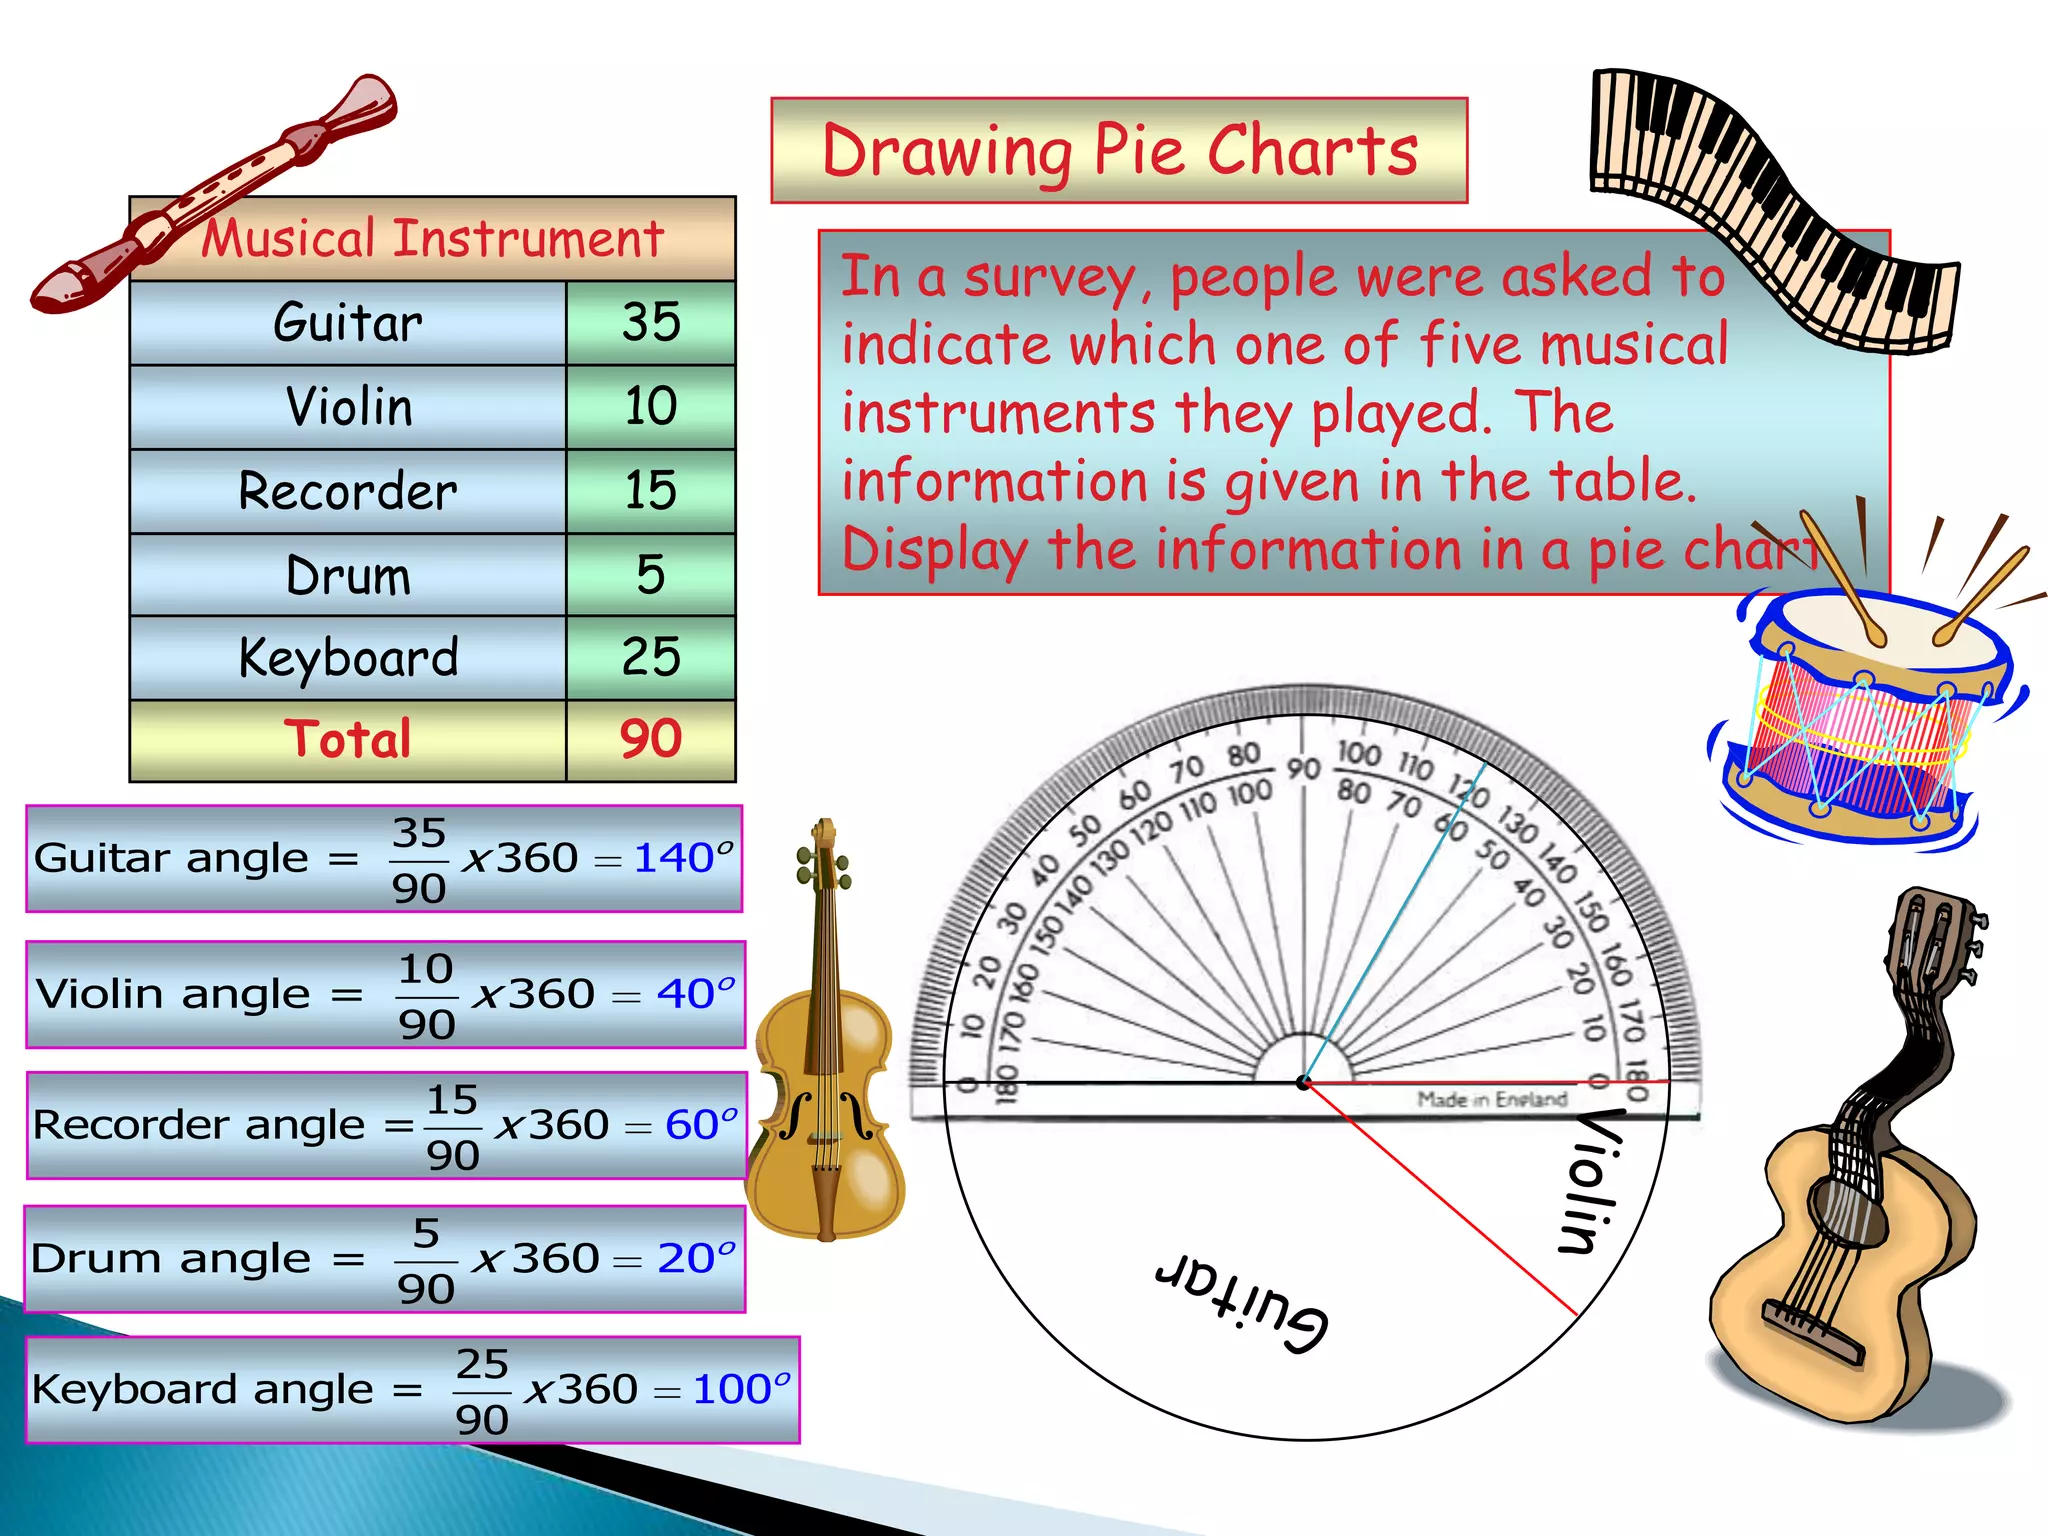
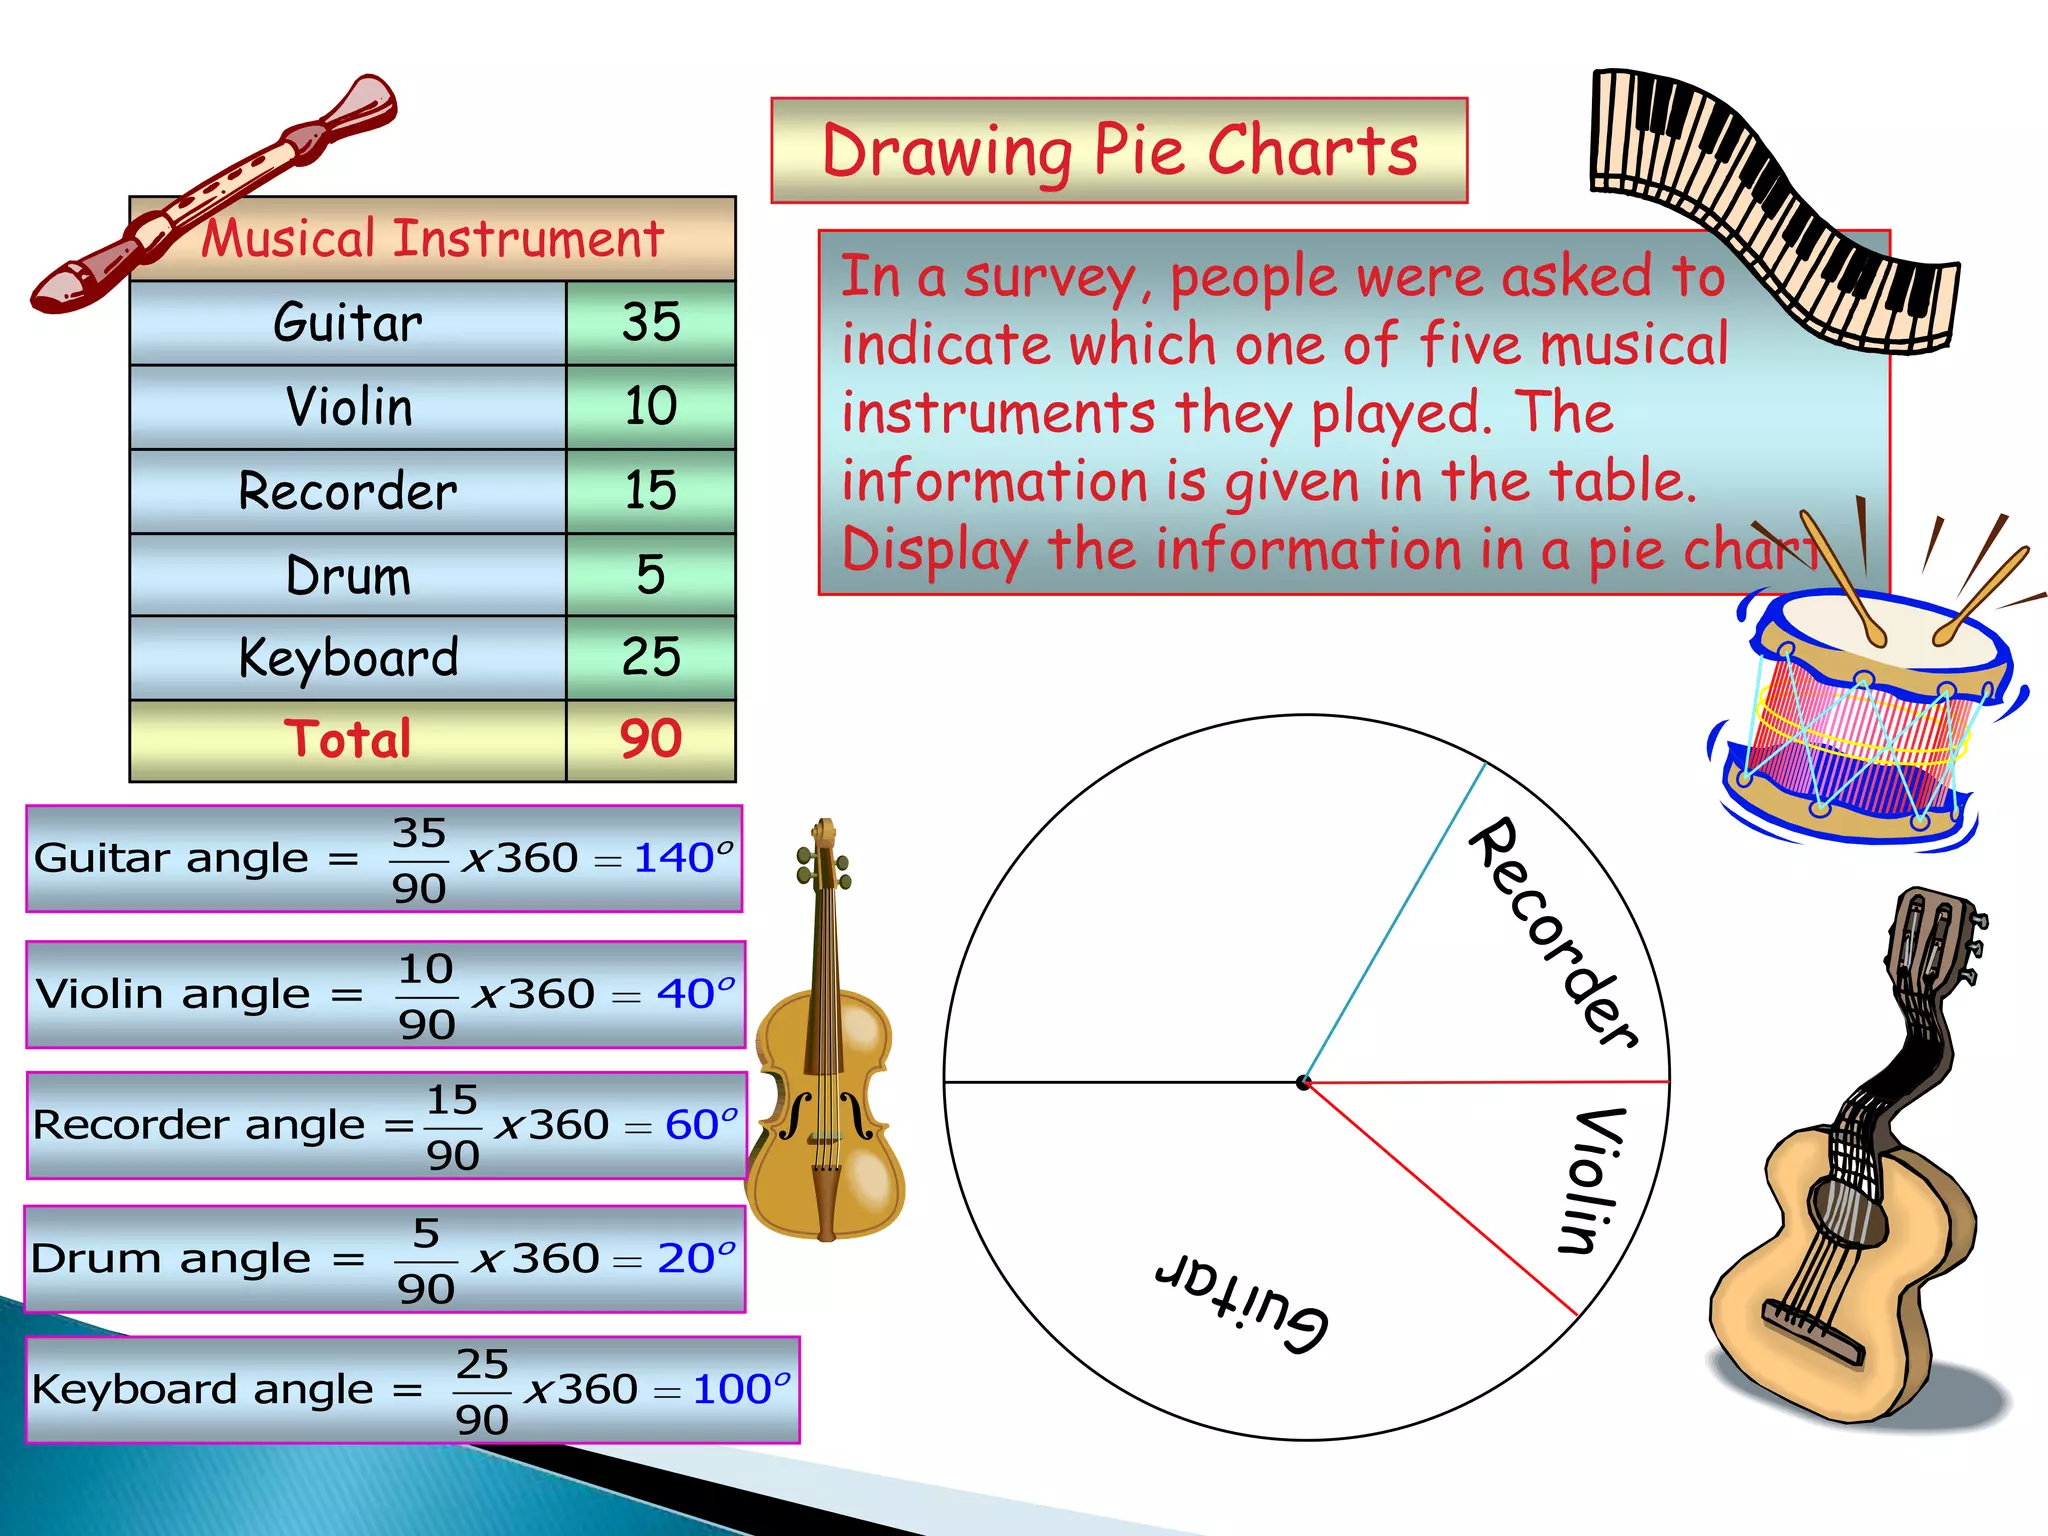
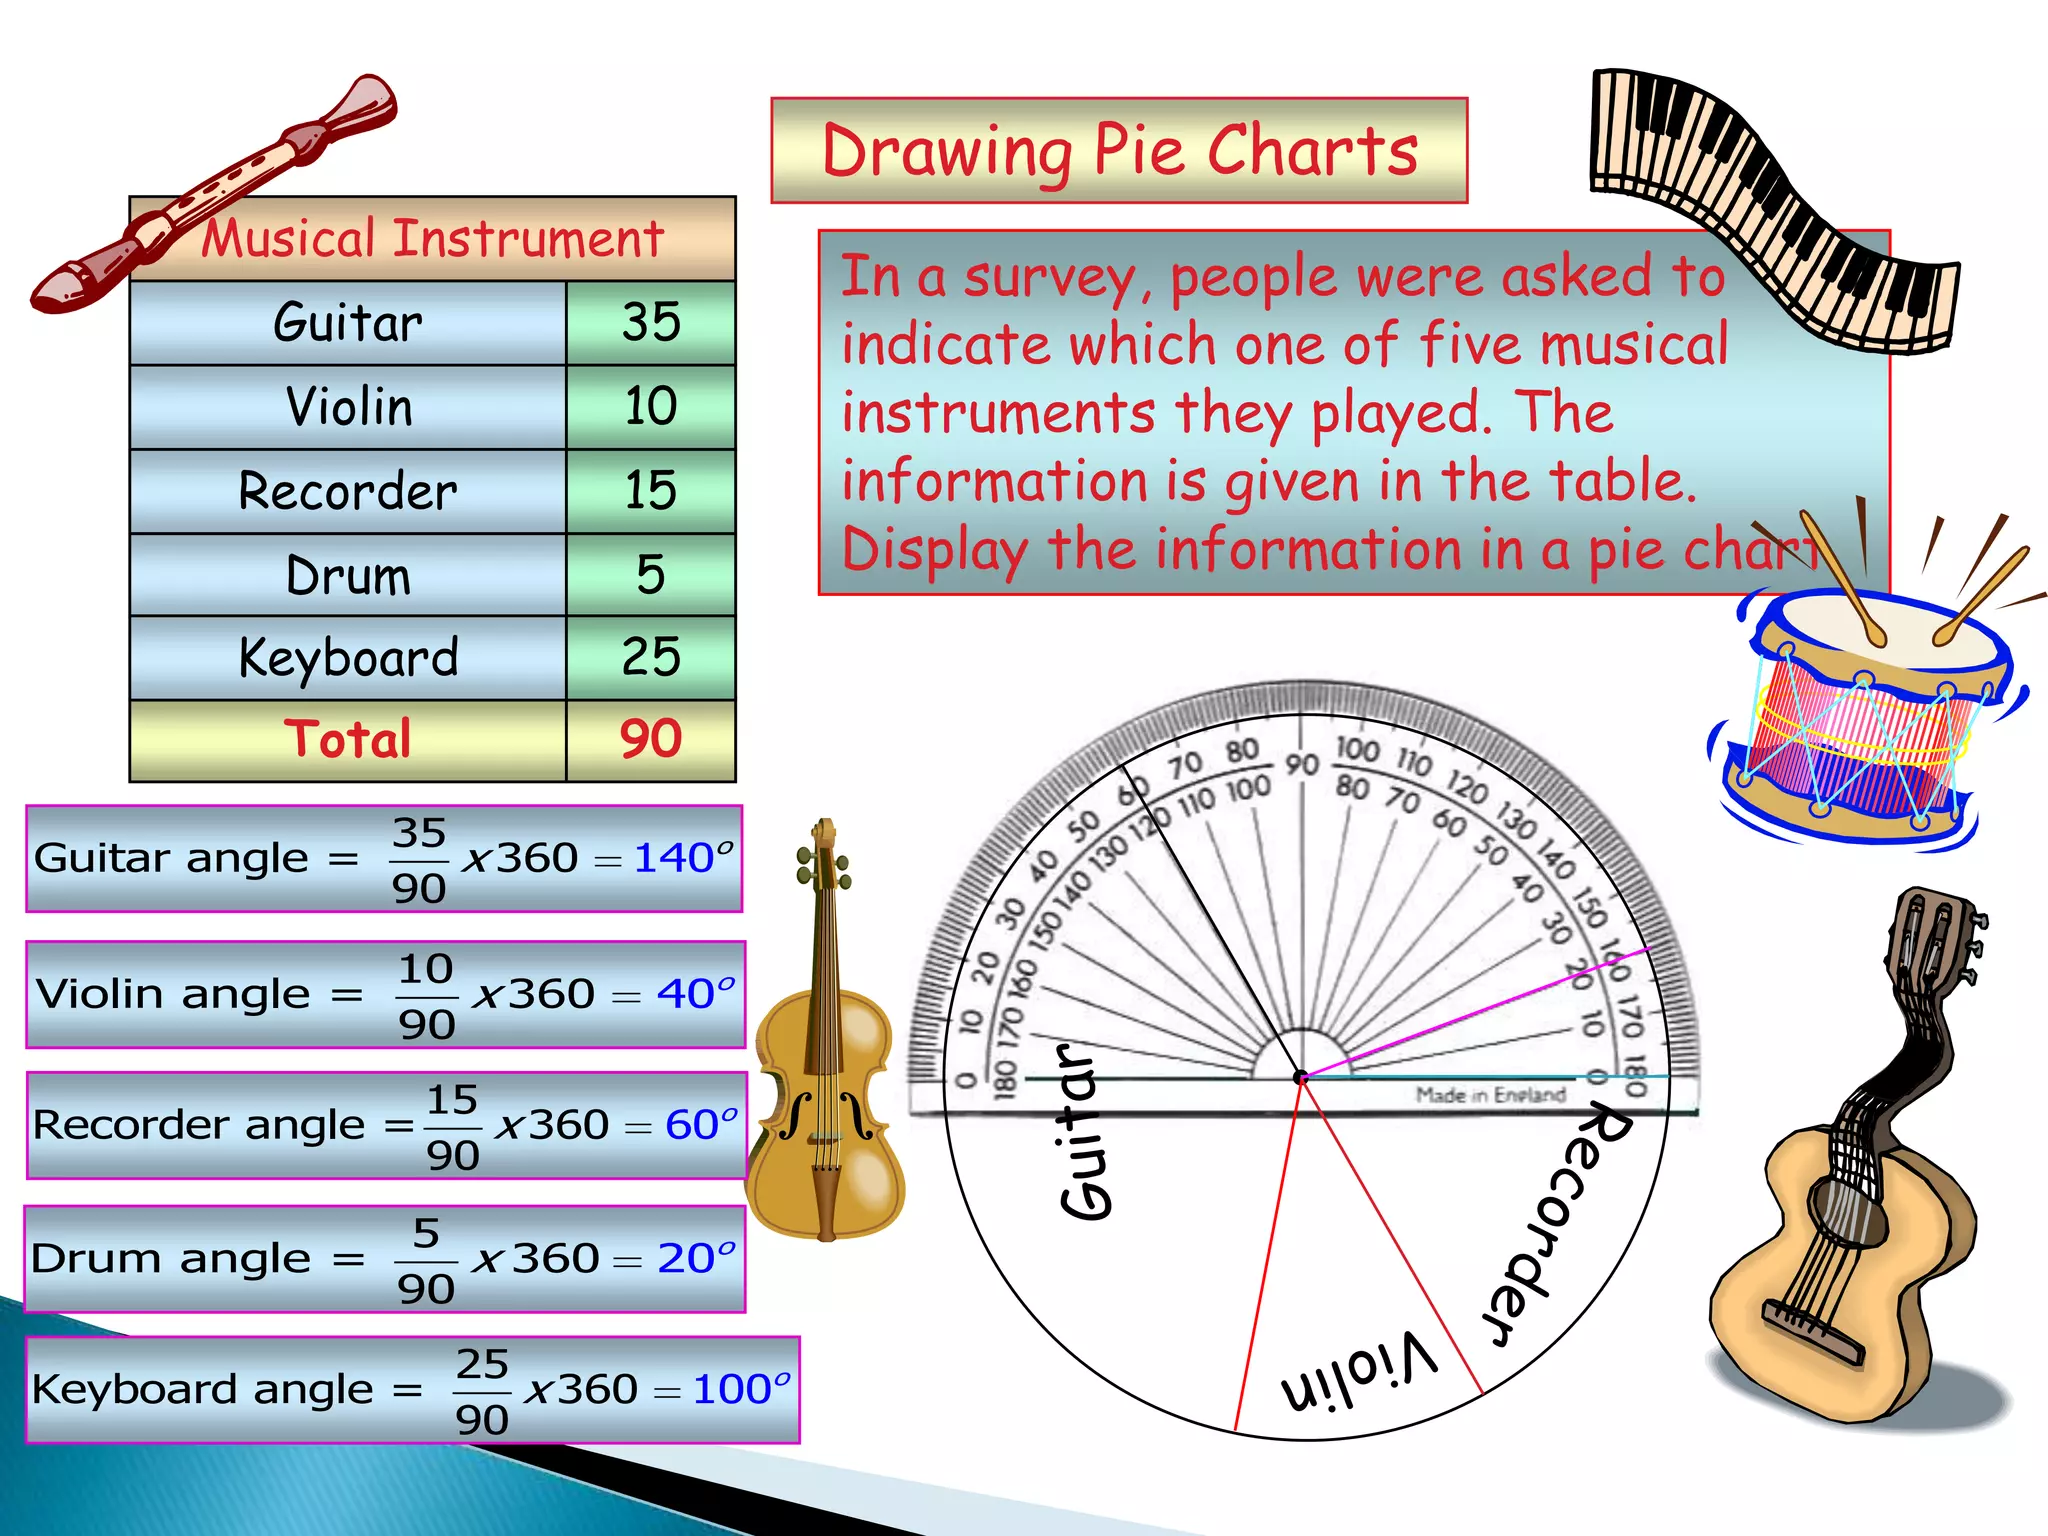
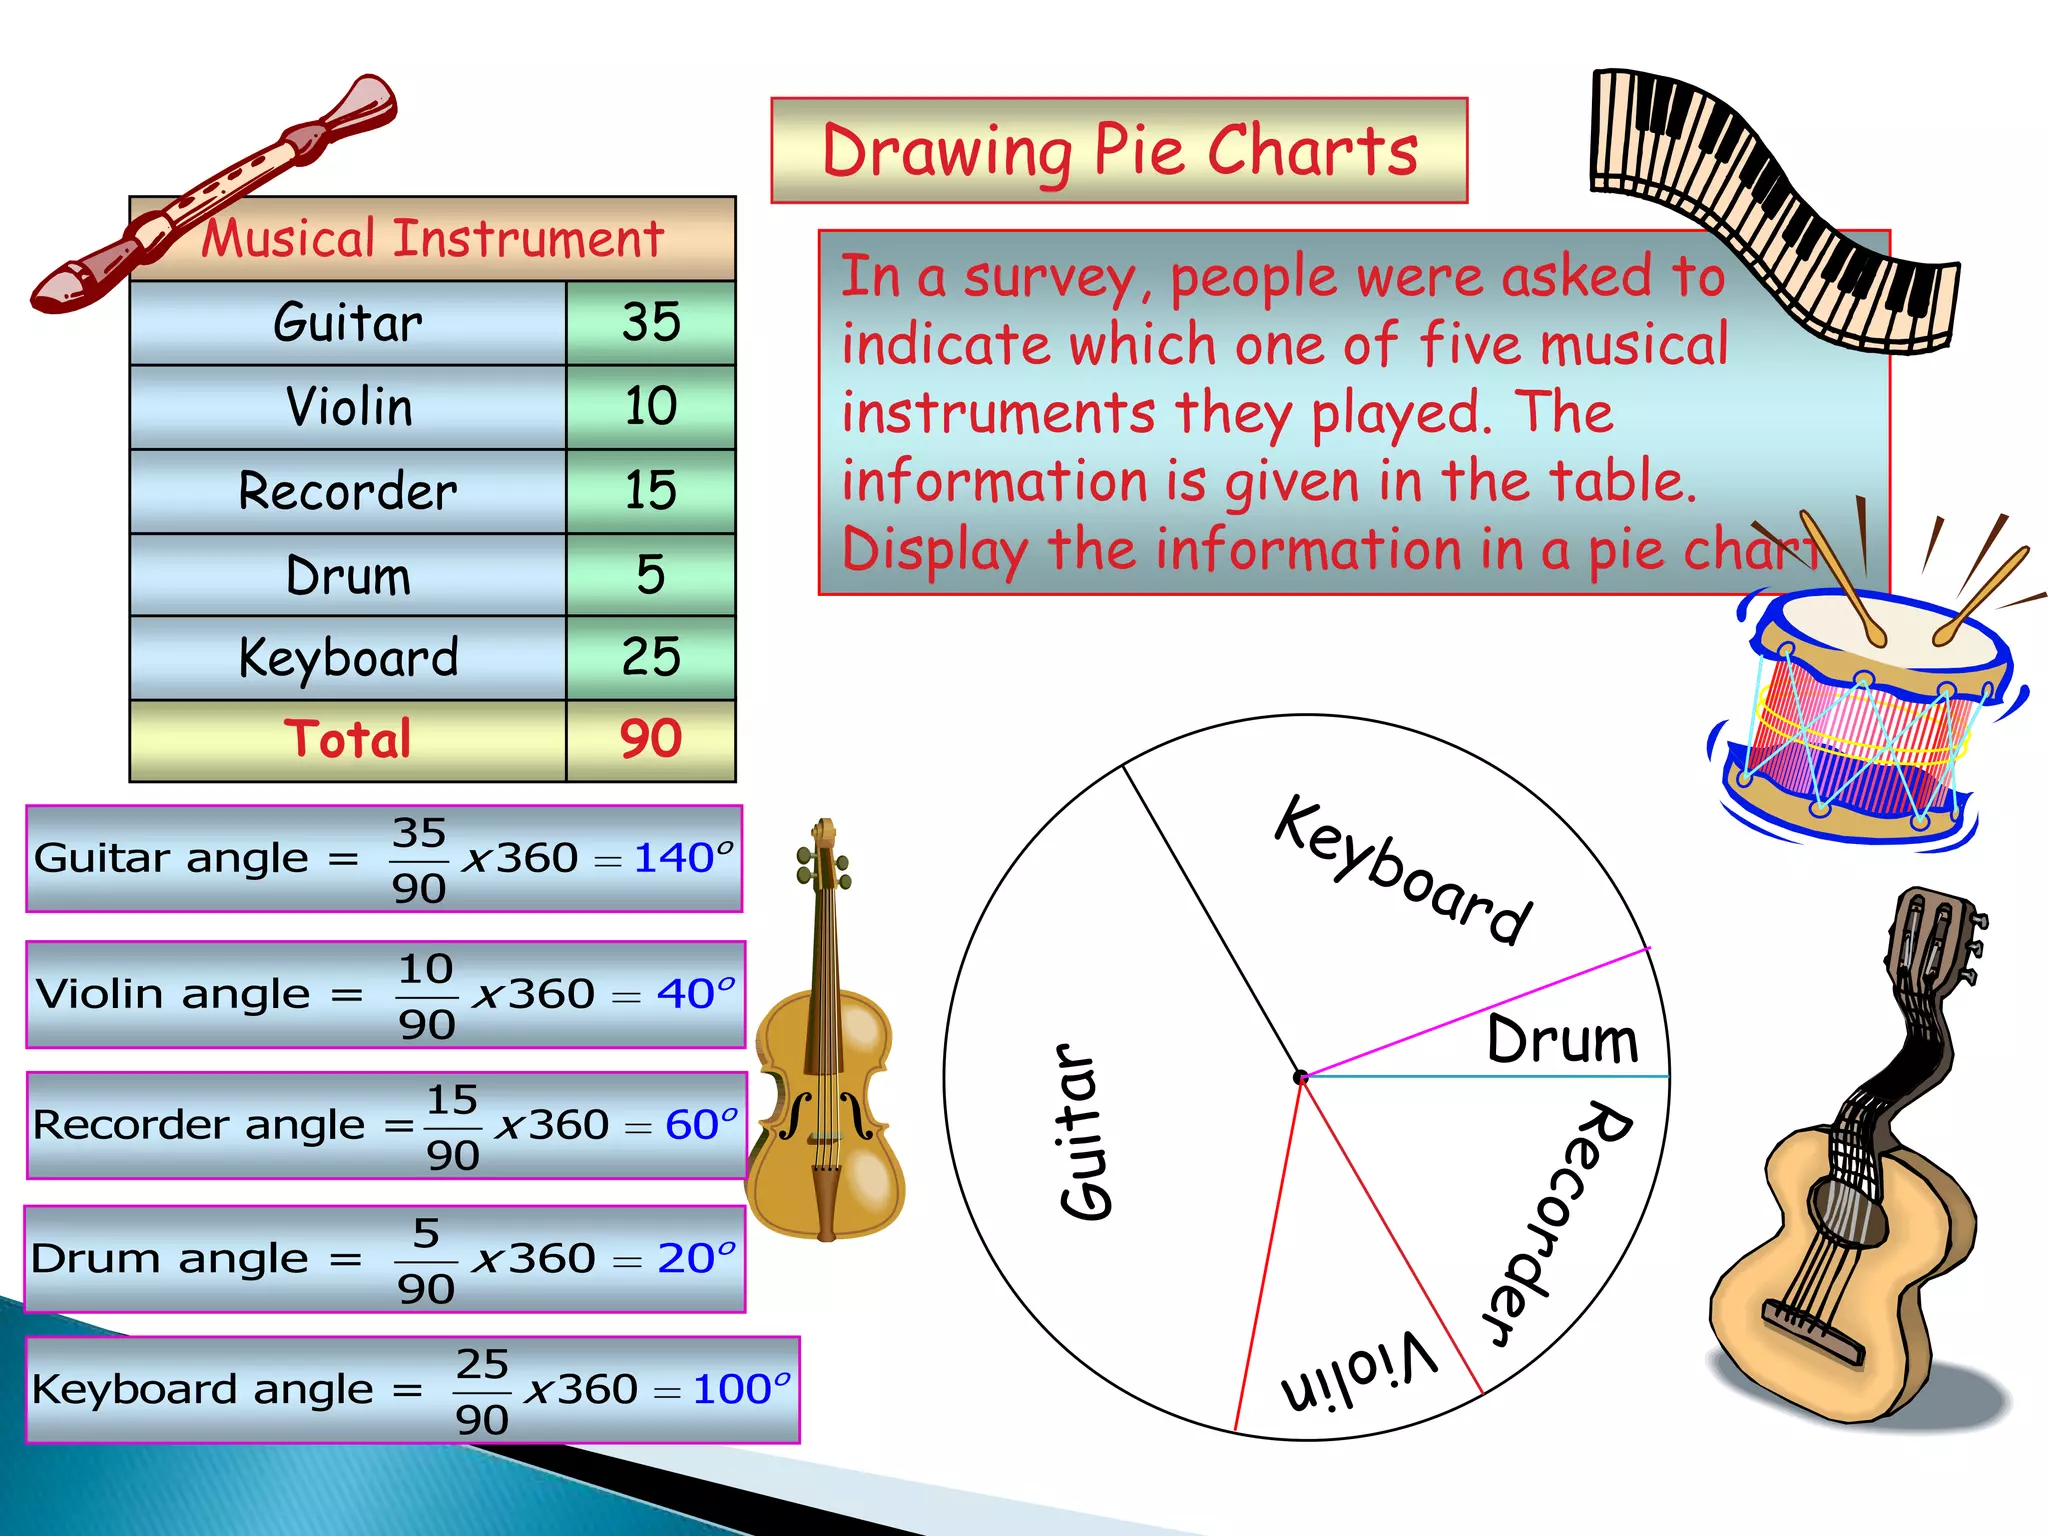
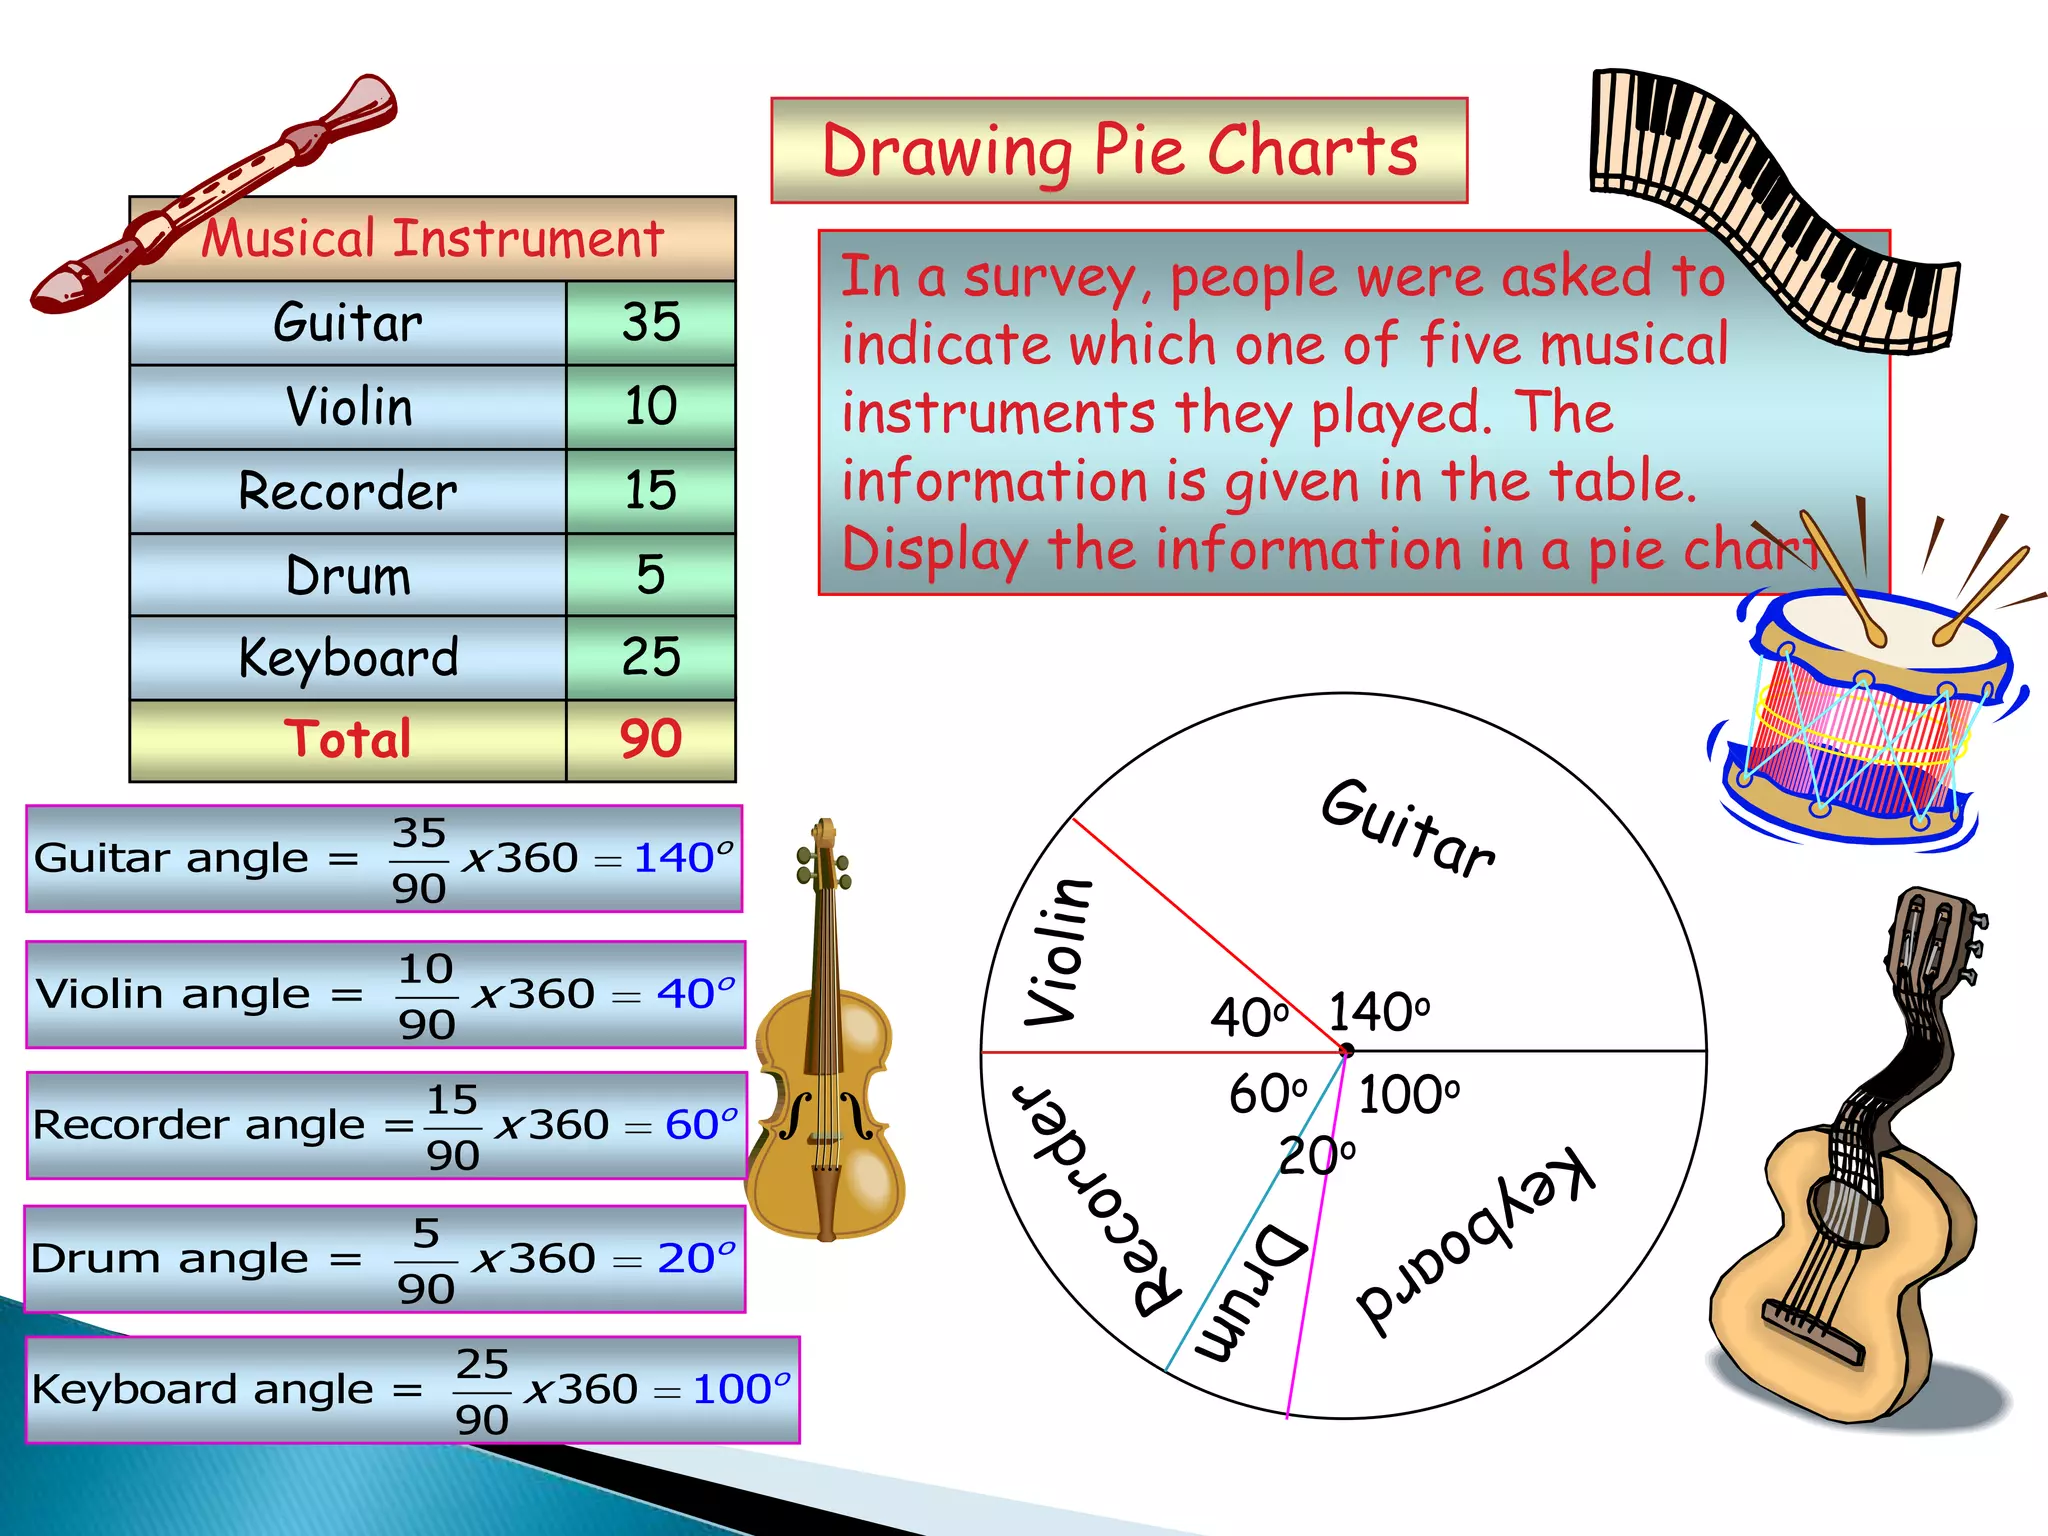
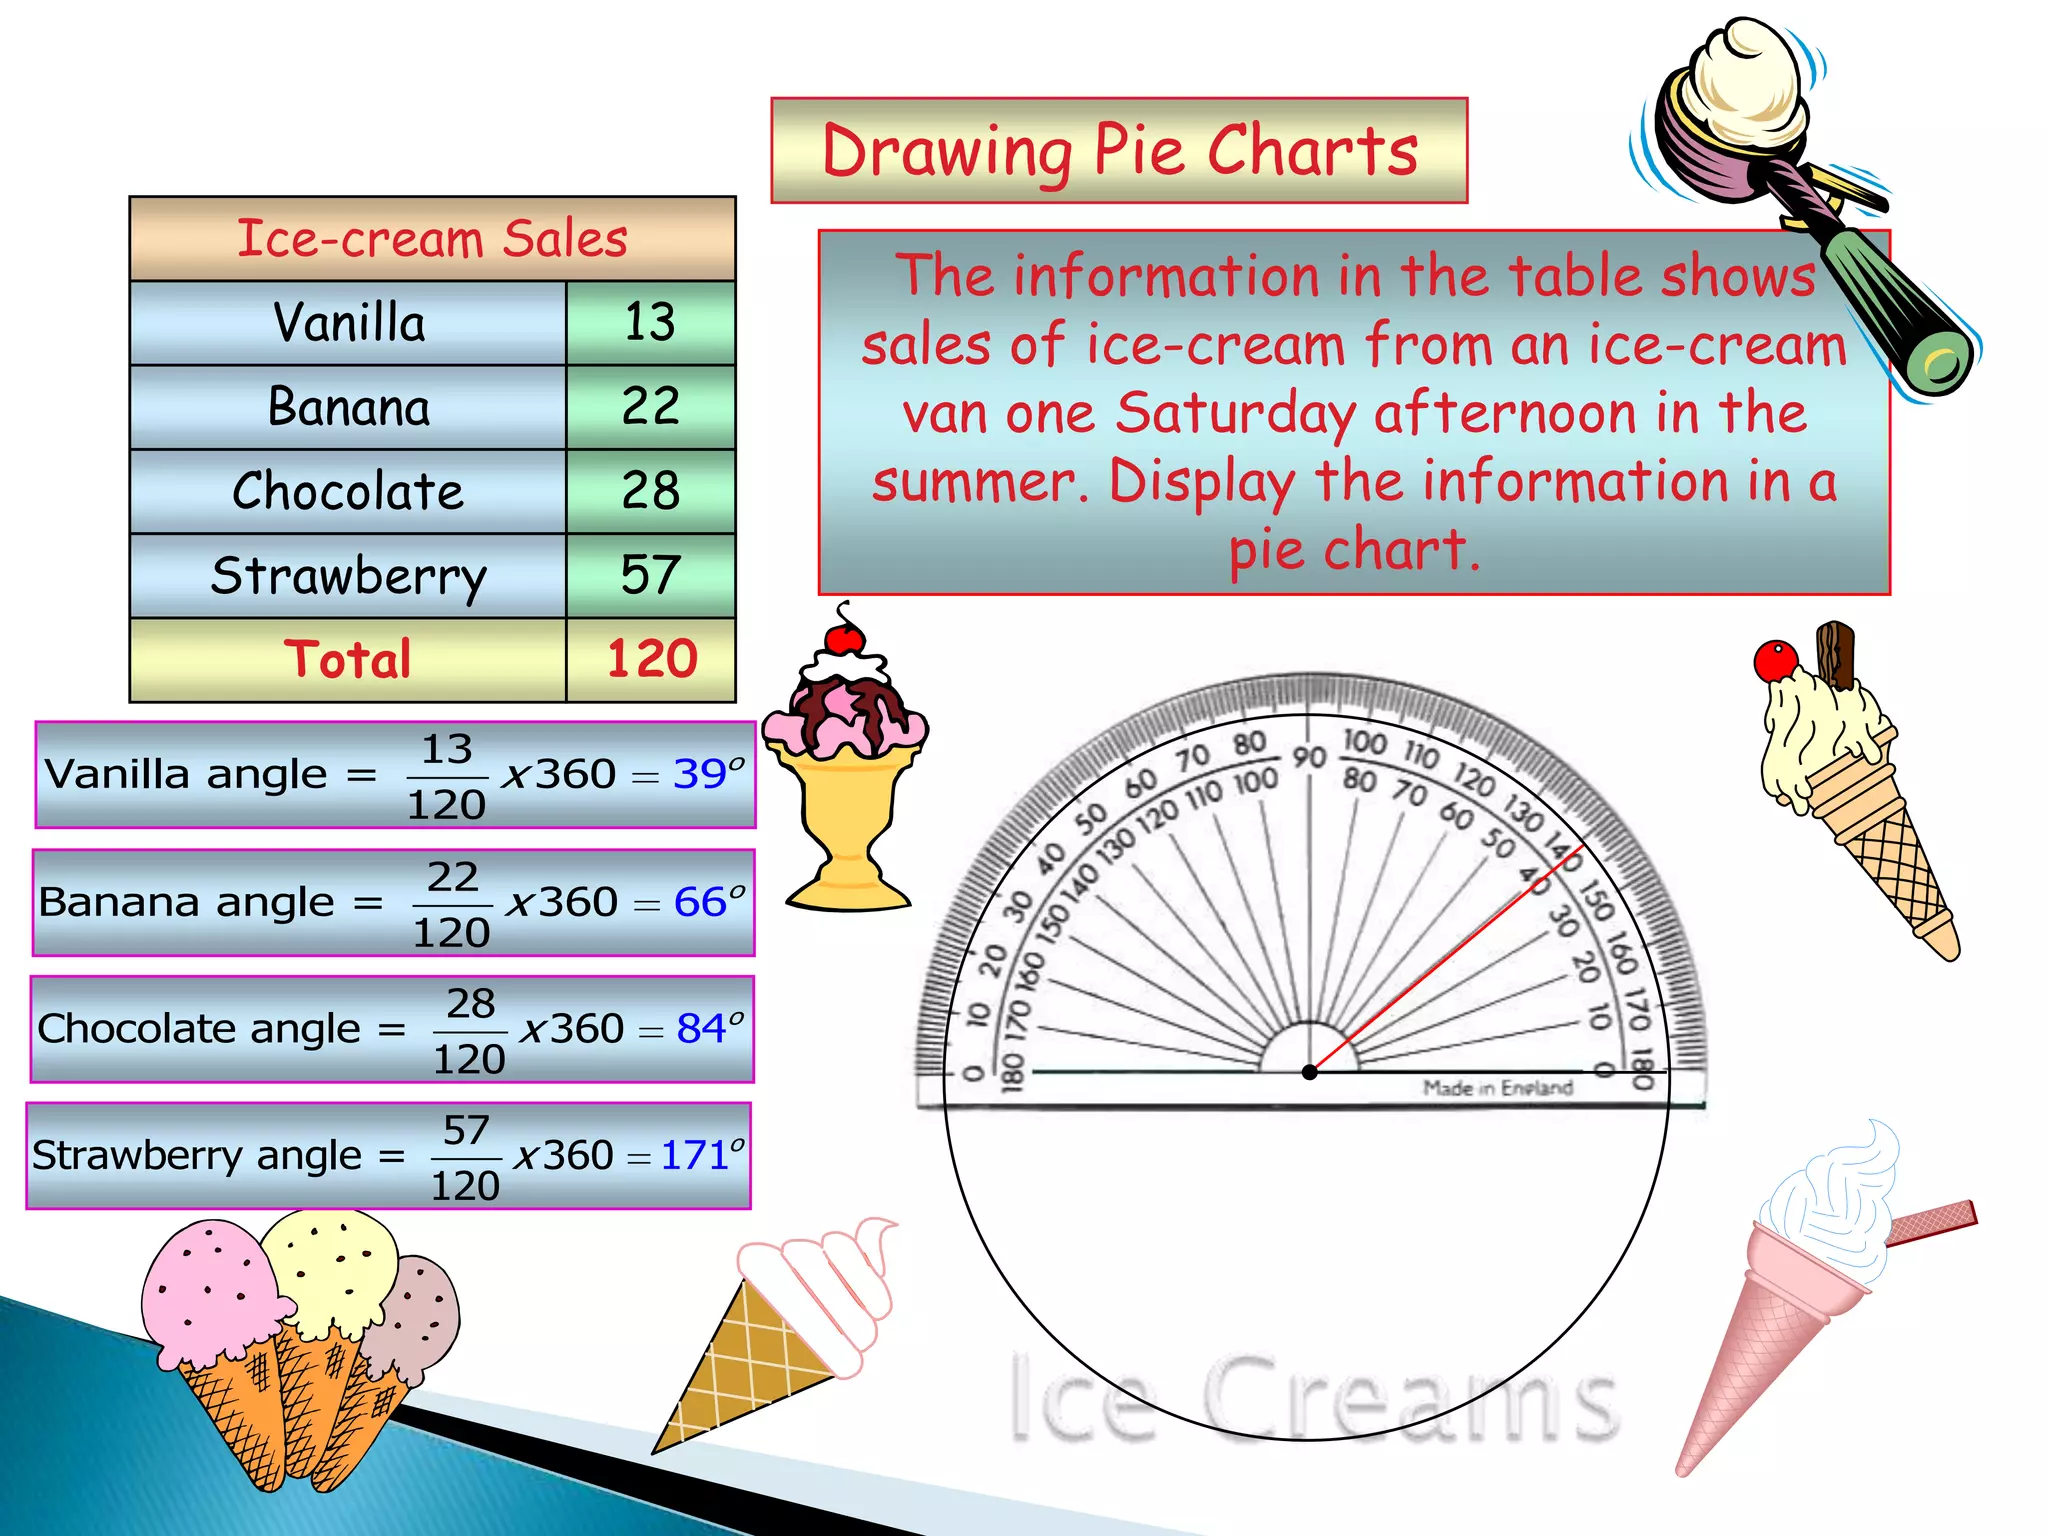
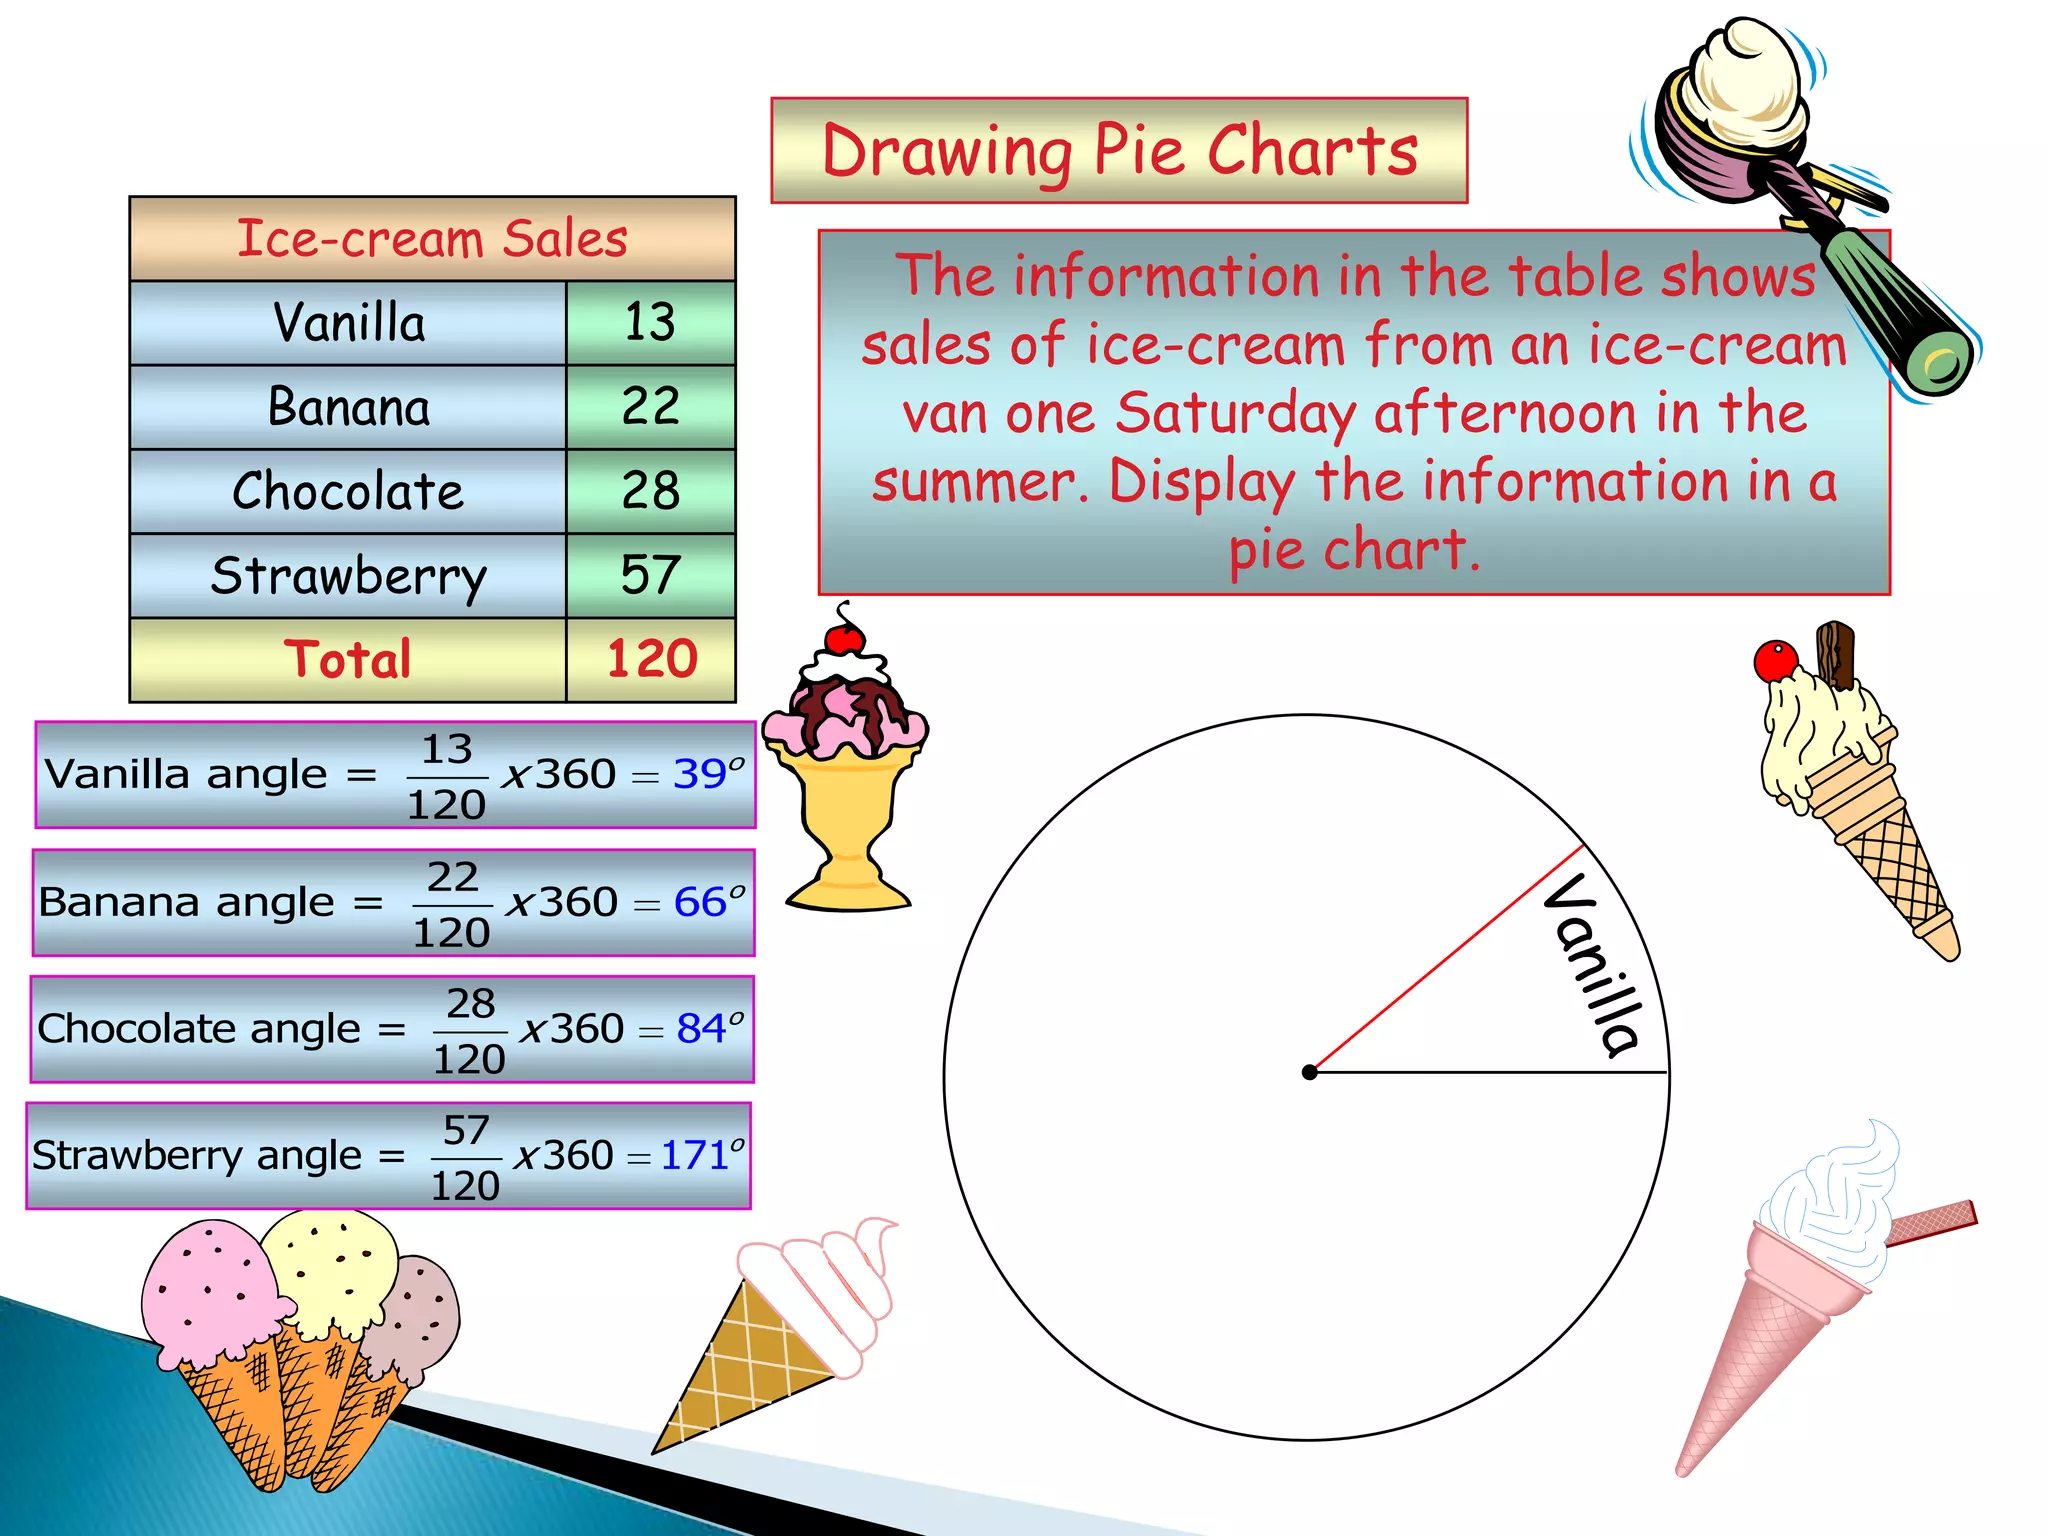
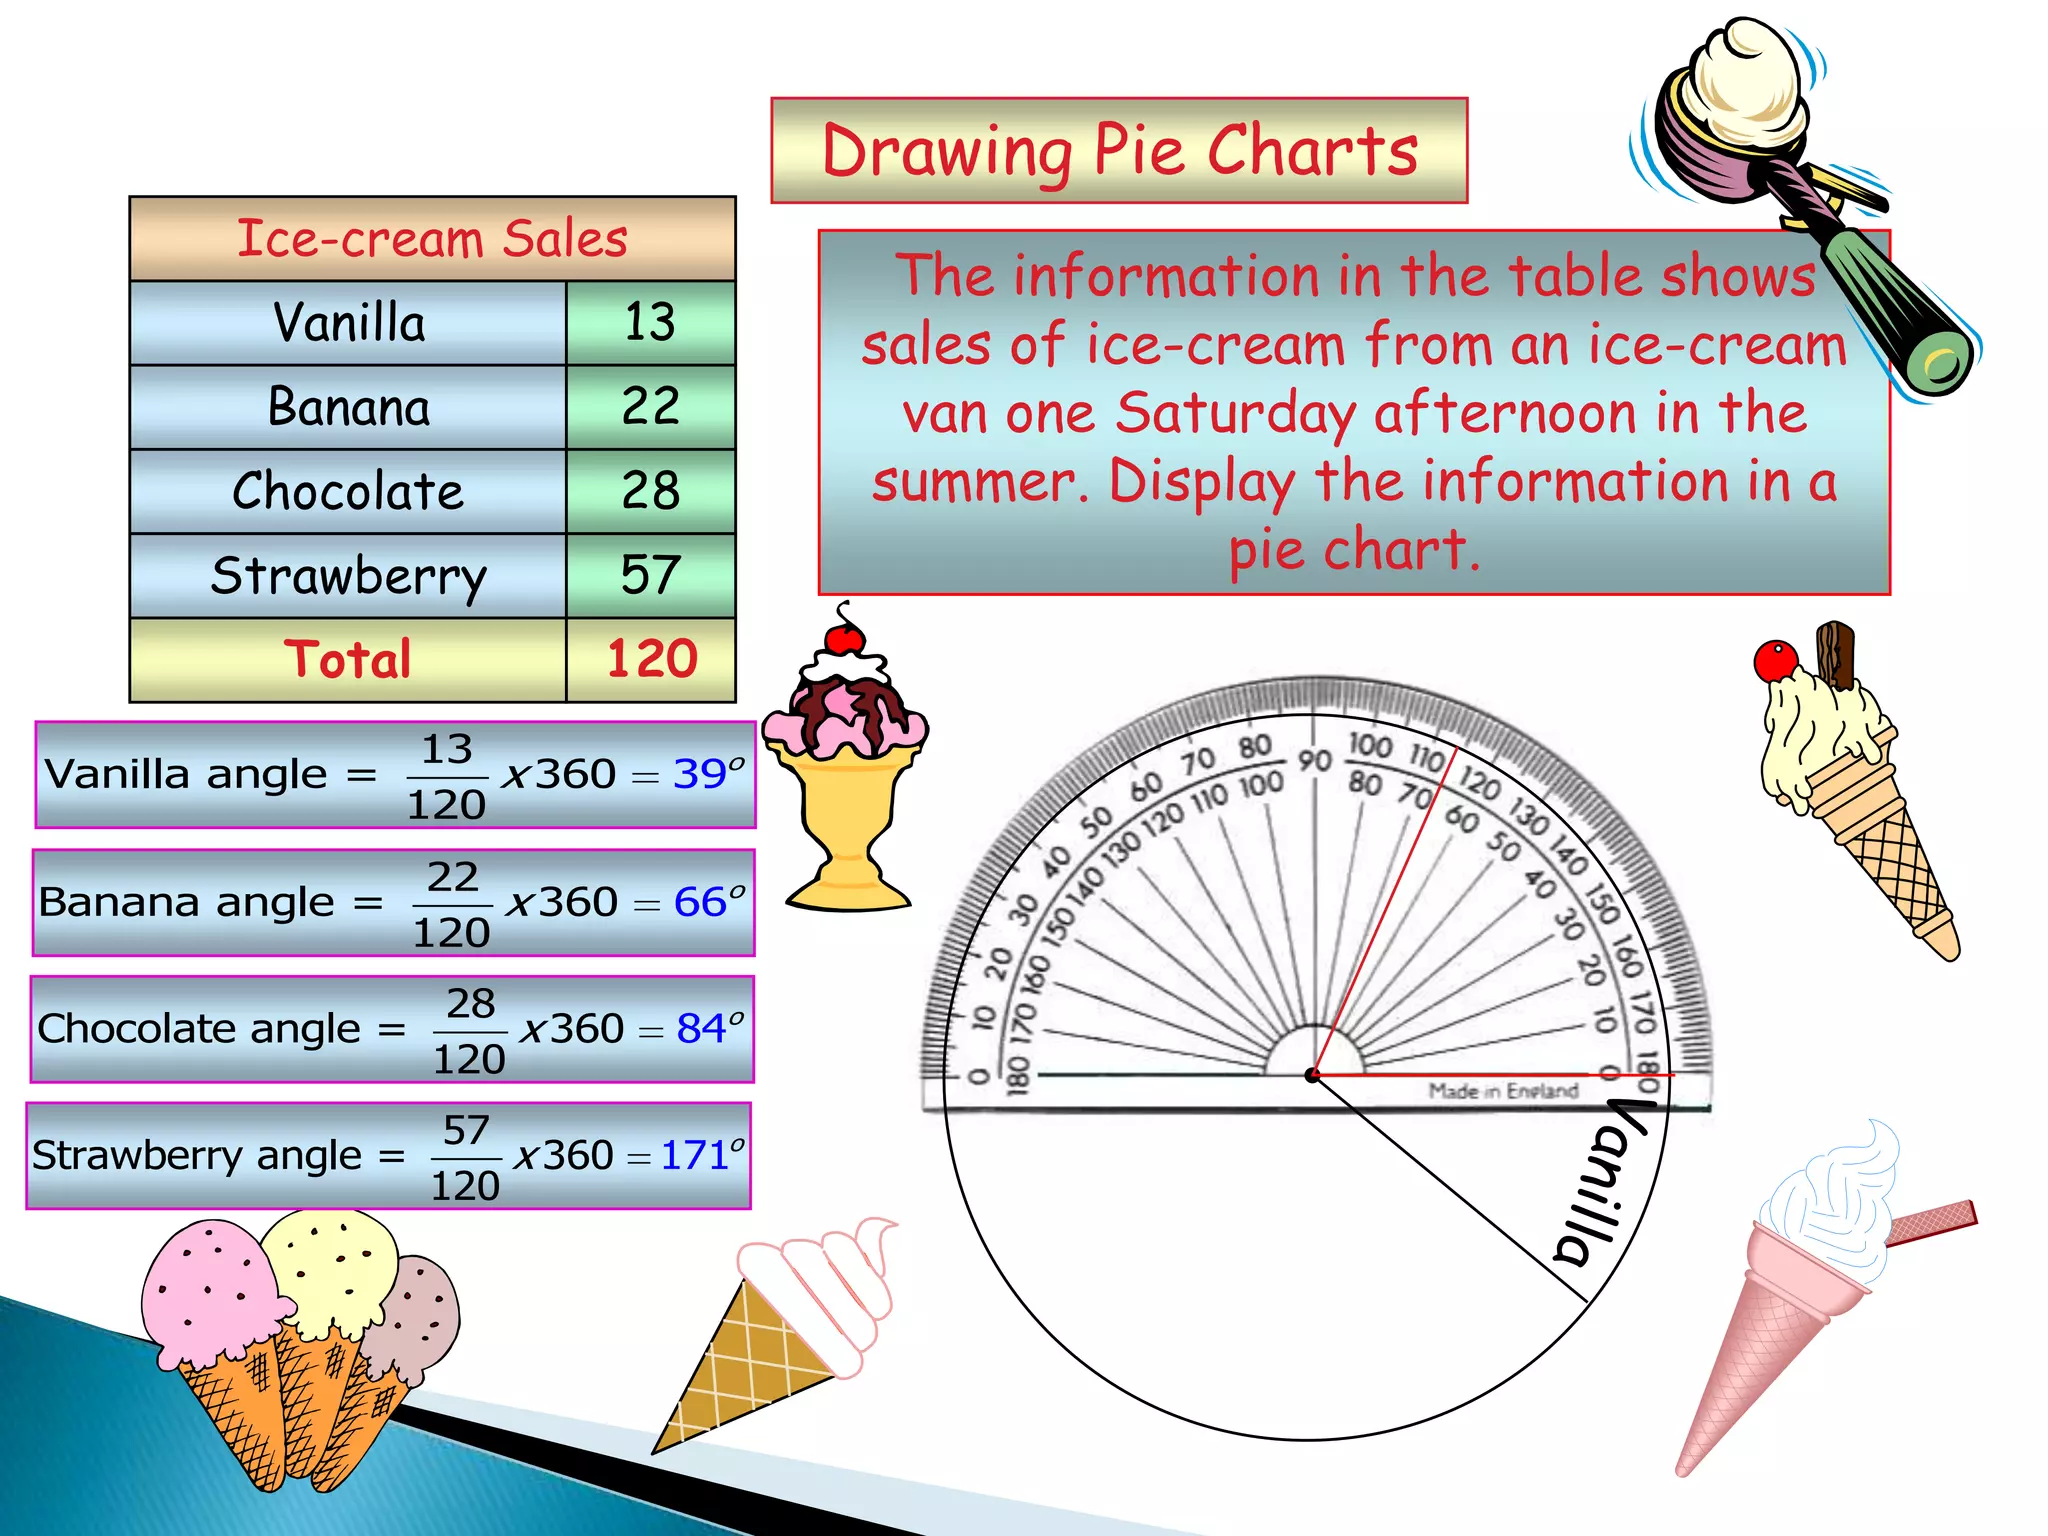
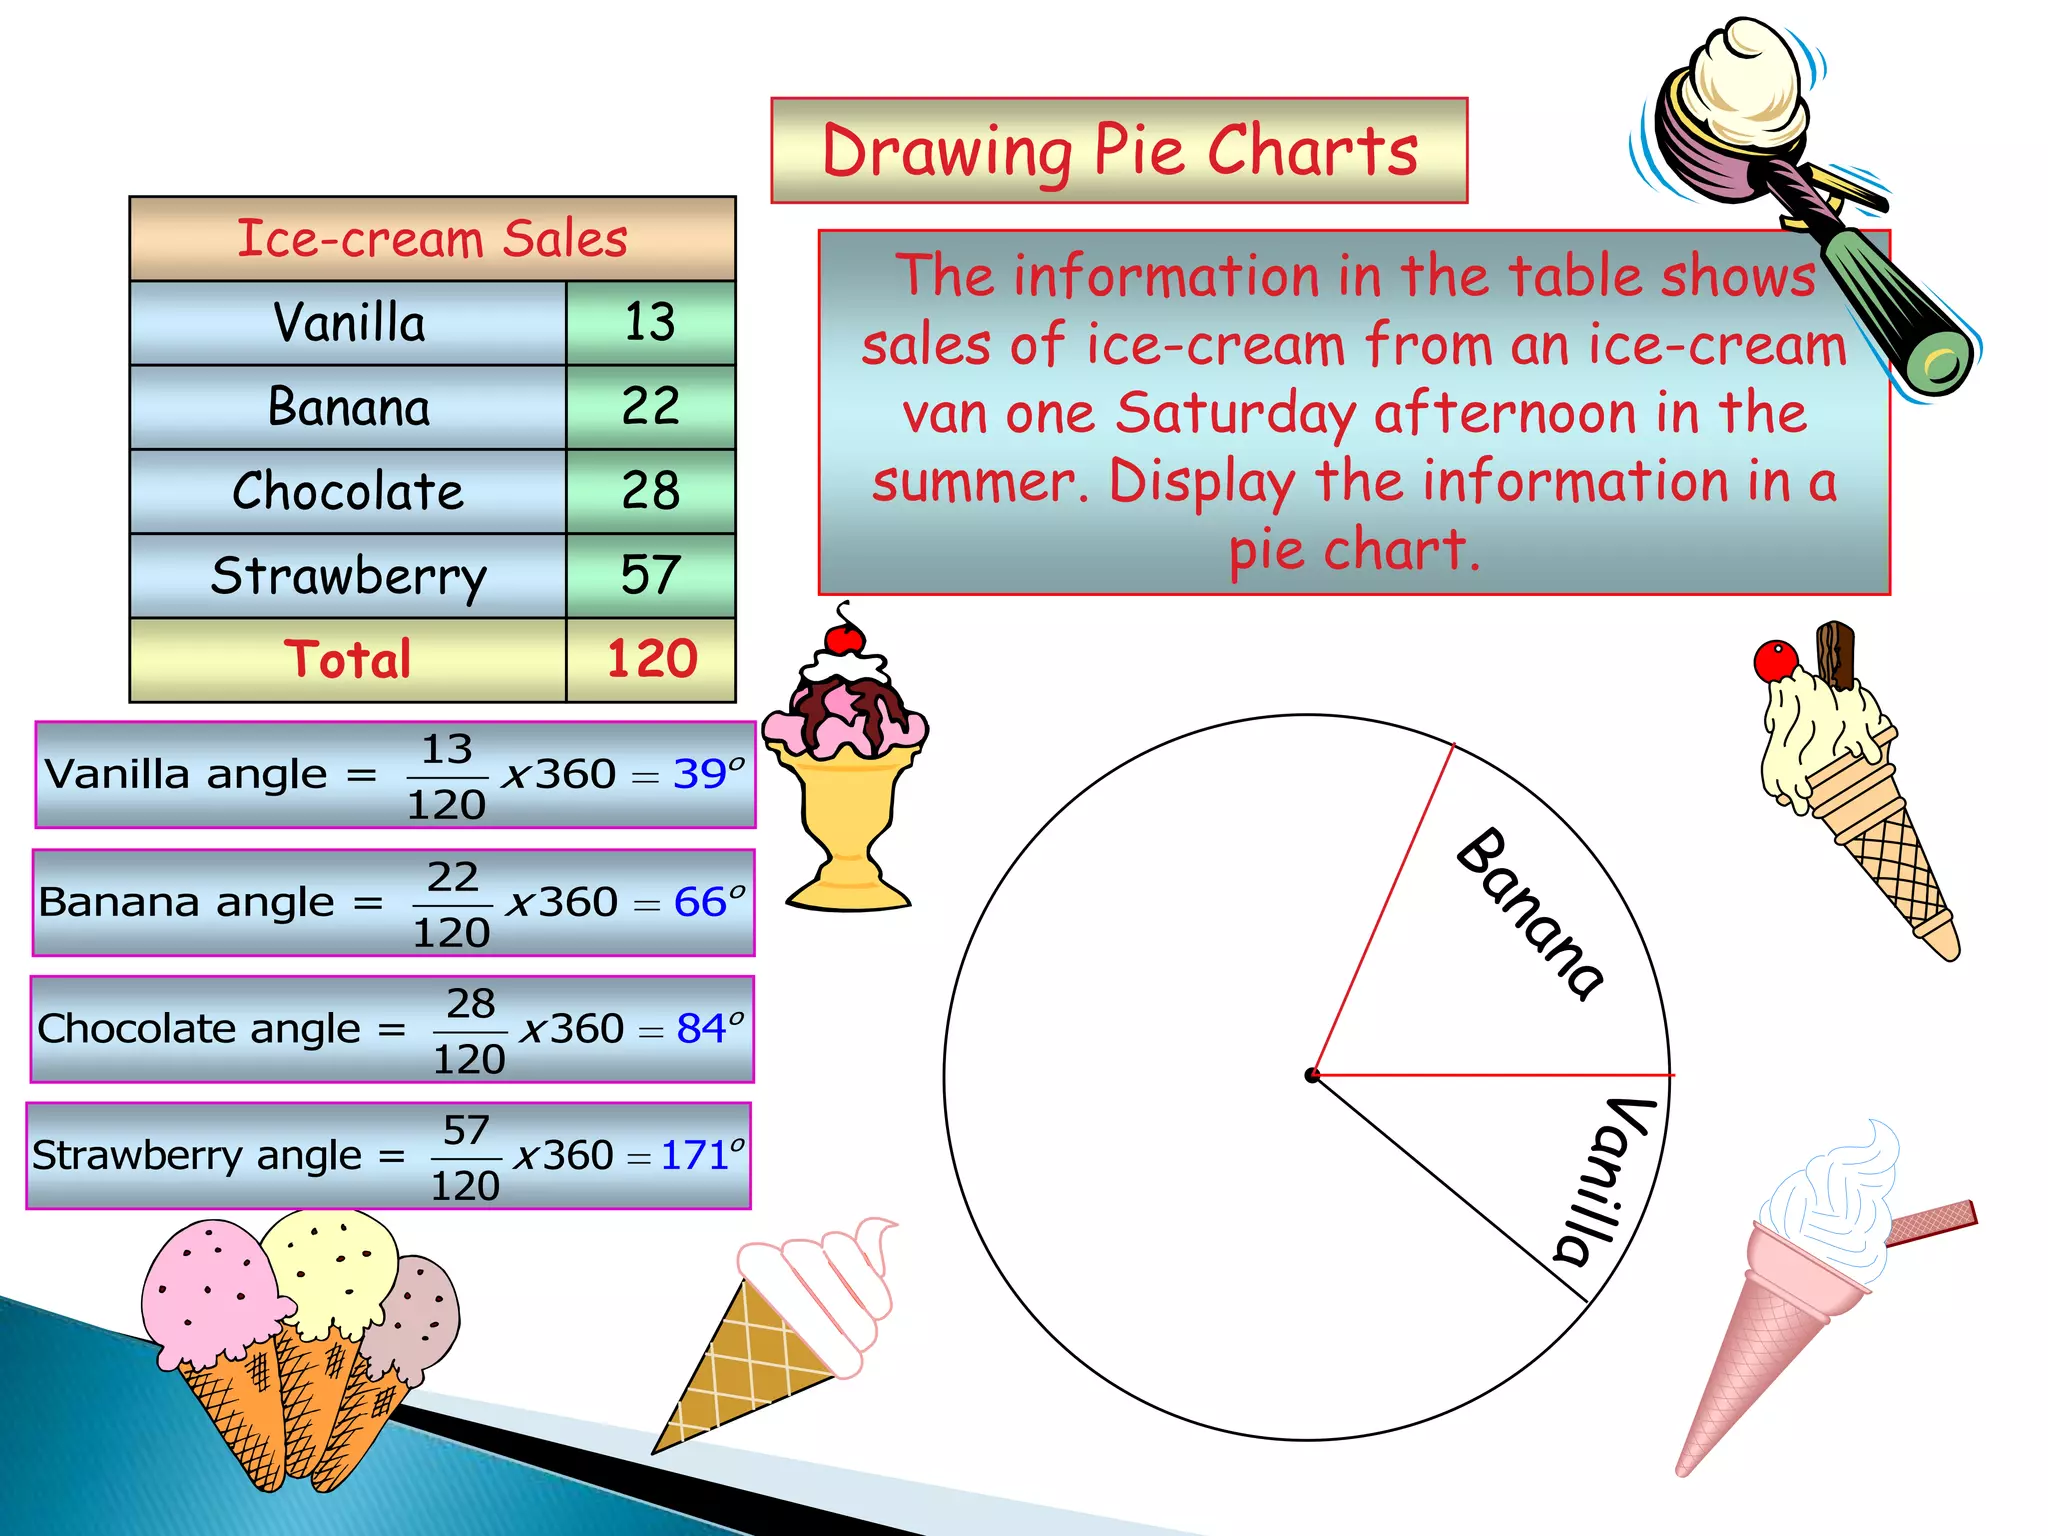
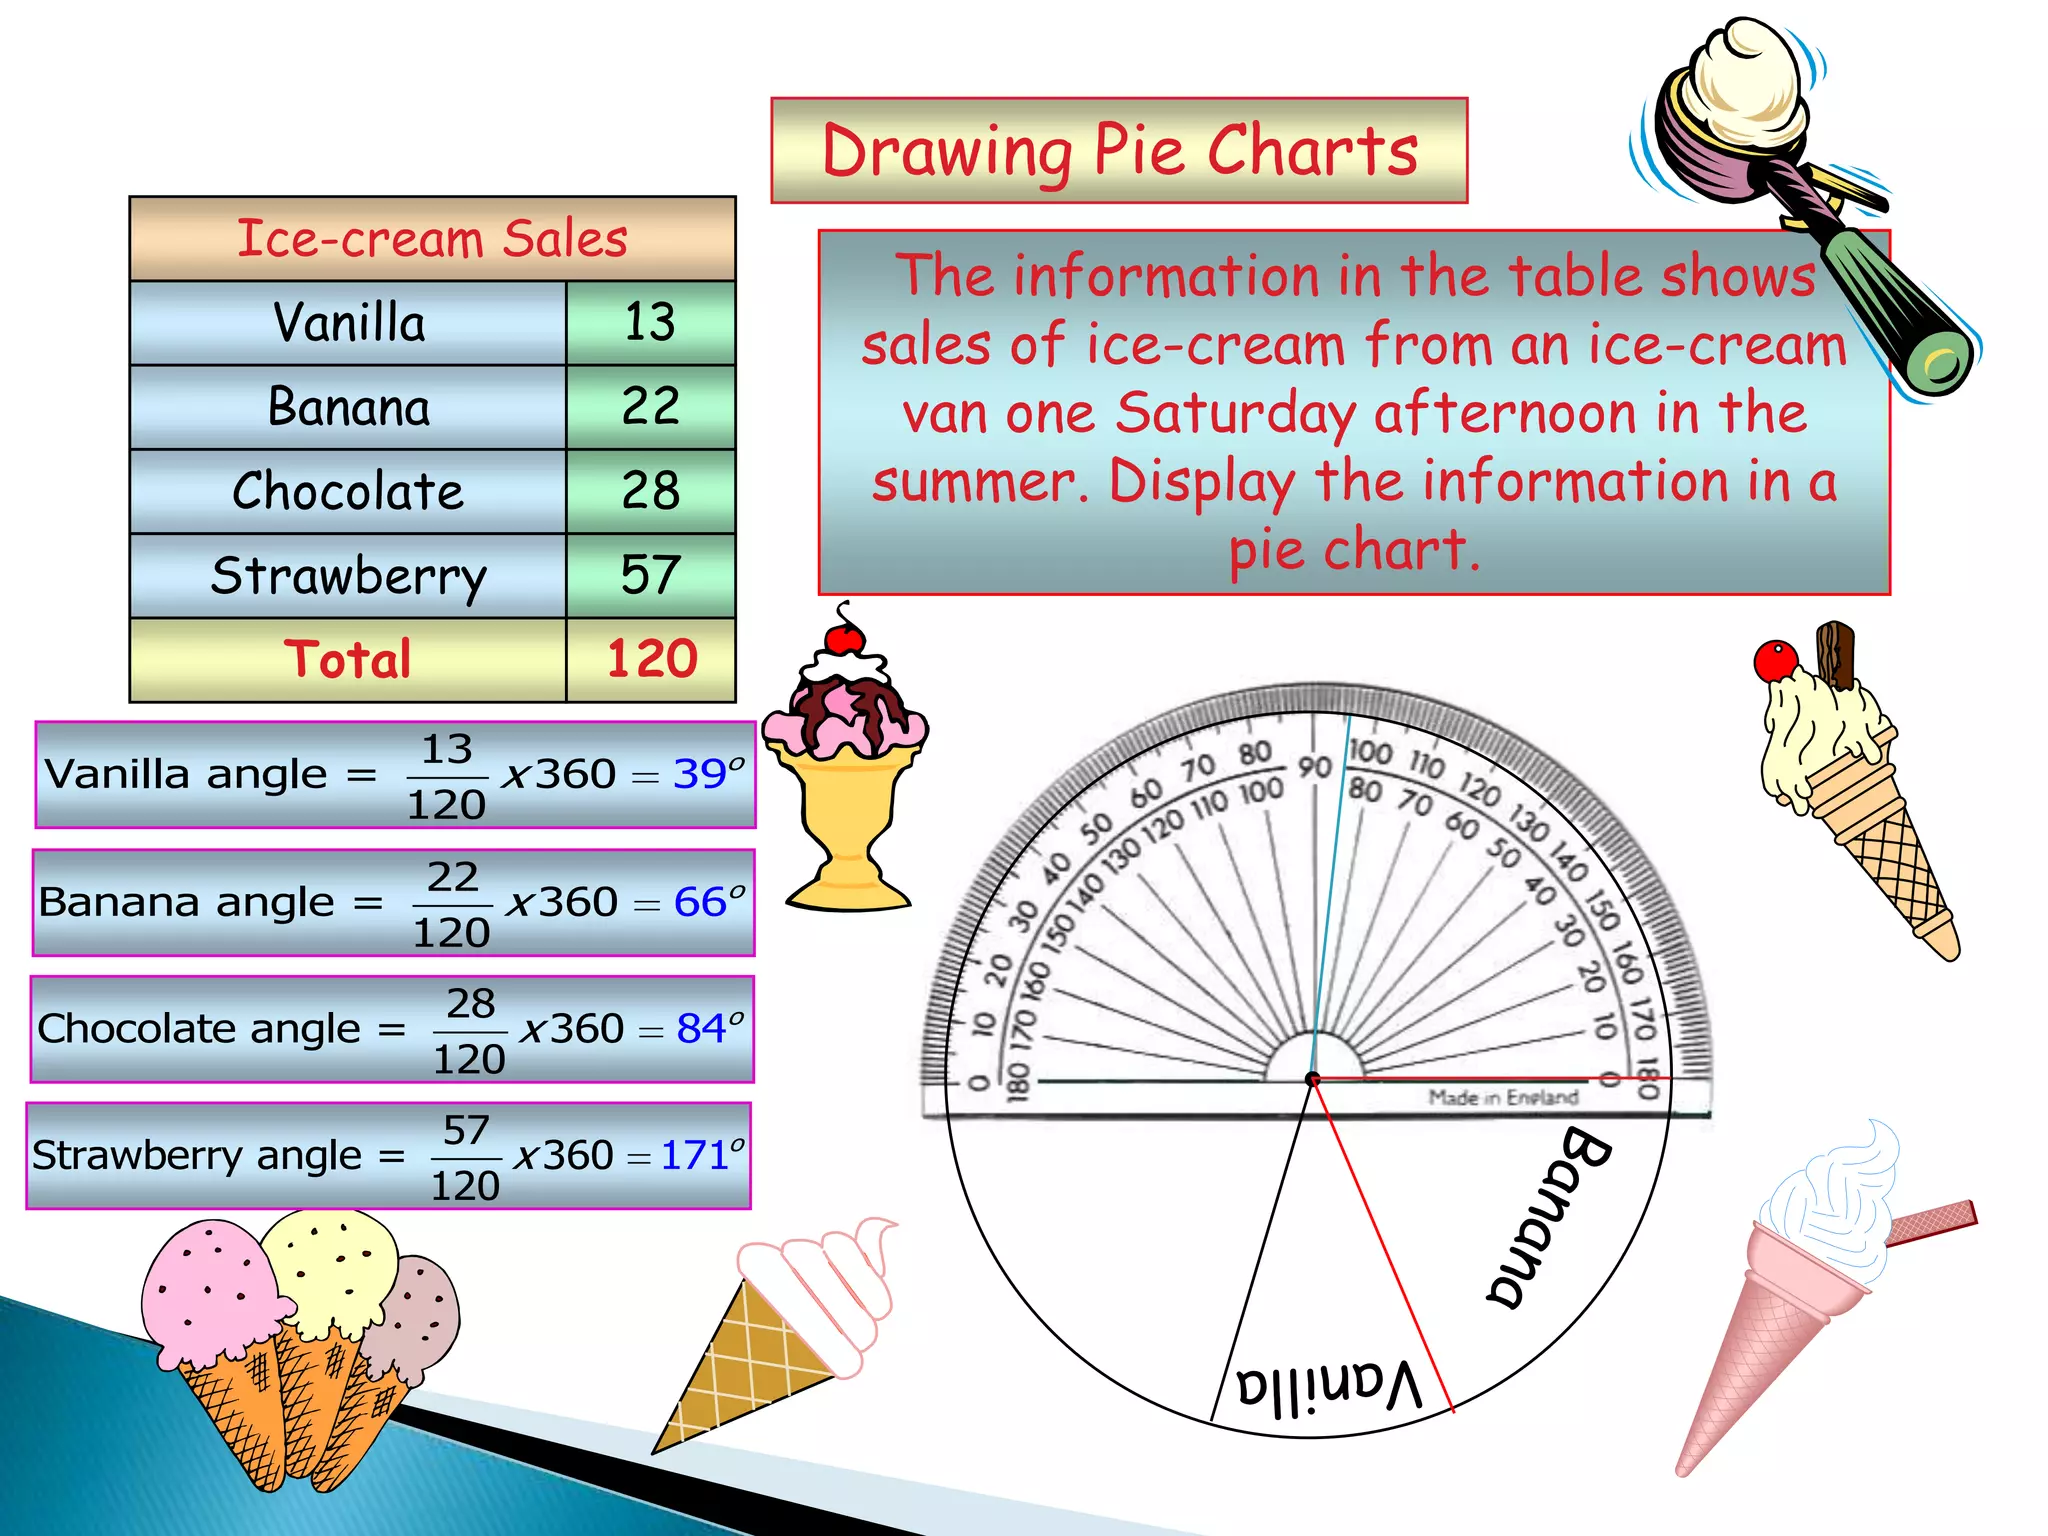
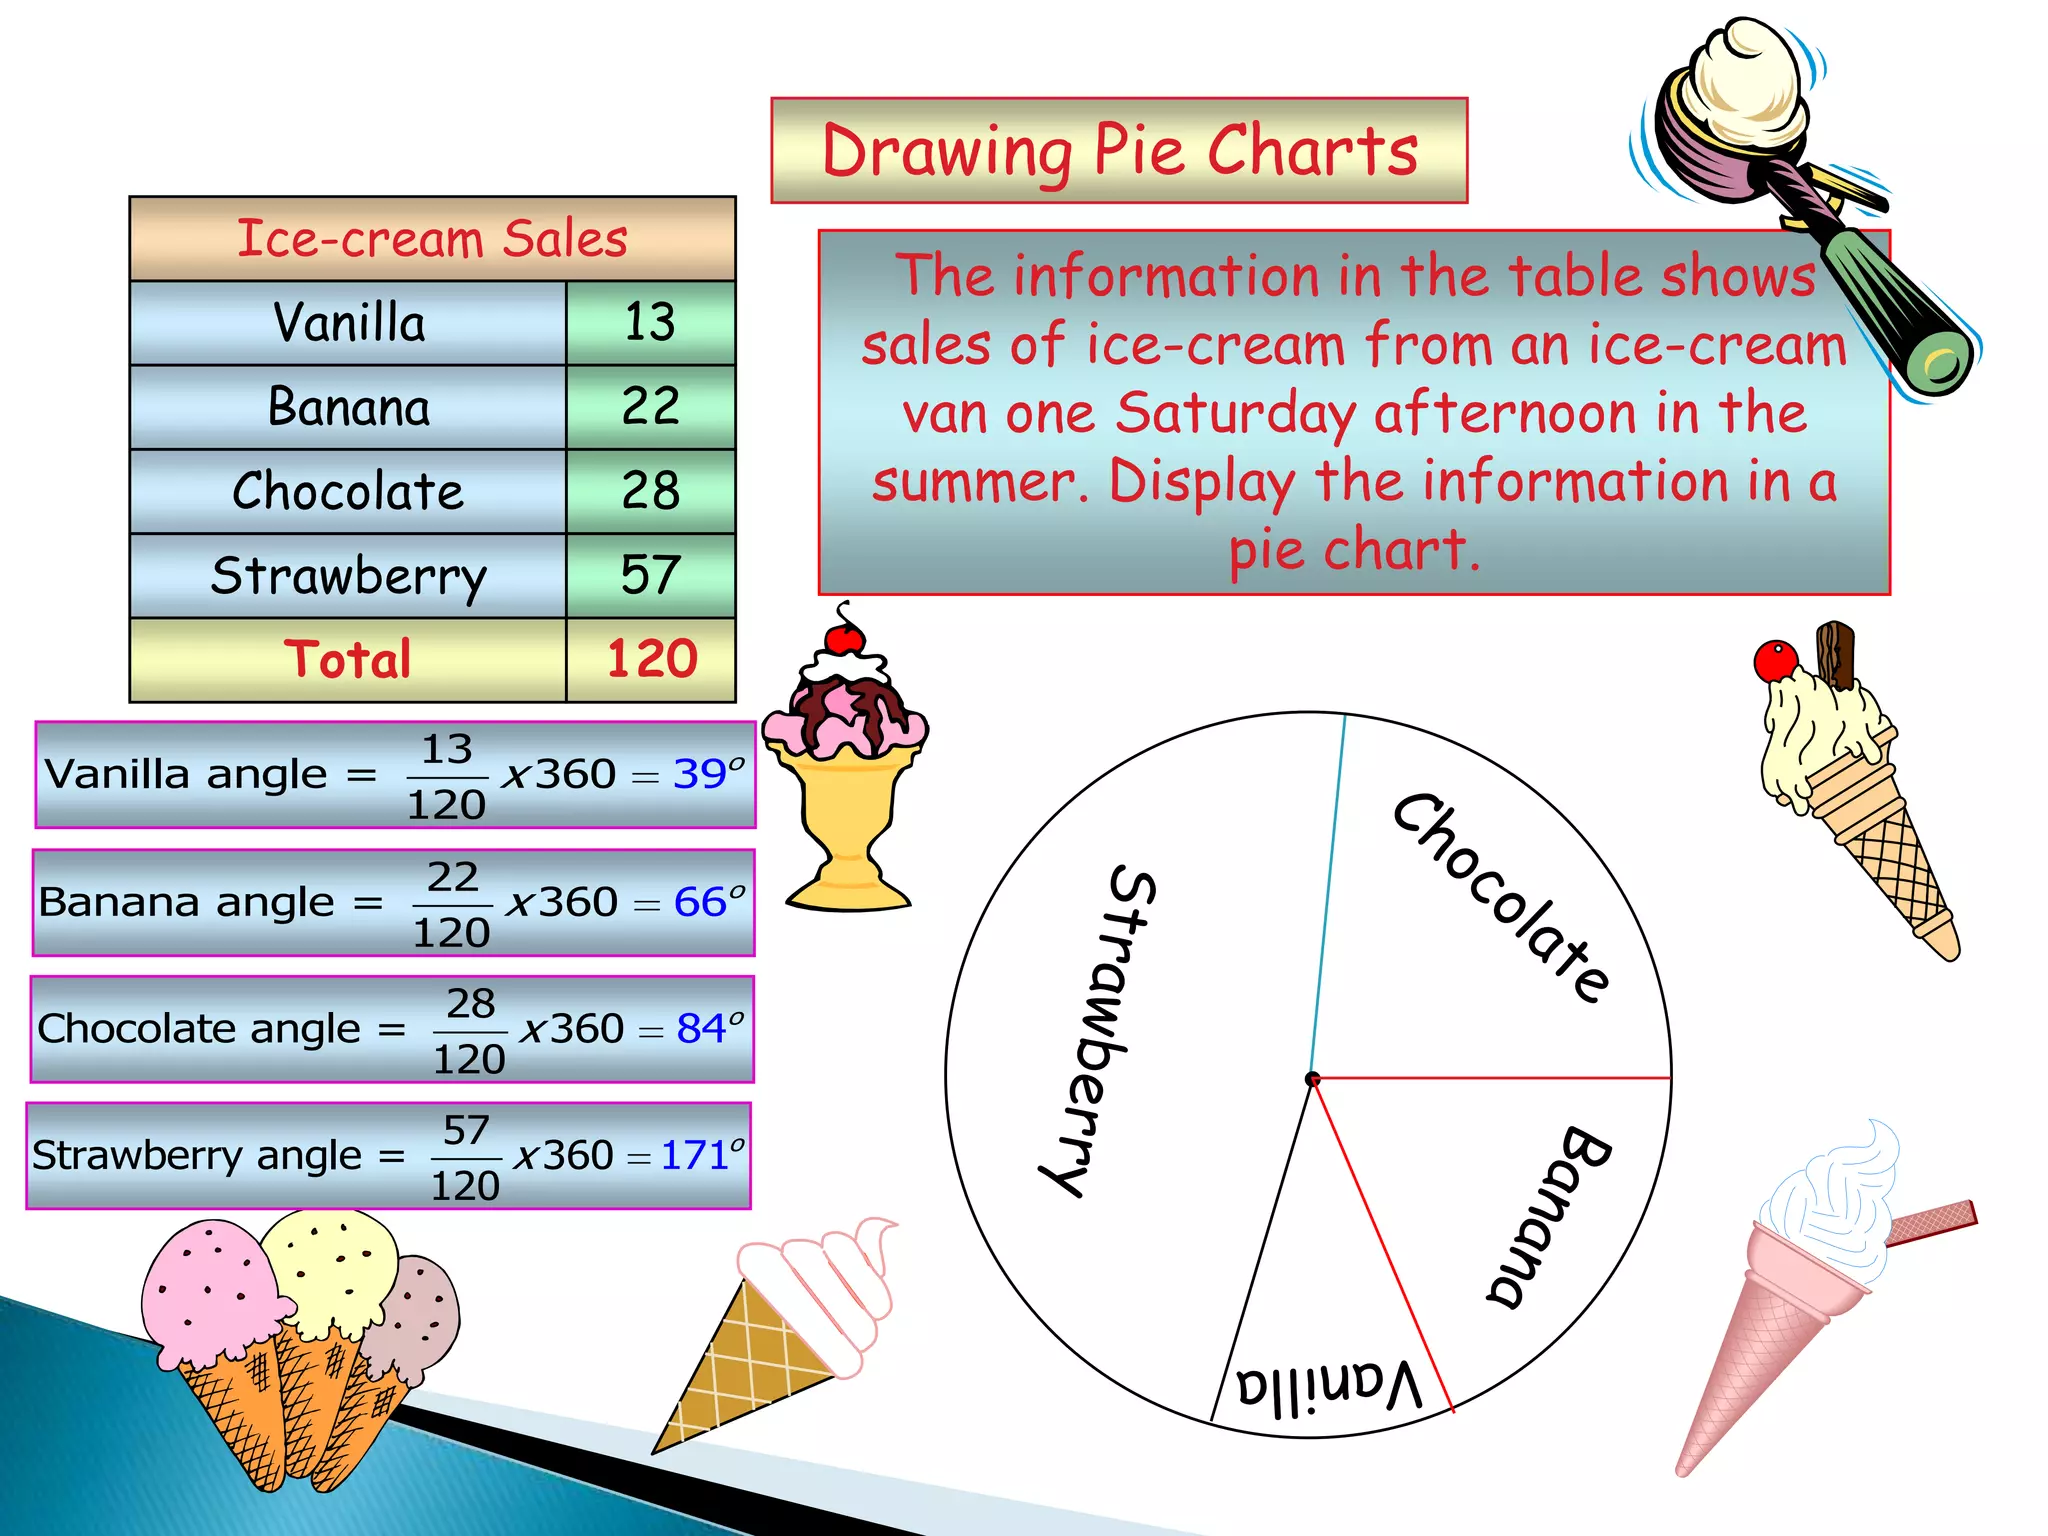
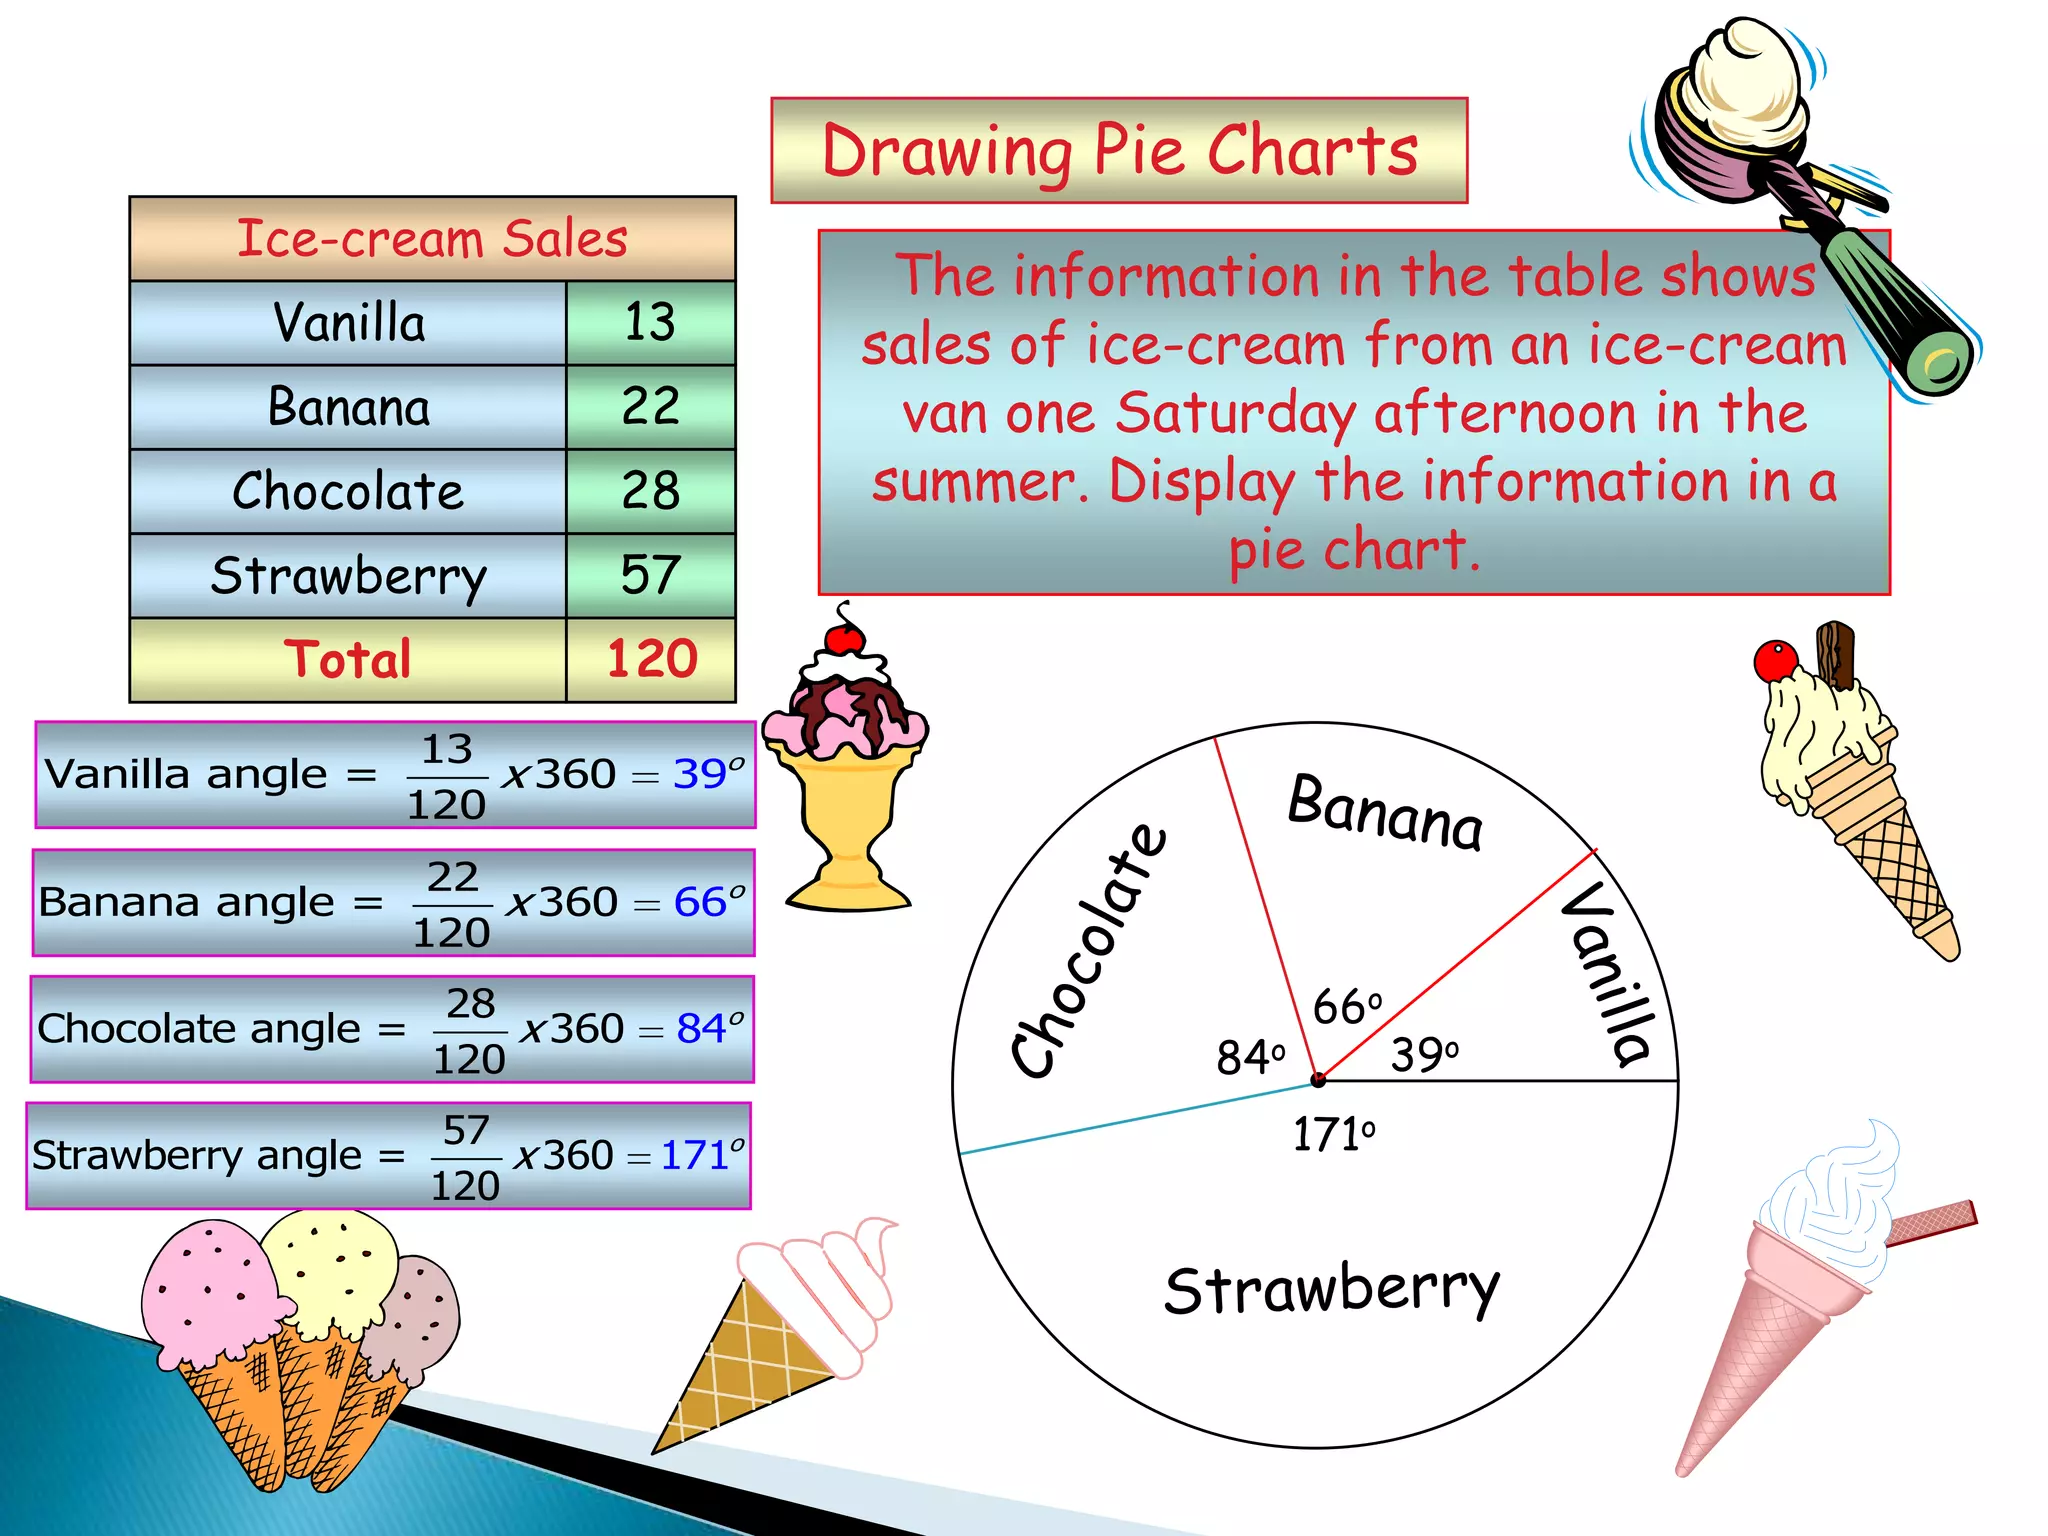
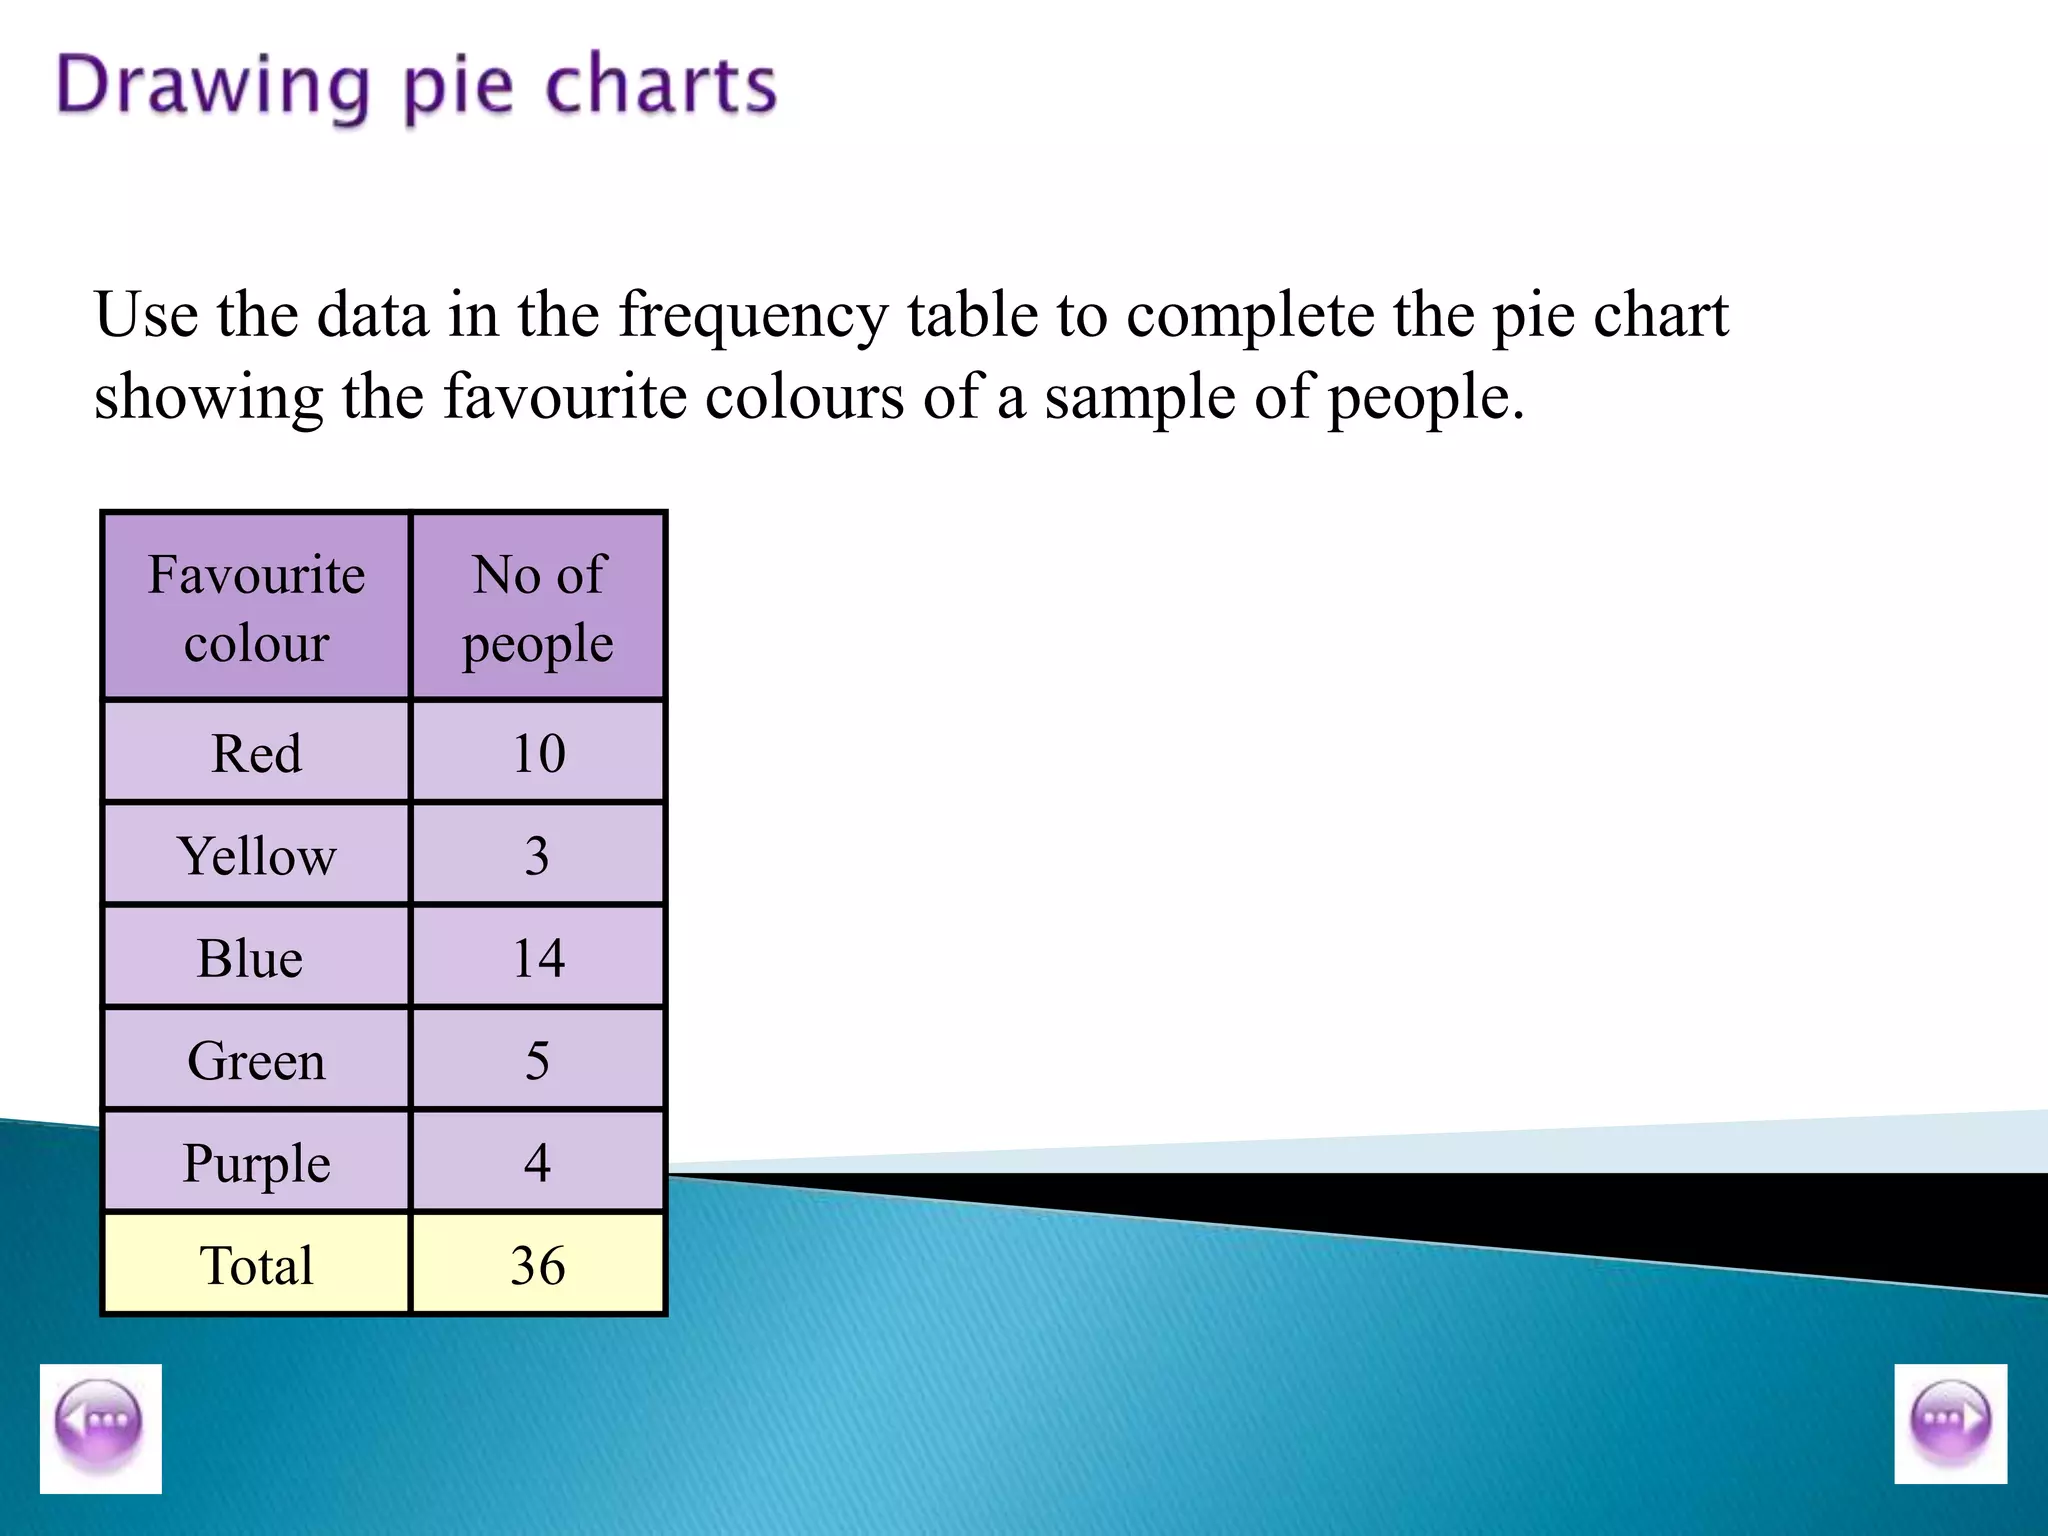
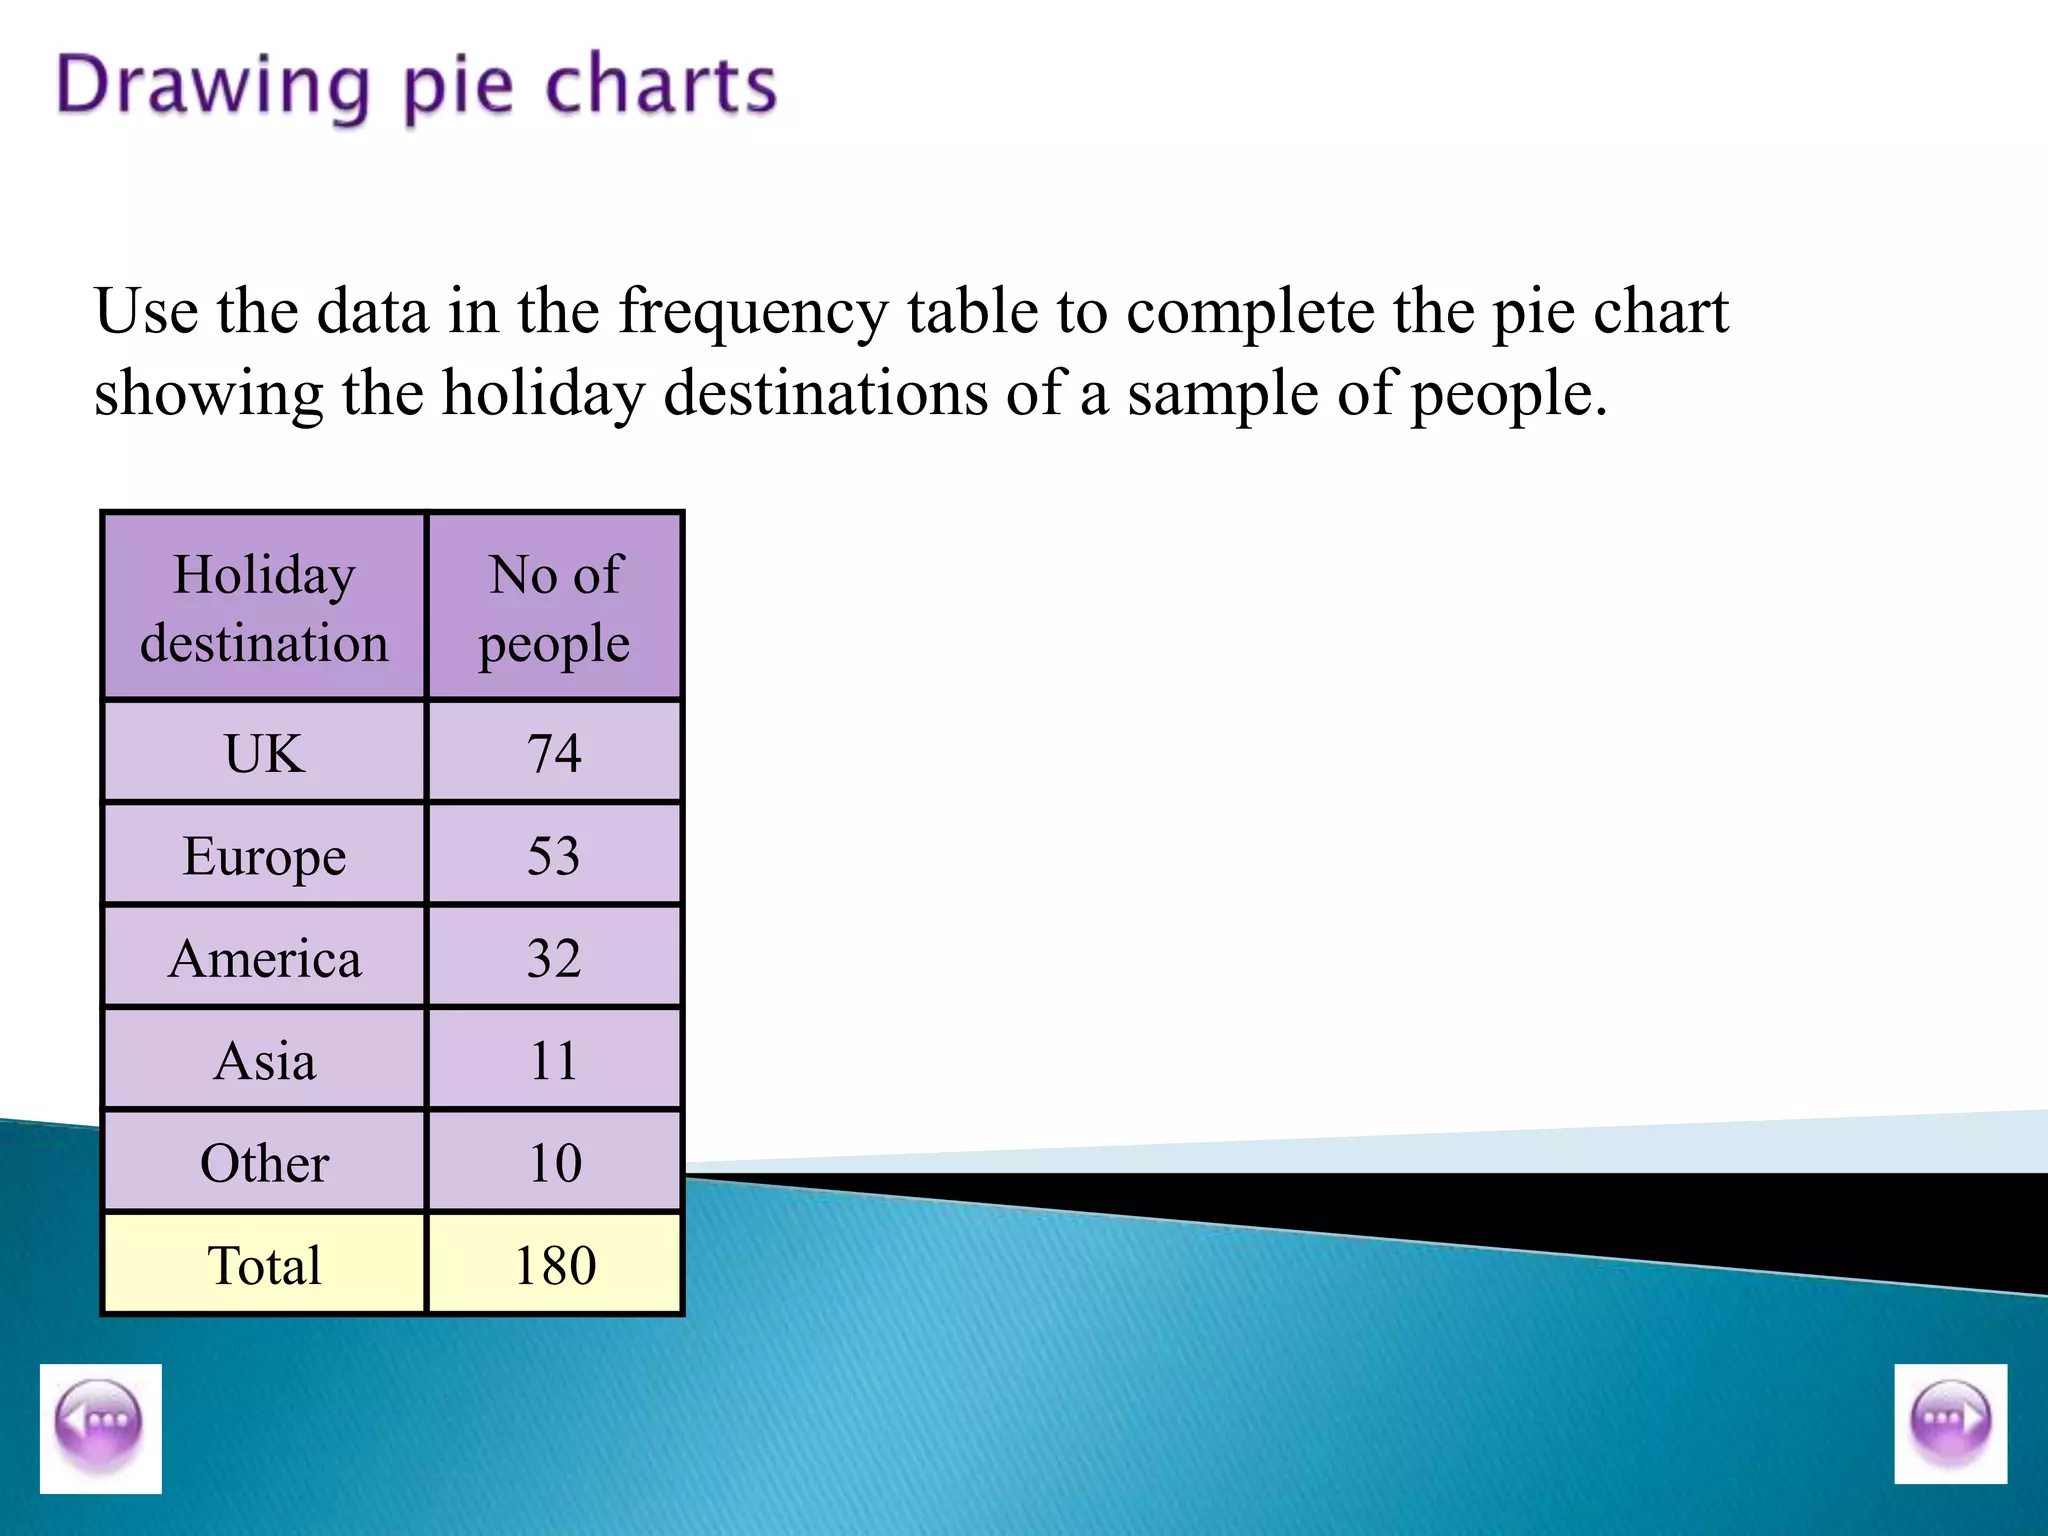
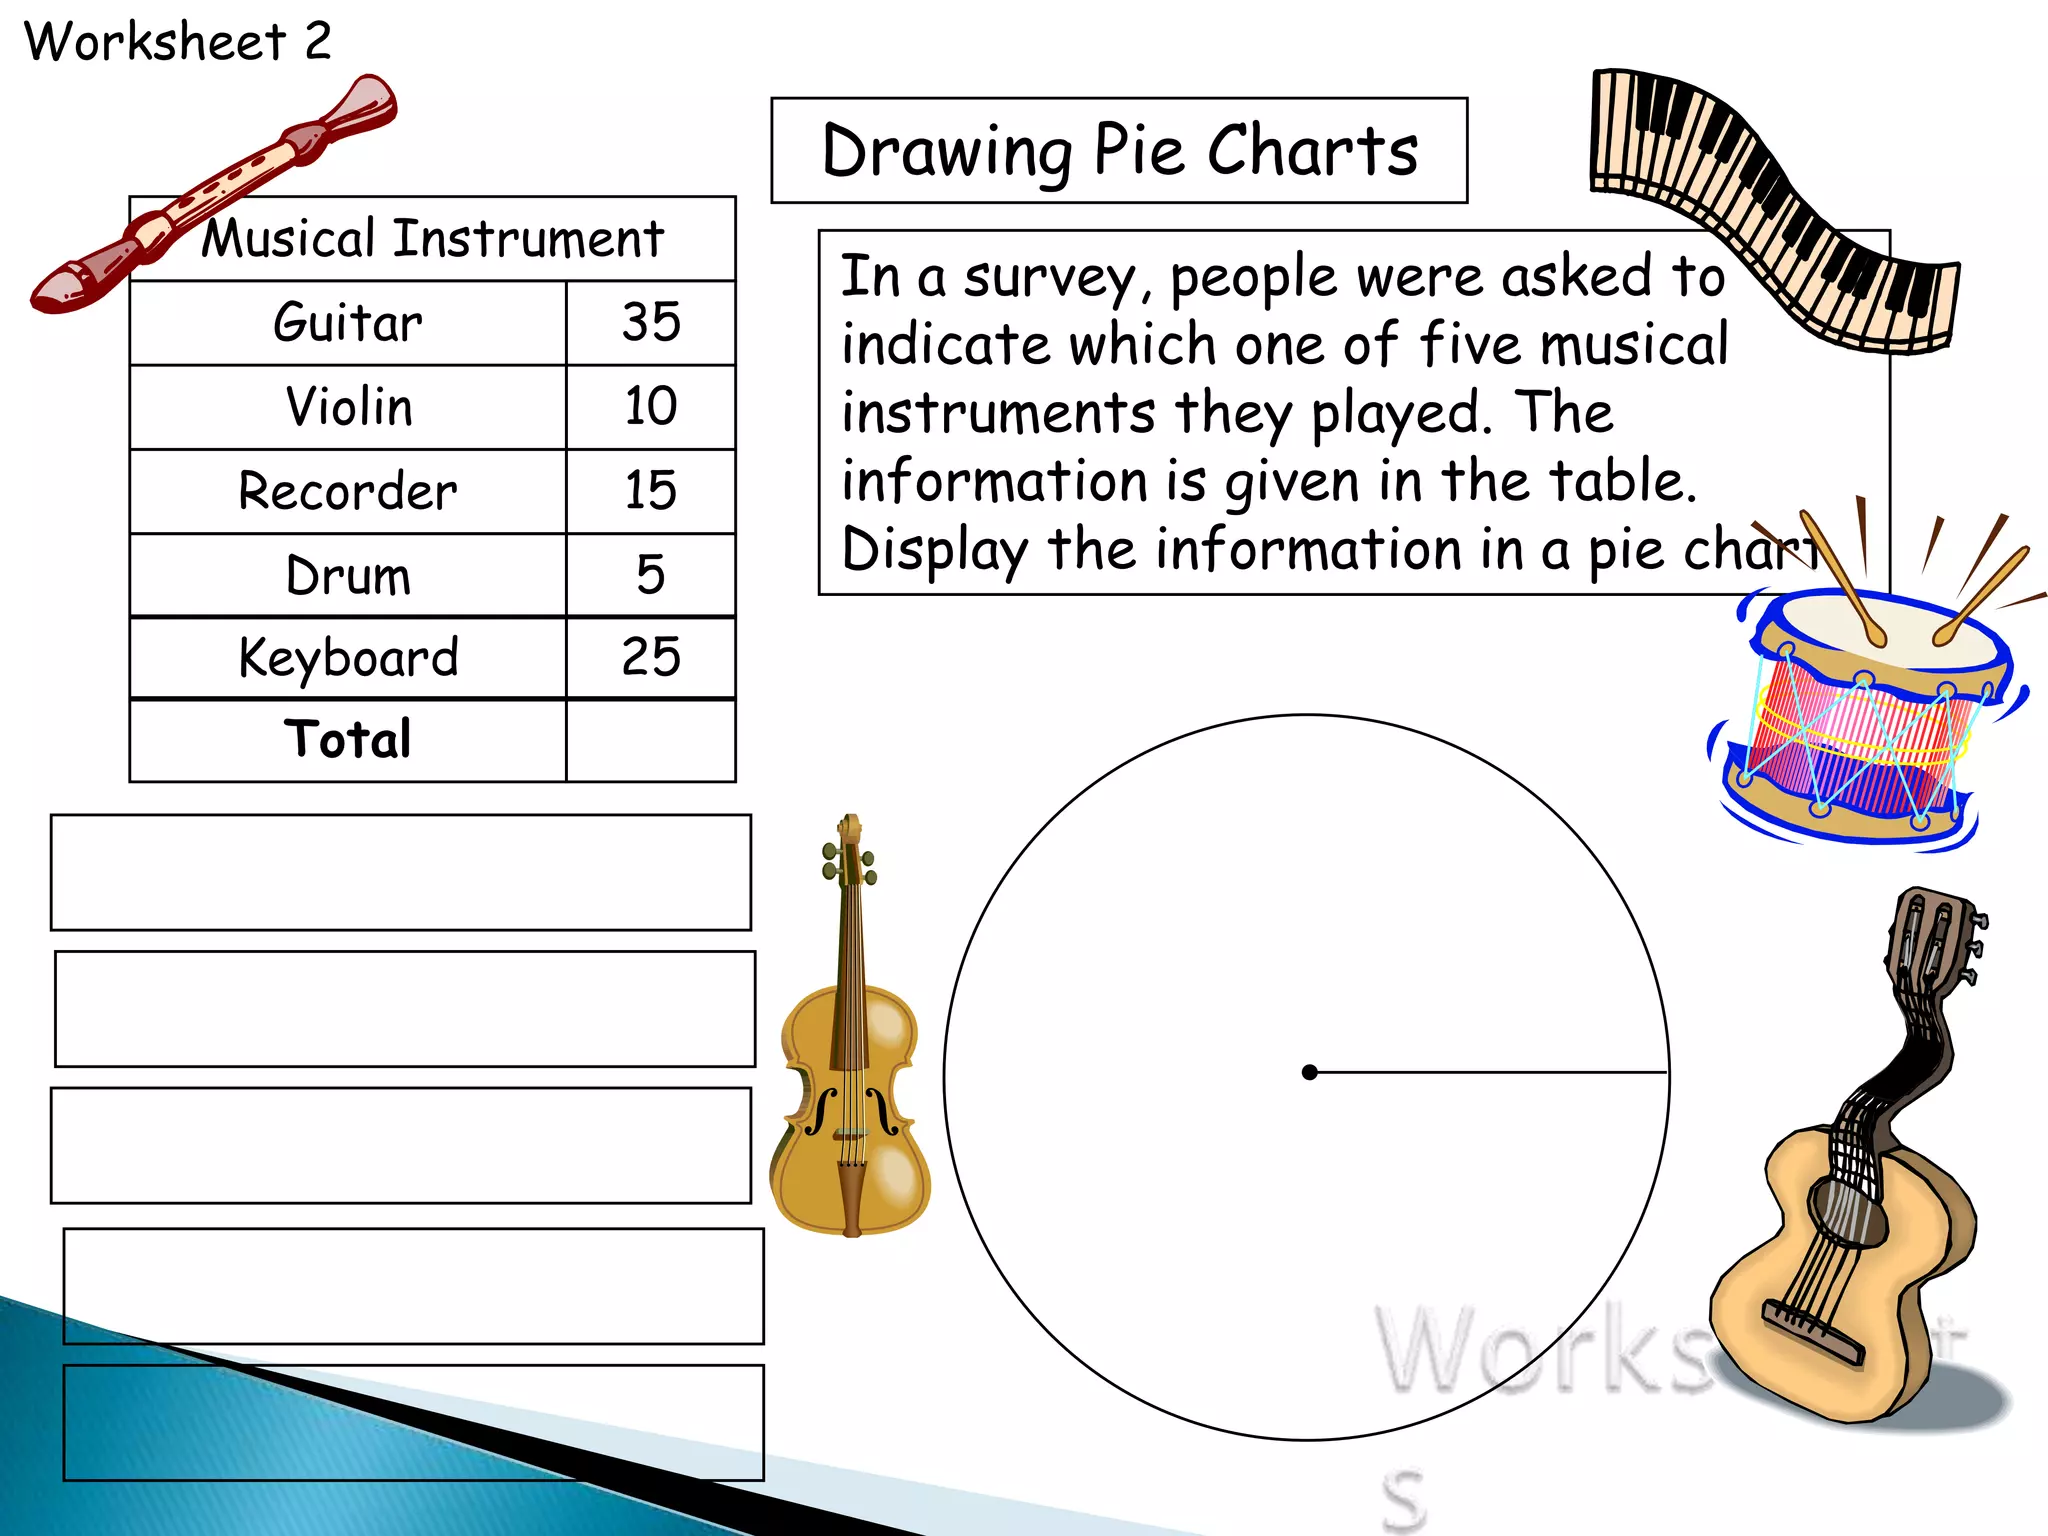
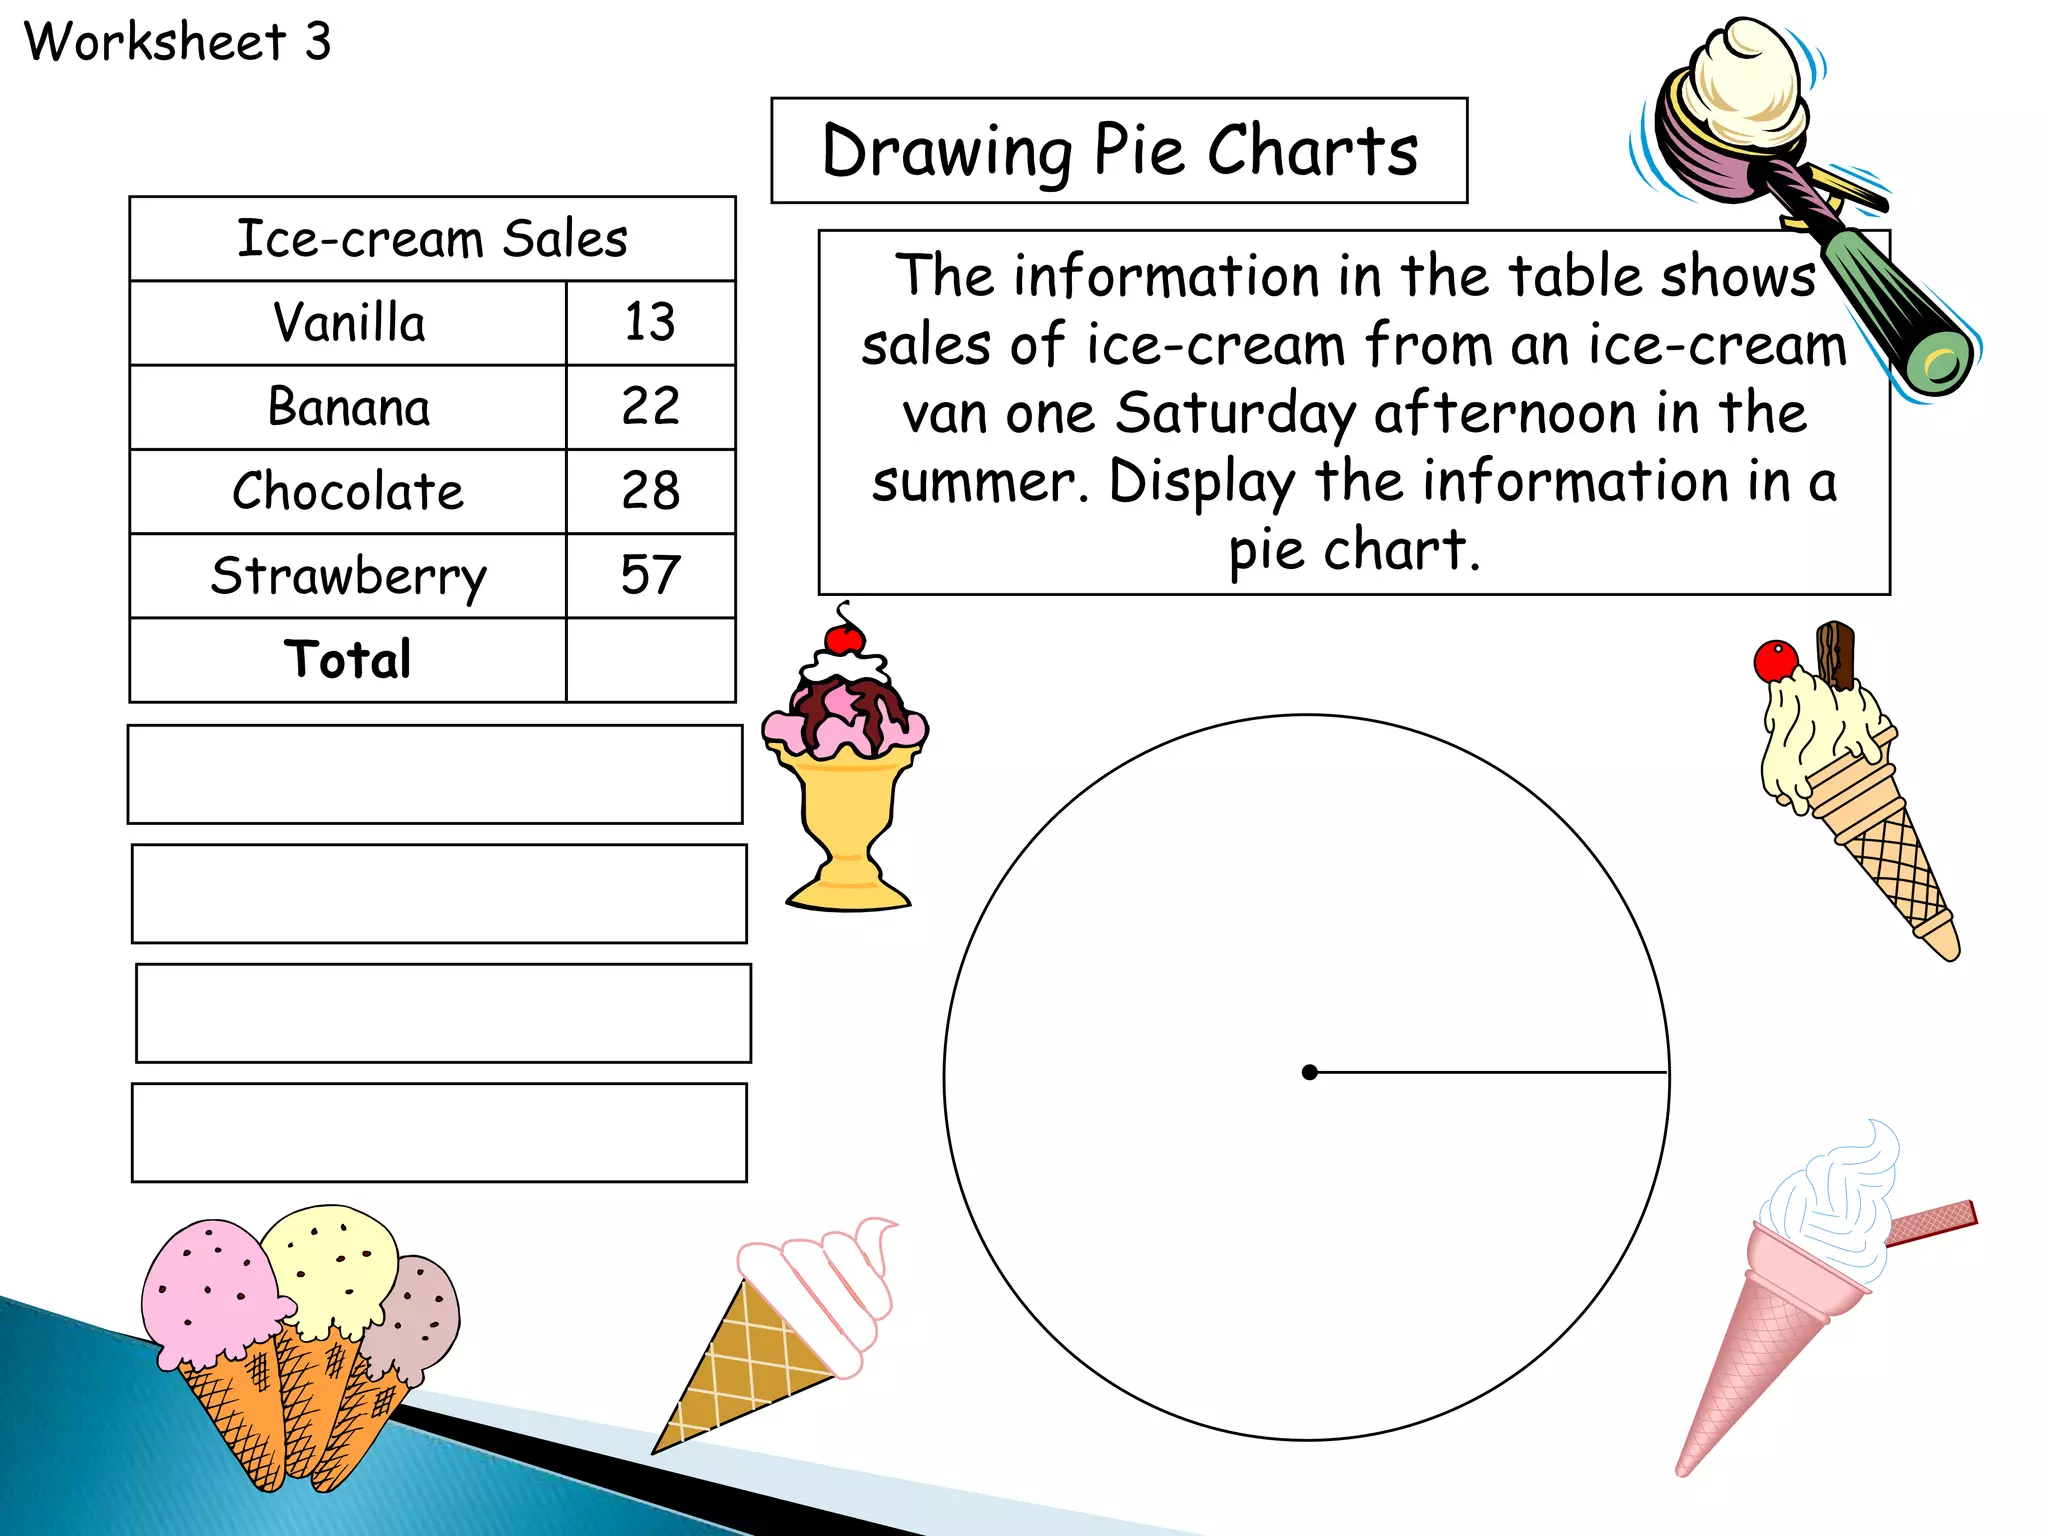
The document provides guidance on interpreting pie charts and calculating quantities represented by each slice. It includes examples of pie charts with data on drinks sold, sports favored, types of crisps sold, and musical instruments played. The user is asked to draw pie charts based on this data and complete pie charts using frequency tables.
This presentation is based on CCSS.Math.Content.5.OA.A.1 Use parentheses, brackets, or braces in numerical expressions, and evaluate expressions with these symbols.
CCSS.Math.Content.5.OA.A.2 Write simple expressions that record calculations with numbers, and interpret numerical expressions without evaluating them. For example, express the calculation “add 8 and 7, then multiply by 2” as 2 × (8 + 7). Recognize that 3 × (18932 + 921) is three times as large as 18932 + 921, without having to calculate the indicated sum or product
http://bit.ly/1LTzAo6
This video describes what are integers. It also shows how integers are represented on a number line.
For a full FREE video on Integers, please visit http://bit.ly/1LTzAo6
done by : ( ABCD'S &G )
alaa ba-jafar
abrar alshahranii
sahab filfilan
nada alharbi
shahd rajab
Ghadeer suwaimil
I hope that you enjoy and you benefit❤
A workshop hosted by the South African Journal of Science aimed at postgraduate students and early career researchers with little or no experience in writing and publishing journal articles.
This presentation was provided by Steph Pollock of The American Psychological Association’s Journals Program, and Damita Snow, of The American Society of Civil Engineers (ASCE), for the initial session of NISO's 2024 Training Series "DEIA in the Scholarly Landscape." Session One: 'Setting Expectations: a DEIA Primer,' was held June 6, 2024.
How to Manage Your Lost Opportunities in Odoo 17 CRMCeline George
Odoo 17 CRM allows us to track why we lose sales opportunities with "Lost Reasons." This helps analyze our sales process and identify areas for improvement. Here's how to configure lost reasons in Odoo 17 CRM
it describes the bony anatomy including the femoral head , acetabulum, labrum . also discusses the capsule , ligaments . muscle that act on the hip joint and the range of motion are outlined. factors affecting hip joint stability and weight transmission through the joint are summarized.
Thinking of getting a dog? Be aware that breeds like Pit Bulls, Rottweilers, and German Shepherds can be loyal and dangerous. Proper training and socialization are crucial to preventing aggressive behaviors. Ensure safety by understanding their needs and always supervising interactions. Stay safe, and enjoy your furry friends!
June 3, 2024 Anti-Semitism Letter Sent to MIT President Kornbluth and MIT Cor...Levi Shapiro
Letter from the Congress of the United States regarding Anti-Semitism sent June 3rd to MIT President Sally Kornbluth, MIT Corp Chair, Mark Gorenberg
Dear Dr. Kornbluth and Mr. Gorenberg,
The US House of Representatives is deeply concerned by ongoing and pervasive acts of antisemitic
harassment and intimidation at the Massachusetts Institute of Technology (MIT). Failing to act decisively to ensure a safe learning environment for all students would be a grave dereliction of your responsibilities as President of MIT and Chair of the MIT Corporation.
This Congress will not stand idly by and allow an environment hostile to Jewish students to persist. The House believes that your institution is in violation of Title VI of the Civil Rights Act, and the inability or
unwillingness to rectify this violation through action requires accountability.
Postsecondary education is a unique opportunity for students to learn and have their ideas and beliefs challenged. However, universities receiving hundreds of millions of federal funds annually have denied
students that opportunity and have been hijacked to become venues for the promotion of terrorism, antisemitic harassment and intimidation, unlawful encampments, and in some cases, assaults and riots.
The House of Representatives will not countenance the use of federal funds to indoctrinate students into hateful, antisemitic, anti-American supporters of terrorism. Investigations into campus antisemitism by the Committee on Education and the Workforce and the Committee on Ways and Means have been expanded into a Congress-wide probe across all relevant jurisdictions to address this national crisis. The undersigned Committees will conduct oversight into the use of federal funds at MIT and its learning environment under authorities granted to each Committee.
• The Committee on Education and the Workforce has been investigating your institution since December 7, 2023. The Committee has broad jurisdiction over postsecondary education, including its compliance with Title VI of the Civil Rights Act, campus safety concerns over disruptions to the learning environment, and the awarding of federal student aid under the Higher Education Act.
• The Committee on Oversight and Accountability is investigating the sources of funding and other support flowing to groups espousing pro-Hamas propaganda and engaged in antisemitic harassment and intimidation of students. The Committee on Oversight and Accountability is the principal oversight committee of the US House of Representatives and has broad authority to investigate “any matter” at “any time” under House Rule X.
• The Committee on Ways and Means has been investigating several universities since November 15, 2023, when the Committee held a hearing entitled From Ivory Towers to Dark Corners: Investigating the Nexus Between Antisemitism, Tax-Exempt Universities, and Terror Financing. The Committee followed the hearing with letters to those institutions on January 10, 202
This presentation includes basic of PCOS their pathology and treatment and also Ayurveda correlation of PCOS and Ayurvedic line of treatment mentioned in classics.
Macroeconomics- Movie Location
This will be used as part of your Personal Professional Portfolio once graded.
Objective:
Prepare a presentation or a paper using research, basic comparative analysis, data organization and application of economic information. You will make an informed assessment of an economic climate outside of the United States to accomplish an entertainment industry objective.
How to Build a Module in Odoo 17 Using the Scaffold MethodCeline George
Odoo provides an option for creating a module by using a single line command. By using this command the user can make a whole structure of a module. It is very easy for a beginner to make a module. There is no need to make each file manually. This slide will show how to create a module using the scaffold method.
A review of the growth of the Israel Genealogy Research Association Database Collection for the last 12 months. Our collection is now passed the 3 million mark and still growing. See which archives have contributed the most. See the different types of records we have, and which years have had records added. You can also see what we have for the future.
1. Do not worry about your difficulties in Mathematics. I can
assure you mine are still greater.
Albert Einstein
.
2. 108
Tea sold = 540
3
6
60
1 2x
84
Coffee sold = 540 2
360
1 6x
36
Chocolate sold = 54
0
50
36
4x
60
Cola sold = 540
3
9
60
0x
24
Milk = 540
3
3
60
6x
48
Squash = 540
3
7
60
2x
Interpreting Pie Charts
Pie charts can be thought of as circle graphs. To calculate the
quantities represented by each slice of the pie chart we need to
take the angular fraction of the given total.
Tea
Coffee
Cola
Squash
Milk
Chocolate
108o
84o
60o
48o 36o
24o
360o
A drinks machine dispenses 540 drinks on a Monday. The
information is displayed in the pie chart. Use the
information to find the number of each drink sold.
3. 75
90
45
60
30
Total 300
Rugby
Football
Cricket
Ice Hockey
Favourite Sport
Squash
90o
108o
54o
72o
36o
Interpreting Pie Charts
In a survey, 300 people were asked to
indicate which one of five sports they
liked best. The information is
displayed in the pie chart. Calculate
the number of people who chose each
sport.
90
Rugby = 300
3
7
60
5x
108
Football = 300
36
9
0
0x
54
Cricket = 300
3
4
60
5x
72
Ice Hockey = 30
0
60
36
0x
36
Squash = 300
3
3
60
0x
4. 46
Plain = 144
3
4
60
6x
40
Chicken = 144
3
1
60
6x
46
16
22
26
34
Total 144
Interpreting Pie Charts
The information in the pie chart shows
the sales of 144 packets of crisps
from a shop. Calculate the number of
each type sold.
Plain
Chicken
Salt & V
Cheese & On
Crisp Sales
Smokey Bacon
115o40o
55o
65o
85o55
Salt & V = 144
3
2
60
2x
65
Cheese & Onion = 14
0
24
36
6x
85
Smokey Bacon = 14
0
34
36
4x
6. Total 90
35
Guitar angle = 360 0
90
14 o
x
10
Violin angle = 36 00
90
4 o
x
15
Recorder angle = 36 00
90
6 o
x
5
Drum angle = 360 0
90
2 o
x
25
Keyboard angle = 360 0
90
10 o
x
Drawing Pie Charts
In a survey, people were asked to
indicate which one of five musical
instruments they played. The
information is given in the table.
Display the information in a pie chart.
Guitar
Violin
Recorder
Drum
35
10
15
5
Musical Instrument
Keyboard 25
7. Total 90
35
Guitar angle = 360 0
90
14 o
x
10
Violin angle = 36 00
90
4 o
x
15
Recorder angle = 36 00
90
6 o
x
5
Drum angle = 360 0
90
2 o
x
25
Keyboard angle = 360 0
90
10 o
x
Drawing Pie Charts
In a survey, people were asked to
indicate which one of five musical
instruments they played. The
information is given in the table.
Display the information in a pie chart.
Guitar
Violin
Recorder
Drum
35
10
15
5
Musical Instrument
Keyboard 25
8. Total 90
Drawing Pie Charts
In a survey, people were asked to
indicate which one of five musical
instruments they played. The
information is given in the table.
Display the information in a pie chart.
Guitar
Violin
Recorder
Drum
35
10
15
5
Musical Instrument
Keyboard 25
35
Guitar angle = 360 0
90
14 o
x
10
Violin angle = 36 00
90
4 o
x
15
Recorder angle = 36 00
90
6 o
x
5
Drum angle = 360 0
90
2 o
x
25
Keyboard angle = 360 0
90
10 o
x
9. Total 90
Drawing Pie Charts
In a survey, people were asked to
indicate which one of five musical
instruments they played. The
information is given in the table.
Display the information in a pie chart.
Guitar
Violin
Recorder
Drum
35
10
15
5
Musical Instrument
Keyboard 25
35
Guitar angle = 360 0
90
14 o
x
10
Violin angle = 36 00
90
4 o
x
15
Recorder angle = 36 00
90
6 o
x
5
Drum angle = 360 0
90
2 o
x
25
Keyboard angle = 360 0
90
10 o
x
10. Total 90
Drawing Pie Charts
In a survey, people were asked to
indicate which one of five musical
instruments they played. The
information is given in the table.
Display the information in a pie chart.
Guitar
Violin
Recorder
Drum
35
10
15
5
Musical Instrument
Keyboard 25
35
Guitar angle = 360 0
90
14 o
x
10
Violin angle = 36 00
90
4 o
x
15
Recorder angle = 36 00
90
6 o
x
5
Drum angle = 360 0
90
2 o
x
25
Keyboard angle = 360 0
90
10 o
x
11. Total 90
Drawing Pie Charts
In a survey, people were asked to
indicate which one of five musical
instruments they played. The
information is given in the table.
Display the information in a pie chart.
Guitar
Violin
Recorder
Drum
35
10
15
5
Musical Instrument
Keyboard 25
35
Guitar angle = 360 0
90
14 o
x
10
Violin angle = 36 00
90
4 o
x
15
Recorder angle = 36 00
90
6 o
x
5
Drum angle = 360 0
90
2 o
x
25
Keyboard angle = 360 0
90
10 o
x
12. Total 90
Drawing Pie Charts
In a survey, people were asked to
indicate which one of five musical
instruments they played. The
information is given in the table.
Display the information in a pie chart.
Guitar
Violin
Recorder
Drum
35
10
15
5
Musical Instrument
Keyboard 25
35
Guitar angle = 360 0
90
14 o
x
10
Violin angle = 36 00
90
4 o
x
15
Recorder angle = 36 00
90
6 o
x
5
Drum angle = 360 0
90
2 o
x
25
Keyboard angle = 360 0
90
10 o
x
13. Total 90
Drawing Pie Charts
In a survey, people were asked to
indicate which one of five musical
instruments they played. The
information is given in the table.
Display the information in a pie chart.
Guitar
Violin
Recorder
Drum
35
10
15
5
Musical Instrument
Keyboard 25
Drum
35
Guitar angle = 360 0
90
14 o
x
10
Violin angle = 36 00
90
4 o
x
15
Recorder angle = 36 00
90
6 o
x
5
Drum angle = 360 0
90
2 o
x
25
Keyboard angle = 360 0
90
10 o
x
14. Total 90
Drawing Pie Charts
In a survey, people were asked to
indicate which one of five musical
instruments they played. The
information is given in the table.
Display the information in a pie chart.
Guitar
Violin
Recorder
Drum
35
10
15
5
Musical Instrument
Keyboard 25
140o
100o60o
40o
20o
35
Guitar angle = 360 0
90
14 o
x
10
Violin angle = 36 00
90
4 o
x
15
Recorder angle = 36 00
90
6 o
x
5
Drum angle = 360 0
90
2 o
x
25
Keyboard angle = 360 0
90
10 o
x
15. Drawing Pie Charts
Total 120
13
Vanilla angle = 360 9
120
3 o
x
Vanilla
Banana
Chocolate
Strawberry
13
22
28
57
Ice-cream Sales
The information in the table shows
sales of ice-cream from an ice-cream
van one Saturday afternoon in the
summer. Display the information in a
pie chart.
22
Banana angle = 360 6
120
6 o
x
28
Chocolate angle = 360 4
120
8 o
x
57
Strawberry angle = 360 1
12
7
0
1 o
x
16. Drawing Pie Charts
Total 120
Vanilla
Banana
Chocolate
Strawberry
13
22
28
57
Ice-cream Sales
The information in the table shows
sales of ice-cream from an ice-cream
van one Saturday afternoon in the
summer. Display the information in a
pie chart.
13
Vanilla angle = 360 9
120
3 o
x
22
Banana angle = 360 6
120
6 o
x
28
Chocolate angle = 360 4
120
8 o
x
57
Strawberry angle = 360 1
12
7
0
1 o
x
17. Drawing Pie Charts
Total 120
Vanilla
Banana
Chocolate
Strawberry
13
22
28
57
Ice-cream Sales
The information in the table shows
sales of ice-cream from an ice-cream
van one Saturday afternoon in the
summer. Display the information in a
pie chart.
13
Vanilla angle = 360 9
120
3 o
x
22
Banana angle = 360 6
120
6 o
x
28
Chocolate angle = 360 4
120
8 o
x
57
Strawberry angle = 360 1
12
7
0
1 o
x
18. Drawing Pie Charts
Total 120
Vanilla
Banana
Chocolate
Strawberry
13
22
28
57
Ice-cream Sales
The information in the table shows
sales of ice-cream from an ice-cream
van one Saturday afternoon in the
summer. Display the information in a
pie chart.
13
Vanilla angle = 360 9
120
3 o
x
22
Banana angle = 360 6
120
6 o
x
28
Chocolate angle = 360 4
120
8 o
x
57
Strawberry angle = 360 1
12
7
0
1 o
x
19. Drawing Pie Charts
Total 120
Vanilla
Banana
Chocolate
Strawberry
13
22
28
57
Ice-cream Sales
The information in the table shows
sales of ice-cream from an ice-cream
van one Saturday afternoon in the
summer. Display the information in a
pie chart.
13
Vanilla angle = 360 9
120
3 o
x
22
Banana angle = 360 6
120
6 o
x
28
Chocolate angle = 360 4
120
8 o
x
57
Strawberry angle = 360 1
12
7
0
1 o
x
20. Drawing Pie Charts
Total 120
Vanilla
Banana
Chocolate
Strawberry
13
22
28
57
Ice-cream Sales
The information in the table shows
sales of ice-cream from an ice-cream
van one Saturday afternoon in the
summer. Display the information in a
pie chart.
13
Vanilla angle = 360 9
120
3 o
x
22
Banana angle = 360 6
120
6 o
x
28
Chocolate angle = 360 4
120
8 o
x
57
Strawberry angle = 360 1
12
7
0
1 o
x
21. Drawing Pie Charts
Total 120
Vanilla
Banana
Chocolate
Strawberry
13
22
28
57
Ice-cream Sales
The information in the table shows
sales of ice-cream from an ice-cream
van one Saturday afternoon in the
summer. Display the information in a
pie chart.
39o
66o
84o
171o
13
Vanilla angle = 360 9
120
3 o
x
22
Banana angle = 360 6
120
6 o
x
28
Chocolate angle = 360 4
120
8 o
x
57
Strawberry angle = 360 1
12
7
0
1 o
x
22. Use the data in the frequency table to complete the pie chart
showing the favourite colours of a sample of people.
No of
people
10
3
14
5
4
Favourite
colour
Red
Yellow
Blue
Green
Purple
Total 36
23. Use the data in the frequency table to complete the pie chart
showing the holiday destinations of a sample of people.
Holiday
destination
No of
people
UK 74
Europe 53
America 32
Asia 11
Other 10
Total 180
24. Total
Drawing Pie Charts
In a survey, people were asked to
indicate which one of five musical
instruments they played. The
information is given in the table.
Display the information in a pie chart.
Guitar
Violin
Recorder
Drum
35
10
15
5
Musical Instrument
Keyboard 25
Worksheet 2