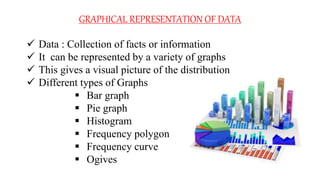
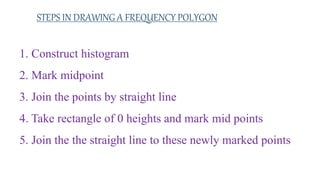
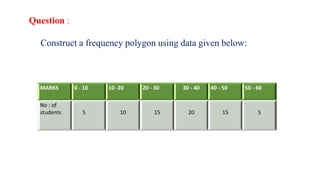
This document discusses frequency polygons, which are a type of graphical representation of data that involves joining midpoints of histogram rectangles or data points with straight lines to form a polygon. Key details include: frequency polygons can be constructed from histograms or without histograms; they show the distribution of data by having point heights represent frequencies; and involve terms like class intervals, frequencies, midpoints, and class marks. Steps for drawing frequency polygons include constructing a histogram, marking midpoints, and joining points with straight lines. Advantages are that they help represent and compare data distributions clearly and simply. A disadvantage is they are less accurate than histograms since each class is represented by a single point.