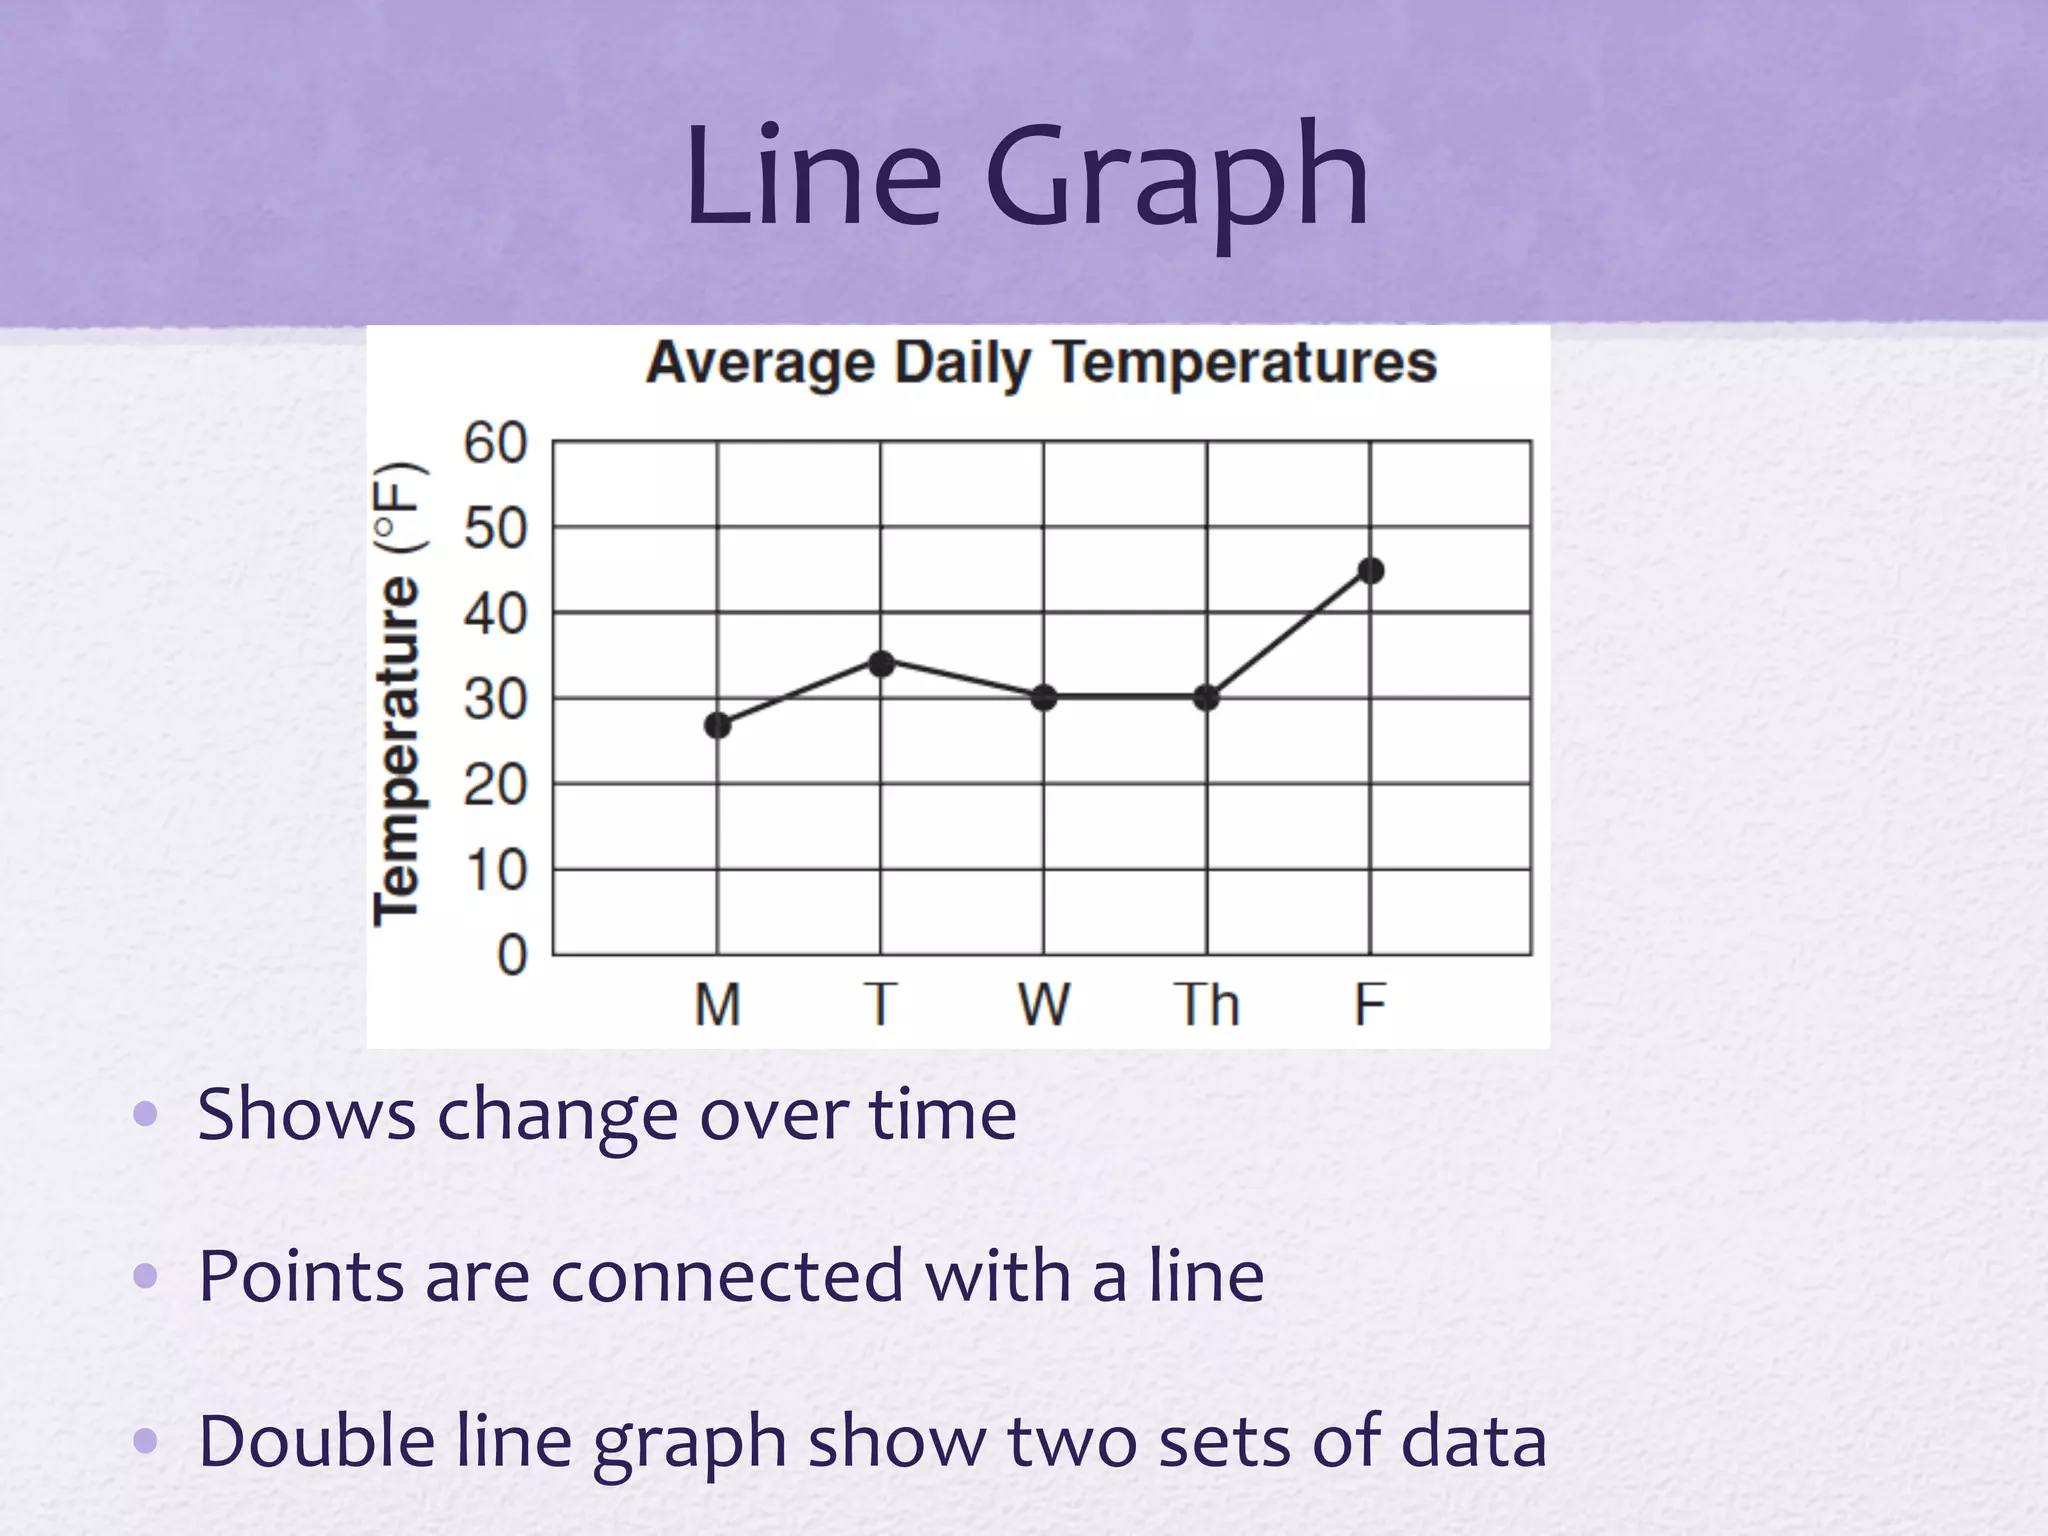
SlideShare a Scribd company logo
1 of 1
Download to read offline
Line	
  Graph	


•  Shows	
  change	
  over	
  time	
  

•  Points	
  are	
  connected	
  with	
  a	
  line	
  

•  Double	
  line	
  graph	
  show	
  two	
  sets	
  of	
  data	
  

More Related Content

Viewers also liked

Frequency table
Frequency tableFrequency table
Frequency tablelauragaren
 
Types Of Charts
Types Of ChartsTypes Of Charts
Types Of Chartswmassie
 
Introduction to graph class 8
Introduction to graph class 8Introduction to graph class 8
Introduction to graph class 8Monika Rana
 
Graphical Representation of data
Graphical Representation of dataGraphical Representation of data
Graphical Representation of dataJijo K Mathew
 
How to Make a Bar Graph
How to Make a Bar GraphHow to Make a Bar Graph
How to Make a Bar Graphjmulkey
 
Bar graphs for slideshare jwt
Bar graphs for slideshare jwtBar graphs for slideshare jwt
Bar graphs for slideshare jwtjwt1991
 
Forms of the numbers
Forms of the numbersForms of the numbers
Forms of the numbersmyriam2009
 

Viewers also liked (20)

Stem and leaf
Stem and leafStem and leaf
Stem and leaf
 
Circle graph
Circle graphCircle graph
Circle graph
 
Frequency table
Frequency tableFrequency table
Frequency table
 
Scatter diagram in tqm
Scatter diagram in tqmScatter diagram in tqm
Scatter diagram in tqm
 
Types Of Charts
Types Of ChartsTypes Of Charts
Types Of Charts
 
Introduction to graph class 8
Introduction to graph class 8Introduction to graph class 8
Introduction to graph class 8
 
Charts And Graphs
Charts And GraphsCharts And Graphs
Charts And Graphs
 
Graphical Representation of data
Graphical Representation of dataGraphical Representation of data
Graphical Representation of data
 
Multi-line Graph
Multi-line GraphMulti-line Graph
Multi-line Graph
 
Line graph
Line graphLine graph
Line graph
 
Bar graphs
Bar graphsBar graphs
Bar graphs
 
Straight line graphs
Straight line graphsStraight line graphs
Straight line graphs
 
How to Make a Bar Graph
How to Make a Bar GraphHow to Make a Bar Graph
How to Make a Bar Graph
 
Bar graphs for slideshare jwt
Bar graphs for slideshare jwtBar graphs for slideshare jwt
Bar graphs for slideshare jwt
 
Line plot
Line plotLine plot
Line plot
 
Forms of the numbers
Forms of the numbersForms of the numbers
Forms of the numbers
 
Intro to the line graph
Intro to the line graphIntro to the line graph
Intro to the line graph
 
Graphs in science
Graphs in scienceGraphs in science
Graphs in science
 
Intro to the bar graph
Intro to the bar graphIntro to the bar graph
Intro to the bar graph
 
Presenting scientific data graphing
Presenting scientific data graphingPresenting scientific data graphing
Presenting scientific data graphing
 

Line graph

  • 1. Line  Graph   •  Shows  change  over  time   •  Points  are  connected  with  a  line   •  Double  line  graph  show  two  sets  of  data