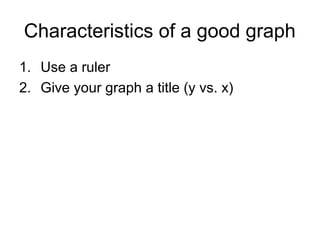
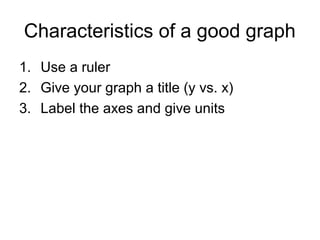
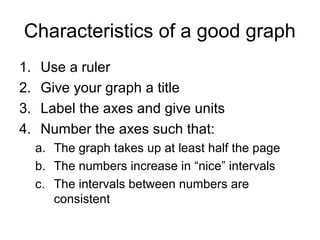
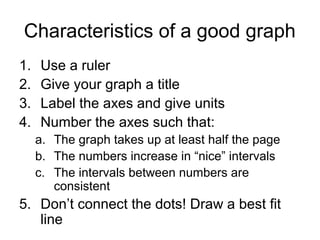
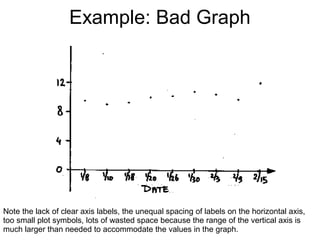
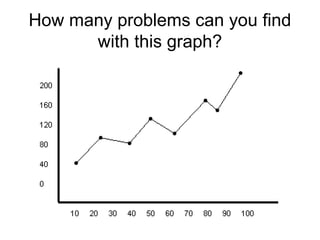
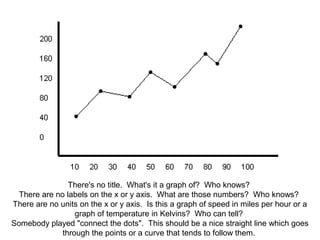
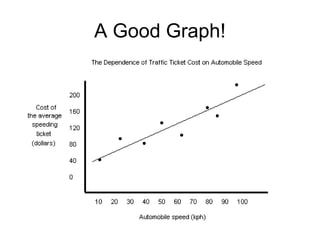
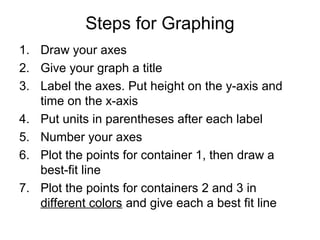
SlideShare a Scribd company logo
1 of 13
Graphing in Biology (pg 6)
Characteristics of a good graph
1. Use a ruler
Characteristics of a good graph
1. Use a ruler
2. Give your graph a title (y vs. x)
Characteristics of a good graph
1. Use a ruler
2. Give your graph a title (y vs. x)
3. Label the axes and give units
Characteristics of a good graph
1. Use a ruler
2. Give your graph a title
3. Label the axes and give units
4. Number the axes such that:
a. The graph takes up at least half the page
b. The numbers increase in “nice” intervals
c. The intervals between numbers are
consistent
Characteristics of a good graph
1. Use a ruler
2. Give your graph a title
3. Label the axes and give units
4. Number the axes such that:
a. The graph takes up at least half the page
b. The numbers increase in “nice” intervals
c. The intervals between numbers are
consistent
5. Don’t connect the dots! Draw a best fit
line
O.K. Now you’re done taking
notes. Lets look at some
examples:
Example: Bad Graph
Note the lack of clear axis labels, the unequal spacing of labels on the horizontal axis,
too small plot symbols, lots of wasted space because the range of the vertical axis is
much larger than needed to accommodate the values in the graph.
How many problems can you find
with this graph?
you
There's no title. What's it a graph of? Who knows?
There are no labels on the x or y axis. What are those numbers? Who knows?
There are no units on the x or y axis. Is this a graph of speed in miles per hour or a
graph of temperature in Kelvins? Who can tell?
Somebody played "connect the dots". This should be a nice straight line which goes
through the points or a curve that tends to follow them.
A Good Graph!
Output
• Paste the provided data on the top of
page 7 of your interactive notes
• Below that, graph the data using all the
characteristics of a good graph
Steps for Graphing
1. Draw your axes
2. Give your graph a title
3. Label the axes. Put height on the y-axis and
time on the x-axis
4. Put units in parentheses after each label
5. Number your axes
6. Plot the points for container 1, then draw a
best-fit line
7. Plot the points for containers 2 and 3 in
different colors and give each a best fit line

More Related Content

Similar to Graphing Biology Characteristics Guide

1.4 revision week session
1.4 revision week session1.4 revision week session
1.4 revision week sessionTaka Geo
 
4-types-of-graphs.pptx
4-types-of-graphs.pptx4-types-of-graphs.pptx
4-types-of-graphs.pptxMJGamboa2
 
Coordinate graphing project transformations
Coordinate graphing project  transformationsCoordinate graphing project  transformations
Coordinate graphing project transformationsEducation1st
 
A19-3 graphing quadratics
A19-3 graphing quadraticsA19-3 graphing quadratics
A19-3 graphing quadraticsvhiggins1
 
COT-1-QUADRILATERALS THAT ARE PARALLELOGRAM.pptx
COT-1-QUADRILATERALS THAT ARE PARALLELOGRAM.pptxCOT-1-QUADRILATERALS THAT ARE PARALLELOGRAM.pptx
COT-1-QUADRILATERALS THAT ARE PARALLELOGRAM.pptxArgel Dalwampo
 
Displaying data using charts and graphs
Displaying data using charts and graphsDisplaying data using charts and graphs
Displaying data using charts and graphsCharles Flynt
 
DATA GRAPHICS -REPRESENTATION OF DATA
DATA GRAPHICS -REPRESENTATION OF DATADATA GRAPHICS -REPRESENTATION OF DATA
DATA GRAPHICS -REPRESENTATION OF DATADr-Jitendra Patel
 
Engineering Drawing: Chapter 05 pictorial sketching
Engineering Drawing: Chapter 05 pictorial sketchingEngineering Drawing: Chapter 05 pictorial sketching
Engineering Drawing: Chapter 05 pictorial sketchingmokhtar
 
Essay On Linear Function
Essay On Linear FunctionEssay On Linear Function
Essay On Linear FunctionAngie Lee
 
How to make a good graph
How to make a good graphHow to make a good graph
How to make a good graphrobtownsend
 
_4a Means-end analysis - data analysis.ppt
_4a Means-end analysis - data analysis.ppt_4a Means-end analysis - data analysis.ppt
_4a Means-end analysis - data analysis.pptRenvic
 
Variables & Patterns 1.2
Variables & Patterns 1.2Variables & Patterns 1.2
Variables & Patterns 1.2Kathy Favazza
 
G6 m3-c-lesson 17-t
G6 m3-c-lesson 17-tG6 m3-c-lesson 17-t
G6 m3-c-lesson 17-tmlabuski
 
diagrammatic and graphical representation of data
 diagrammatic and graphical representation of data diagrammatic and graphical representation of data
diagrammatic and graphical representation of dataVarun Prem Varu
 
Line graph bar graph
Line graph bar graphLine graph bar graph
Line graph bar graphAyesha Arshad
 
Grade 9 U0-L5-Graphing
Grade 9 U0-L5-GraphingGrade 9 U0-L5-Graphing
Grade 9 U0-L5-Graphinggruszecki1
 
Parabola lab day 1
Parabola lab day 1Parabola lab day 1
Parabola lab day 1cirilah
 

Similar to Graphing Biology Characteristics Guide (20)

1.4 revision week session
1.4 revision week session1.4 revision week session
1.4 revision week session
 
4-types-of-graphs.pptx
4-types-of-graphs.pptx4-types-of-graphs.pptx
4-types-of-graphs.pptx
 
Coordinate graphing project transformations
Coordinate graphing project  transformationsCoordinate graphing project  transformations
Coordinate graphing project transformations
 
Excel-bar-graph
Excel-bar-graphExcel-bar-graph
Excel-bar-graph
 
A19-3 graphing quadratics
A19-3 graphing quadraticsA19-3 graphing quadratics
A19-3 graphing quadratics
 
COT-1-QUADRILATERALS THAT ARE PARALLELOGRAM.pptx
COT-1-QUADRILATERALS THAT ARE PARALLELOGRAM.pptxCOT-1-QUADRILATERALS THAT ARE PARALLELOGRAM.pptx
COT-1-QUADRILATERALS THAT ARE PARALLELOGRAM.pptx
 
Displaying data using charts and graphs
Displaying data using charts and graphsDisplaying data using charts and graphs
Displaying data using charts and graphs
 
DATA GRAPHICS -REPRESENTATION OF DATA
DATA GRAPHICS -REPRESENTATION OF DATADATA GRAPHICS -REPRESENTATION OF DATA
DATA GRAPHICS -REPRESENTATION OF DATA
 
Engineering Drawing: Chapter 05 pictorial sketching
Engineering Drawing: Chapter 05 pictorial sketchingEngineering Drawing: Chapter 05 pictorial sketching
Engineering Drawing: Chapter 05 pictorial sketching
 
Essay On Linear Function
Essay On Linear FunctionEssay On Linear Function
Essay On Linear Function
 
Linear relations
   Linear relations   Linear relations
Linear relations
 
How to make a good graph
How to make a good graphHow to make a good graph
How to make a good graph
 
_4a Means-end analysis - data analysis.ppt
_4a Means-end analysis - data analysis.ppt_4a Means-end analysis - data analysis.ppt
_4a Means-end analysis - data analysis.ppt
 
Variables & Patterns 1.2
Variables & Patterns 1.2Variables & Patterns 1.2
Variables & Patterns 1.2
 
G6 m3-c-lesson 17-t
G6 m3-c-lesson 17-tG6 m3-c-lesson 17-t
G6 m3-c-lesson 17-t
 
diagrammatic and graphical representation of data
 diagrammatic and graphical representation of data diagrammatic and graphical representation of data
diagrammatic and graphical representation of data
 
Line graph bar graph
Line graph bar graphLine graph bar graph
Line graph bar graph
 
Symmetry
SymmetrySymmetry
Symmetry
 
Grade 9 U0-L5-Graphing
Grade 9 U0-L5-GraphingGrade 9 U0-L5-Graphing
Grade 9 U0-L5-Graphing
 
Parabola lab day 1
Parabola lab day 1Parabola lab day 1
Parabola lab day 1
 

More from stewart_j

Notes speciation
Notes speciationNotes speciation
Notes speciationstewart_j
 
Evolution of complex traits
Evolution of complex traitsEvolution of complex traits
Evolution of complex traitsstewart_j
 
Brain notes projects
Brain notes projectsBrain notes projects
Brain notes projectsstewart_j
 
Vision projects
Vision projectsVision projects
Vision projectsstewart_j
 
Notes genetic drift
Notes genetic driftNotes genetic drift
Notes genetic driftstewart_j
 
Evidence for evolution notes michaela
Evidence for evolution notes michaelaEvidence for evolution notes michaela
Evidence for evolution notes michaelastewart_j
 
Darwin notes michaela
Darwin notes michaelaDarwin notes michaela
Darwin notes michaelastewart_j
 
Diversity of life
Diversity of lifeDiversity of life
Diversity of lifestewart_j
 
Dichotomous keys
Dichotomous keysDichotomous keys
Dichotomous keysstewart_j
 
Equilibrium diagram
Equilibrium diagramEquilibrium diagram
Equilibrium diagramstewart_j
 
Hearing diagrams
Hearing diagramsHearing diagrams
Hearing diagramsstewart_j
 
Population growth notes hand written
Population growth notes hand writtenPopulation growth notes hand written
Population growth notes hand writtenstewart_j
 
Respiration notes hand written
Respiration notes hand writtenRespiration notes hand written
Respiration notes hand writtenstewart_j
 
Photosynthesis notes hand written
Photosynthesis notes hand writtenPhotosynthesis notes hand written
Photosynthesis notes hand writtenstewart_j
 
Photosyn and respiration
Photosyn and respirationPhotosyn and respiration
Photosyn and respirationstewart_j
 
Characteristics of life2012
Characteristics of life2012Characteristics of life2012
Characteristics of life2012stewart_j
 
Adrenal, pancreas, pineal, etc
Adrenal, pancreas, pineal, etcAdrenal, pancreas, pineal, etc
Adrenal, pancreas, pineal, etcstewart_j
 

More from stewart_j (20)

Notes speciation
Notes speciationNotes speciation
Notes speciation
 
Evolution of complex traits
Evolution of complex traitsEvolution of complex traits
Evolution of complex traits
 
Brain notes projects
Brain notes projectsBrain notes projects
Brain notes projects
 
Vision projects
Vision projectsVision projects
Vision projects
 
Notes genetic drift
Notes genetic driftNotes genetic drift
Notes genetic drift
 
Evidence for evolution notes michaela
Evidence for evolution notes michaelaEvidence for evolution notes michaela
Evidence for evolution notes michaela
 
Darwin notes michaela
Darwin notes michaelaDarwin notes michaela
Darwin notes michaela
 
Diversity of life
Diversity of lifeDiversity of life
Diversity of life
 
Dichotomous keys
Dichotomous keysDichotomous keys
Dichotomous keys
 
Eye diagram
Eye diagramEye diagram
Eye diagram
 
Equilibrium diagram
Equilibrium diagramEquilibrium diagram
Equilibrium diagram
 
Hearing diagrams
Hearing diagramsHearing diagrams
Hearing diagrams
 
Population growth notes hand written
Population growth notes hand writtenPopulation growth notes hand written
Population growth notes hand written
 
Respiration notes hand written
Respiration notes hand writtenRespiration notes hand written
Respiration notes hand written
 
Photosynthesis notes hand written
Photosynthesis notes hand writtenPhotosynthesis notes hand written
Photosynthesis notes hand written
 
Photosyn and respiration
Photosyn and respirationPhotosyn and respiration
Photosyn and respiration
 
Pcr
PcrPcr
Pcr
 
Characteristics of life2012
Characteristics of life2012Characteristics of life2012
Characteristics of life2012
 
Adrenal, pancreas, pineal, etc
Adrenal, pancreas, pineal, etcAdrenal, pancreas, pineal, etc
Adrenal, pancreas, pineal, etc
 
Thyroid
ThyroidThyroid
Thyroid
 

Recently uploaded

RESPIRATORY ADAPTATIONS TO HYPOXIA IN HUMNAS.pptx
RESPIRATORY ADAPTATIONS TO HYPOXIA IN HUMNAS.pptxRESPIRATORY ADAPTATIONS TO HYPOXIA IN HUMNAS.pptx
RESPIRATORY ADAPTATIONS TO HYPOXIA IN HUMNAS.pptxFarihaAbdulRasheed
 
Pests of castor_Binomics_Identification_Dr.UPR.pdf
Pests of castor_Binomics_Identification_Dr.UPR.pdfPests of castor_Binomics_Identification_Dr.UPR.pdf
Pests of castor_Binomics_Identification_Dr.UPR.pdfPirithiRaju
 
TOPIC 8 Temperature and Heat.pdf physics
TOPIC 8 Temperature and Heat.pdf physicsTOPIC 8 Temperature and Heat.pdf physics
TOPIC 8 Temperature and Heat.pdf physicsssuserddc89b
 
Vision and reflection on Mining Software Repositories research in 2024
Vision and reflection on Mining Software Repositories research in 2024Vision and reflection on Mining Software Repositories research in 2024
Vision and reflection on Mining Software Repositories research in 2024AyushiRastogi48
 
Is RISC-V ready for HPC workload? Maybe?
Is RISC-V ready for HPC workload? Maybe?Is RISC-V ready for HPC workload? Maybe?
Is RISC-V ready for HPC workload? Maybe?Patrick Diehl
 
Analytical Profile of Coleus Forskohlii | Forskolin .pdf
Analytical Profile of Coleus Forskohlii | Forskolin .pdfAnalytical Profile of Coleus Forskohlii | Forskolin .pdf
Analytical Profile of Coleus Forskohlii | Forskolin .pdfSwapnil Therkar
 
Best Call Girls In Sector 29 Gurgaon❤️8860477959 EscorTs Service In 24/7 Delh...
Best Call Girls In Sector 29 Gurgaon❤️8860477959 EscorTs Service In 24/7 Delh...Best Call Girls In Sector 29 Gurgaon❤️8860477959 EscorTs Service In 24/7 Delh...
Best Call Girls In Sector 29 Gurgaon❤️8860477959 EscorTs Service In 24/7 Delh...lizamodels9
 
THE ROLE OF PHARMACOGNOSY IN TRADITIONAL AND MODERN SYSTEM OF MEDICINE.pptx
THE ROLE OF PHARMACOGNOSY IN TRADITIONAL AND MODERN SYSTEM OF MEDICINE.pptxTHE ROLE OF PHARMACOGNOSY IN TRADITIONAL AND MODERN SYSTEM OF MEDICINE.pptx
THE ROLE OF PHARMACOGNOSY IN TRADITIONAL AND MODERN SYSTEM OF MEDICINE.pptxNandakishor Bhaurao Deshmukh
 
Evidences of Evolution General Biology 2
Evidences of Evolution General Biology 2Evidences of Evolution General Biology 2
Evidences of Evolution General Biology 2John Carlo Rollon
 
STOPPED FLOW METHOD & APPLICATION MURUGAVENI B.pptx
STOPPED FLOW METHOD & APPLICATION MURUGAVENI B.pptxSTOPPED FLOW METHOD & APPLICATION MURUGAVENI B.pptx
STOPPED FLOW METHOD & APPLICATION MURUGAVENI B.pptxMurugaveni B
 
Pests of jatropha_Bionomics_identification_Dr.UPR.pdf
Pests of jatropha_Bionomics_identification_Dr.UPR.pdfPests of jatropha_Bionomics_identification_Dr.UPR.pdf
Pests of jatropha_Bionomics_identification_Dr.UPR.pdfPirithiRaju
 
zoogeography of pakistan.pptx fauna of Pakistan
zoogeography of pakistan.pptx fauna of Pakistanzoogeography of pakistan.pptx fauna of Pakistan
zoogeography of pakistan.pptx fauna of Pakistanzohaibmir069
 
Recombinant DNA technology( Transgenic plant and animal)
Recombinant DNA technology( Transgenic plant and animal)Recombinant DNA technology( Transgenic plant and animal)
Recombinant DNA technology( Transgenic plant and animal)DHURKADEVIBASKAR
 
Bentham & Hooker's Classification. along with the merits and demerits of the ...
Bentham & Hooker's Classification. along with the merits and demerits of the ...Bentham & Hooker's Classification. along with the merits and demerits of the ...
Bentham & Hooker's Classification. along with the merits and demerits of the ...Nistarini College, Purulia (W.B) India
 
Behavioral Disorder: Schizophrenia & it's Case Study.pdf
Behavioral Disorder: Schizophrenia & it's Case Study.pdfBehavioral Disorder: Schizophrenia & it's Case Study.pdf
Behavioral Disorder: Schizophrenia & it's Case Study.pdfSELF-EXPLANATORY
 
Grafana in space: Monitoring Japan's SLIM moon lander in real time
Grafana in space: Monitoring Japan's SLIM moon lander  in real timeGrafana in space: Monitoring Japan's SLIM moon lander  in real time
Grafana in space: Monitoring Japan's SLIM moon lander in real timeSatoshi NAKAHIRA
 
(9818099198) Call Girls In Noida Sector 14 (NOIDA ESCORTS)
(9818099198) Call Girls In Noida Sector 14 (NOIDA ESCORTS)(9818099198) Call Girls In Noida Sector 14 (NOIDA ESCORTS)
(9818099198) Call Girls In Noida Sector 14 (NOIDA ESCORTS)riyaescorts54
 
OECD bibliometric indicators: Selected highlights, April 2024
OECD bibliometric indicators: Selected highlights, April 2024OECD bibliometric indicators: Selected highlights, April 2024
OECD bibliometric indicators: Selected highlights, April 2024innovationoecd
 

Recently uploaded (20)

RESPIRATORY ADAPTATIONS TO HYPOXIA IN HUMNAS.pptx
RESPIRATORY ADAPTATIONS TO HYPOXIA IN HUMNAS.pptxRESPIRATORY ADAPTATIONS TO HYPOXIA IN HUMNAS.pptx
RESPIRATORY ADAPTATIONS TO HYPOXIA IN HUMNAS.pptx
 
Pests of castor_Binomics_Identification_Dr.UPR.pdf
Pests of castor_Binomics_Identification_Dr.UPR.pdfPests of castor_Binomics_Identification_Dr.UPR.pdf
Pests of castor_Binomics_Identification_Dr.UPR.pdf
 
TOPIC 8 Temperature and Heat.pdf physics
TOPIC 8 Temperature and Heat.pdf physicsTOPIC 8 Temperature and Heat.pdf physics
TOPIC 8 Temperature and Heat.pdf physics
 
Vision and reflection on Mining Software Repositories research in 2024
Vision and reflection on Mining Software Repositories research in 2024Vision and reflection on Mining Software Repositories research in 2024
Vision and reflection on Mining Software Repositories research in 2024
 
Volatile Oils Pharmacognosy And Phytochemistry -I
Volatile Oils Pharmacognosy And Phytochemistry -IVolatile Oils Pharmacognosy And Phytochemistry -I
Volatile Oils Pharmacognosy And Phytochemistry -I
 
Is RISC-V ready for HPC workload? Maybe?
Is RISC-V ready for HPC workload? Maybe?Is RISC-V ready for HPC workload? Maybe?
Is RISC-V ready for HPC workload? Maybe?
 
Analytical Profile of Coleus Forskohlii | Forskolin .pdf
Analytical Profile of Coleus Forskohlii | Forskolin .pdfAnalytical Profile of Coleus Forskohlii | Forskolin .pdf
Analytical Profile of Coleus Forskohlii | Forskolin .pdf
 
Best Call Girls In Sector 29 Gurgaon❤️8860477959 EscorTs Service In 24/7 Delh...
Best Call Girls In Sector 29 Gurgaon❤️8860477959 EscorTs Service In 24/7 Delh...Best Call Girls In Sector 29 Gurgaon❤️8860477959 EscorTs Service In 24/7 Delh...
Best Call Girls In Sector 29 Gurgaon❤️8860477959 EscorTs Service In 24/7 Delh...
 
THE ROLE OF PHARMACOGNOSY IN TRADITIONAL AND MODERN SYSTEM OF MEDICINE.pptx
THE ROLE OF PHARMACOGNOSY IN TRADITIONAL AND MODERN SYSTEM OF MEDICINE.pptxTHE ROLE OF PHARMACOGNOSY IN TRADITIONAL AND MODERN SYSTEM OF MEDICINE.pptx
THE ROLE OF PHARMACOGNOSY IN TRADITIONAL AND MODERN SYSTEM OF MEDICINE.pptx
 
Evidences of Evolution General Biology 2
Evidences of Evolution General Biology 2Evidences of Evolution General Biology 2
Evidences of Evolution General Biology 2
 
STOPPED FLOW METHOD & APPLICATION MURUGAVENI B.pptx
STOPPED FLOW METHOD & APPLICATION MURUGAVENI B.pptxSTOPPED FLOW METHOD & APPLICATION MURUGAVENI B.pptx
STOPPED FLOW METHOD & APPLICATION MURUGAVENI B.pptx
 
Pests of jatropha_Bionomics_identification_Dr.UPR.pdf
Pests of jatropha_Bionomics_identification_Dr.UPR.pdfPests of jatropha_Bionomics_identification_Dr.UPR.pdf
Pests of jatropha_Bionomics_identification_Dr.UPR.pdf
 
zoogeography of pakistan.pptx fauna of Pakistan
zoogeography of pakistan.pptx fauna of Pakistanzoogeography of pakistan.pptx fauna of Pakistan
zoogeography of pakistan.pptx fauna of Pakistan
 
Recombinant DNA technology( Transgenic plant and animal)
Recombinant DNA technology( Transgenic plant and animal)Recombinant DNA technology( Transgenic plant and animal)
Recombinant DNA technology( Transgenic plant and animal)
 
Bentham & Hooker's Classification. along with the merits and demerits of the ...
Bentham & Hooker's Classification. along with the merits and demerits of the ...Bentham & Hooker's Classification. along with the merits and demerits of the ...
Bentham & Hooker's Classification. along with the merits and demerits of the ...
 
Behavioral Disorder: Schizophrenia & it's Case Study.pdf
Behavioral Disorder: Schizophrenia & it's Case Study.pdfBehavioral Disorder: Schizophrenia & it's Case Study.pdf
Behavioral Disorder: Schizophrenia & it's Case Study.pdf
 
Grafana in space: Monitoring Japan's SLIM moon lander in real time
Grafana in space: Monitoring Japan's SLIM moon lander  in real timeGrafana in space: Monitoring Japan's SLIM moon lander  in real time
Grafana in space: Monitoring Japan's SLIM moon lander in real time
 
(9818099198) Call Girls In Noida Sector 14 (NOIDA ESCORTS)
(9818099198) Call Girls In Noida Sector 14 (NOIDA ESCORTS)(9818099198) Call Girls In Noida Sector 14 (NOIDA ESCORTS)
(9818099198) Call Girls In Noida Sector 14 (NOIDA ESCORTS)
 
Engler and Prantl system of classification in plant taxonomy
Engler and Prantl system of classification in plant taxonomyEngler and Prantl system of classification in plant taxonomy
Engler and Prantl system of classification in plant taxonomy
 
OECD bibliometric indicators: Selected highlights, April 2024
OECD bibliometric indicators: Selected highlights, April 2024OECD bibliometric indicators: Selected highlights, April 2024
OECD bibliometric indicators: Selected highlights, April 2024
 

Graphing Biology Characteristics Guide

  • 2. Characteristics of a good graph 1. Use a ruler
  • 3. Characteristics of a good graph 1. Use a ruler 2. Give your graph a title (y vs. x)
  • 4. Characteristics of a good graph 1. Use a ruler 2. Give your graph a title (y vs. x) 3. Label the axes and give units
  • 5. Characteristics of a good graph 1. Use a ruler 2. Give your graph a title 3. Label the axes and give units 4. Number the axes such that: a. The graph takes up at least half the page b. The numbers increase in “nice” intervals c. The intervals between numbers are consistent
  • 6. Characteristics of a good graph 1. Use a ruler 2. Give your graph a title 3. Label the axes and give units 4. Number the axes such that: a. The graph takes up at least half the page b. The numbers increase in “nice” intervals c. The intervals between numbers are consistent 5. Don’t connect the dots! Draw a best fit line
  • 7. O.K. Now you’re done taking notes. Lets look at some examples:
  • 8. Example: Bad Graph Note the lack of clear axis labels, the unequal spacing of labels on the horizontal axis, too small plot symbols, lots of wasted space because the range of the vertical axis is much larger than needed to accommodate the values in the graph.
  • 9. How many problems can you find with this graph?
  • 10. you There's no title. What's it a graph of? Who knows? There are no labels on the x or y axis. What are those numbers? Who knows? There are no units on the x or y axis. Is this a graph of speed in miles per hour or a graph of temperature in Kelvins? Who can tell? Somebody played "connect the dots". This should be a nice straight line which goes through the points or a curve that tends to follow them.
  • 12. Output • Paste the provided data on the top of page 7 of your interactive notes • Below that, graph the data using all the characteristics of a good graph
  • 13. Steps for Graphing 1. Draw your axes 2. Give your graph a title 3. Label the axes. Put height on the y-axis and time on the x-axis 4. Put units in parentheses after each label 5. Number your axes 6. Plot the points for container 1, then draw a best-fit line 7. Plot the points for containers 2 and 3 in different colors and give each a best fit line