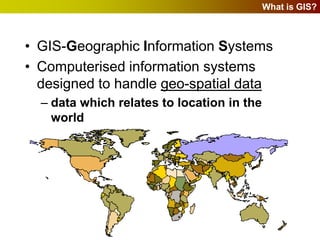
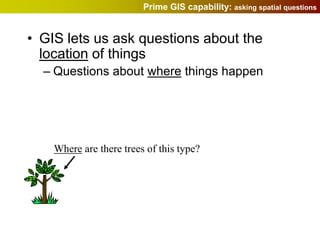
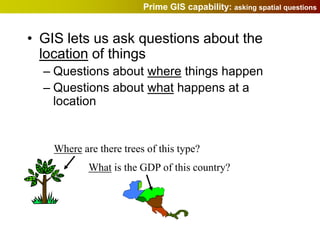
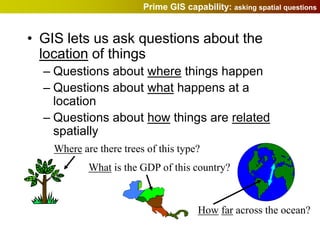
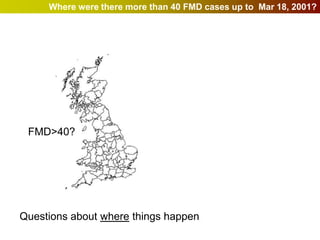
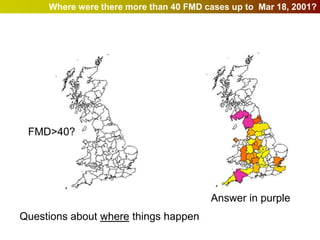
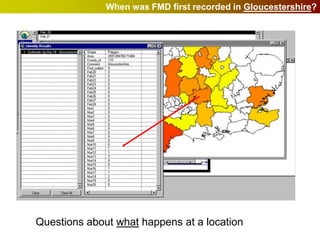
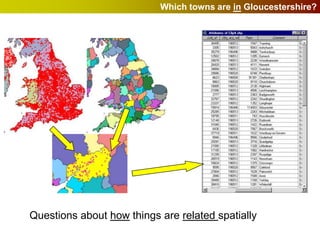
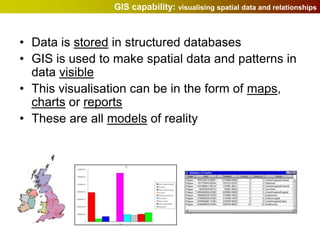
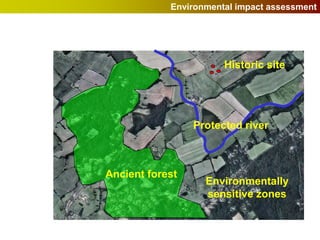
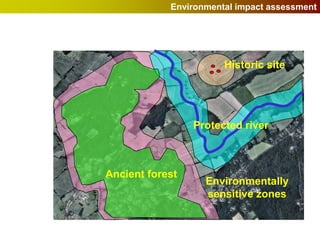
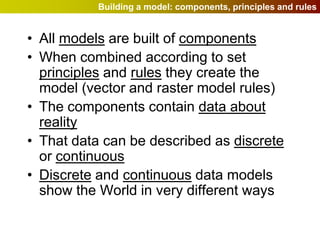
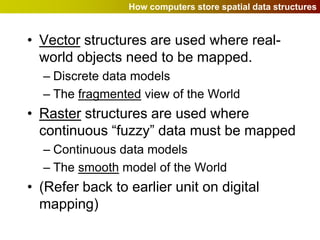
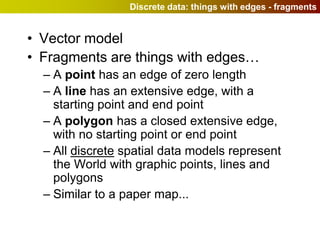
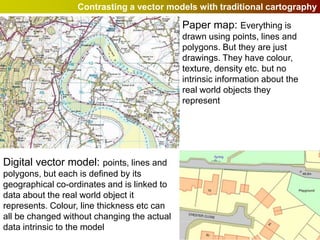
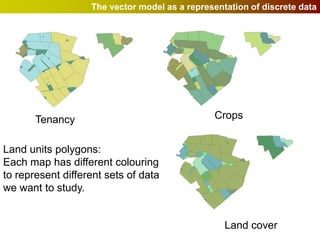
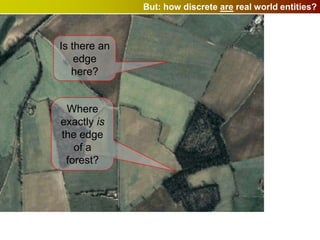
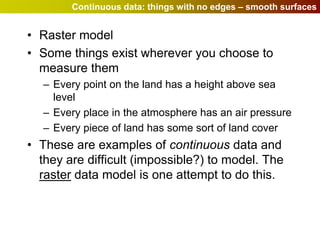
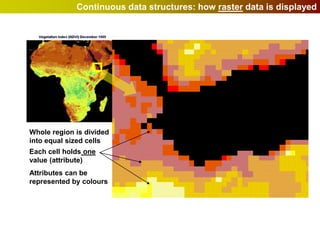
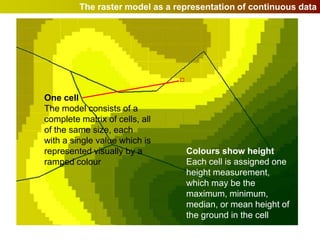
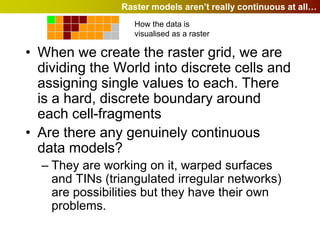
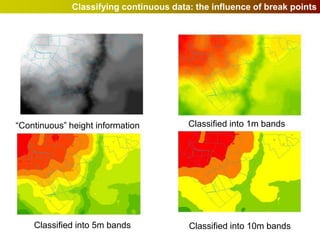
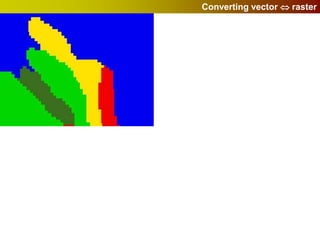
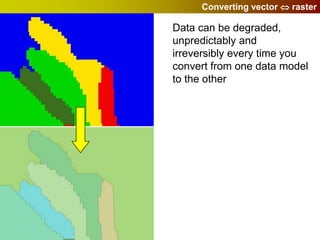
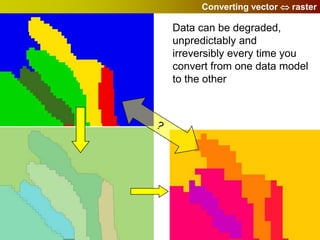
Digital models of the landscape:
Geographic Information Systems (GIS)


   A fragmented world or a smooth
              world?
What is GIS?


• GIS-Geographic Information Systems
• Computerised information systems
  designed to handle geo-spatial data
  – data which relates to location in the
    world
The capabilities of GIS


GIS gives users powerful capabilities :

• to capture and store spatial data in digital formats (data
  models)
• to visualise spatial data and relationships (geographical
  models)
• to ask questions based on that spatial data (data querying
  and spatial analysis)
Prime GIS capability: asking spatial questions


• GIS lets us ask questions about the
  location of things
Prime GIS capability: asking spatial questions


• GIS lets us ask questions about the
  location of things
  – Questions about where things happen


    Where are there trees of this type?
Prime GIS capability: asking spatial questions


• GIS lets us ask questions about the
  location of things
  – Questions about where things happen
  – Questions about what happens at a
    location


    Where are there trees of this type?
            What is the GDP of this country?
Prime GIS capability: asking spatial questions


• GIS lets us ask questions about the
  location of things
  – Questions about where things happen
  – Questions about what happens at a
    location
  – Questions about how things are related
    spatially
    Where are there trees of this type?
            What is the GDP of this country?


                                       How far across the ocean?
Where were there more than 40 FMD cases up to Mar 18, 2001?


 FMD>40?


Questions about where things happen
Where were there more than 40 FMD cases up to Mar 18, 2001?


 FMD>40?


                                        Answer in purple
Questions about where things happen
When was FMD first recorded in Gloucestershire?


Questions about what happens at a location
Which towns are in Gloucestershire?


Questions about how things are related spatially
GIS capability: visualising spatial data and relationships


• Data is stored in structured databases
• GIS is used to make spatial data and patterns in
  data visible
• This visualisation can be in the form of maps,
  charts or reports
• These are all models of reality
Applications of GIS in Property and Rural Development


•   Monitoring land use change
•   Property portfolio management
•   Land classification
•   Property value maps
•   Accessibility mapping
•   Agricultural monitoring
•   Environmental impact assessment
Land use change Aerial photograph mosaic: 1972
Land use change Aerial photograph: 1995

              Changed
           field patterns


               New woodland


New road


New houses
Rural Property management


B


      A
Rural Property management


                                                                        B


                                                                              A
ID   farm_name   tenure            rent_year   owner    type     area
 1   Farm A      annual lease      annual      George   dairy     467
 2   Farm B      perpetual lease   none        George   dairy     456
 3   Farm C      10 year lease     2006        Henry    beef      367
 4   Farm D      10 year lease     2003        Thomas   arable    678
Land classification from Satellite images
Data from Idrisi Project
Accessibility mapping

              rural travel times: before Hurricane Mitch (1998)


                                                          Source: CIAT -
                                                           World Bank -
                                                        UNEP Indicators
                                                      Project, November
                                                                   1998.


                                                        Map source:CITA
                                                       1998 Government
                                                             of Honduras
                                                       (SETCO) 1998, La
                                                        Prensa Managua
Travel Time                                              1998, La Prensa
                                                           Graphica San
 30 Minutes                                               Salvador 1998 .
  1 Hour
  2 Hours
  4 Hours
  8 Hours
 16 Hours
 2 Days
Accessibility mapping

              rural travel times: after Hurricane Mitch (1998)


                                                           Source: CIAT -
                                                            World Bank -
                                                         UNEP Indicators
                                                       Project, November
                                                                    1998.


                                                        Map source:CITA
                                                       1998 Government
                                                             of Honduras
                                                       (SETCO) 1998, La
                                                        Prensa Managua
Travel Time                                             1998, La Preensa
                                                           Graphica San
 30 Minutes                                               Salvador 1998 .
  1 Hour
  2 Hours
  4 Hours
  8 Hours
 16 Hours
 2 Days
 Damaged Bridge
Agricultural monitoring


                      Crop “C”
                     area 38 ha
 Crop “B”
area 34 ha         Vector farm map
                   laid over raster
                   satellite image
 Crop “A”
area 25 ha
Environmental impact assessment


                       Historic site


                 Protected river


Ancient forest
                   Environmentally
                   sensitive zones
Environmental impact assessment


                       Historic site


                 Protected river


Ancient forest
                   Environmentally
                   sensitive zones
Building a model: components, principles and rules


• All models are built of components
• When combined according to set
  principles and rules they create the
  model (vector and raster model rules)
• The components contain data about
  reality
• That data can be described as discrete
  or continuous
• Discrete and continuous data models
  show the World in very different ways
How computers store spatial data structures


• Vector structures are used where real-
  world objects need to be mapped.
  – Discrete data models
  – The fragmented view of the World
• Raster structures are used where
  continuous “fuzzy” data must be mapped
  – Continuous data models
  – The smooth model of the World
• (Refer back to earlier unit on digital
  mapping)
Discrete data: things with edges - fragments


• Vector model
• Fragments are things with edges…
  – A point has an edge of zero length
  – A line has an extensive edge, with a
    starting point and end point
  – A polygon has a closed extensive edge,
    with no starting point or end point
  – All discrete spatial data models represent
    the World with graphic points, lines and
    polygons
  – Similar to a paper map...
Contrasting a vector models with traditional cartography

                                             Paper map: Everything is
                                             drawn using points, lines and
                                             polygons. But they are just
                                             drawings. They have colour,
                                             texture, density etc. but no
                                             intrinsic information about the
                                             real world objects they
                                             represent


Digital vector model: points, lines and
polygons, but each is defined by its
geographical co-ordinates and is linked to
data about the real world object it
represents. Colour, line thickness etc can
all be changed without changing the actual
data intrinsic to the model
The vector model as a representation of discrete data


       Tenancy                                 Crops


Land units polygons:
Each map has different colouring
to represent different sets of data
we want to study.


                                                  Land cover
Examples of discrete spatial data


•   Political boundaries
•   Buildings
•   Land parcels
•   Roads
•   Electricity pylons
•   Rivers (?)
•   Farm fields (?)
But: how discrete are real world entities?


Is there an
    edge
   here?


 Where
exactly is
the edge
   of a
 forest?
Continuous data: things with no edges – smooth surfaces


• Raster model
• Some things exist wherever you choose to
  measure them
  – Every point on the land has a height above sea
    level
  – Every place in the atmosphere has an air pressure
  – Every piece of land has some sort of land cover
• These are examples of continuous data and
  they are difficult (impossible?) to model. The
  raster data model is one attempt to do this.
Continuous data structures: how raster data is displayed


Whole region is divided
into equal sized cells
Each cell holds one
value (attribute)
Attributes can be
represented by colours
The raster model as a representation of continuous data


One cell
The model consists of a
complete matrix of cells, all
of the same size, each
with a single value which is
represented visually by a        Colours show height
ramped colour                    Each cell is assigned one
                                 height measurement,
                                 which may be the
                                 maximum, minimum,
                                 median, or mean height of
                                 the ground in the cell
Raster models aren’t really continuous at all…
                   How the data is
                   visualised as a raster

• When we create the raster grid, we are
  dividing the World into discrete cells and
  assigning single values to each. There
  is a hard, discrete boundary around
  each cell-fragments
• Are there any genuinely continuous
  data models?
  – They are working on it, warped surfaces
    and TINs (triangulated irregular networks)
    are possibilities but they have their own
    problems.
Classifying continuous data: the influence of break points


“Continuous” height information
Classifying continuous data: the influence of break points


“Continuous” height information          Classified into 1m bands
Classifying continuous data: the influence of break points


“Continuous” height information          Classified into 1m bands


    Classified into 5m bands
Classifying continuous data: the influence of break points


“Continuous” height information          Classified into 1m bands


    Classified into 5m bands             Classified into 10m bands
Converting vector  raster

Data can be degraded,
unpredictably and
irreversibly every time you
convert from one data model
to the other
Converting vector  raster

Data can be degraded,
unpredictably and
irreversibly every time you
convert from one data model
to the other
What GIS programs are available


• Large number of GIS programs on the market
  – Some are very specialised for scientific purposes
  – Some are little more than digital map viewers used
    in asset management
• Main systems used:
  –   ArcGIS from ESRI Inc.
  –   Idrisi from Clarke University
  –   Geomedia from Intergraph Inc
  –   MapInfo
  –   Small World
RAC GIS systems
ArcGIS from ESRI
Installed in room 10

GIS and spatial-modelling

  • 1.
    Digital models ofthe landscape: Geographic Information Systems (GIS) A fragmented world or a smooth world?
  • 2.
    What is GIS? •GIS-Geographic Information Systems • Computerised information systems designed to handle geo-spatial data – data which relates to location in the world
  • 3.
    The capabilities ofGIS GIS gives users powerful capabilities : • to capture and store spatial data in digital formats (data models) • to visualise spatial data and relationships (geographical models) • to ask questions based on that spatial data (data querying and spatial analysis)
  • 4.
    Prime GIS capability:asking spatial questions • GIS lets us ask questions about the location of things
  • 5.
    Prime GIS capability:asking spatial questions • GIS lets us ask questions about the location of things – Questions about where things happen Where are there trees of this type?
  • 6.
    Prime GIS capability:asking spatial questions • GIS lets us ask questions about the location of things – Questions about where things happen – Questions about what happens at a location Where are there trees of this type? What is the GDP of this country?
  • 7.
    Prime GIS capability:asking spatial questions • GIS lets us ask questions about the location of things – Questions about where things happen – Questions about what happens at a location – Questions about how things are related spatially Where are there trees of this type? What is the GDP of this country? How far across the ocean?
  • 8.
    Where were theremore than 40 FMD cases up to Mar 18, 2001? FMD>40? Questions about where things happen
  • 9.
    Where were theremore than 40 FMD cases up to Mar 18, 2001? FMD>40? Answer in purple Questions about where things happen
  • 10.
    When was FMDfirst recorded in Gloucestershire? Questions about what happens at a location
  • 11.
    Which towns arein Gloucestershire? Questions about how things are related spatially
  • 12.
    GIS capability: visualisingspatial data and relationships • Data is stored in structured databases • GIS is used to make spatial data and patterns in data visible • This visualisation can be in the form of maps, charts or reports • These are all models of reality
  • 13.
    Applications of GISin Property and Rural Development • Monitoring land use change • Property portfolio management • Land classification • Property value maps • Accessibility mapping • Agricultural monitoring • Environmental impact assessment
  • 14.
    Land use changeAerial photograph mosaic: 1972
  • 15.
    Land use changeAerial photograph: 1995 Changed field patterns New woodland New road New houses
  • 16.
  • 17.
  • 18.
    Rural Property management B A ID farm_name tenure rent_year owner type area 1 Farm A annual lease annual George dairy 467 2 Farm B perpetual lease none George dairy 456 3 Farm C 10 year lease 2006 Henry beef 367 4 Farm D 10 year lease 2003 Thomas arable 678
  • 19.
    Land classification fromSatellite images Data from Idrisi Project
  • 20.
    Accessibility mapping rural travel times: before Hurricane Mitch (1998) Source: CIAT - World Bank - UNEP Indicators Project, November 1998. Map source:CITA 1998 Government of Honduras (SETCO) 1998, La Prensa Managua Travel Time 1998, La Prensa Graphica San 30 Minutes Salvador 1998 . 1 Hour 2 Hours 4 Hours 8 Hours 16 Hours 2 Days
  • 21.
    Accessibility mapping rural travel times: after Hurricane Mitch (1998) Source: CIAT - World Bank - UNEP Indicators Project, November 1998. Map source:CITA 1998 Government of Honduras (SETCO) 1998, La Prensa Managua Travel Time 1998, La Preensa Graphica San 30 Minutes Salvador 1998 . 1 Hour 2 Hours 4 Hours 8 Hours 16 Hours 2 Days Damaged Bridge
  • 22.
    Agricultural monitoring Crop “C” area 38 ha Crop “B” area 34 ha Vector farm map laid over raster satellite image Crop “A” area 25 ha
  • 23.
  • 24.
    Environmental impact assessment Historic site Protected river Ancient forest Environmentally sensitive zones
  • 25.
    Environmental impact assessment Historic site Protected river Ancient forest Environmentally sensitive zones
  • 26.
    Building a model:components, principles and rules • All models are built of components • When combined according to set principles and rules they create the model (vector and raster model rules) • The components contain data about reality • That data can be described as discrete or continuous • Discrete and continuous data models show the World in very different ways
  • 27.
    How computers storespatial data structures • Vector structures are used where real- world objects need to be mapped. – Discrete data models – The fragmented view of the World • Raster structures are used where continuous “fuzzy” data must be mapped – Continuous data models – The smooth model of the World • (Refer back to earlier unit on digital mapping)
  • 28.
    Discrete data: thingswith edges - fragments • Vector model • Fragments are things with edges… – A point has an edge of zero length – A line has an extensive edge, with a starting point and end point – A polygon has a closed extensive edge, with no starting point or end point – All discrete spatial data models represent the World with graphic points, lines and polygons – Similar to a paper map...
  • 29.
    Contrasting a vectormodels with traditional cartography Paper map: Everything is drawn using points, lines and polygons. But they are just drawings. They have colour, texture, density etc. but no intrinsic information about the real world objects they represent Digital vector model: points, lines and polygons, but each is defined by its geographical co-ordinates and is linked to data about the real world object it represents. Colour, line thickness etc can all be changed without changing the actual data intrinsic to the model
  • 30.
    The vector modelas a representation of discrete data Tenancy Crops Land units polygons: Each map has different colouring to represent different sets of data we want to study. Land cover
  • 31.
    Examples of discretespatial data • Political boundaries • Buildings • Land parcels • Roads • Electricity pylons • Rivers (?) • Farm fields (?)
  • 32.
    But: how discreteare real world entities? Is there an edge here? Where exactly is the edge of a forest?
  • 33.
    Continuous data: thingswith no edges – smooth surfaces • Raster model • Some things exist wherever you choose to measure them – Every point on the land has a height above sea level – Every place in the atmosphere has an air pressure – Every piece of land has some sort of land cover • These are examples of continuous data and they are difficult (impossible?) to model. The raster data model is one attempt to do this.
  • 34.
    Continuous data structures:how raster data is displayed Whole region is divided into equal sized cells Each cell holds one value (attribute) Attributes can be represented by colours
  • 35.
    The raster modelas a representation of continuous data One cell The model consists of a complete matrix of cells, all of the same size, each with a single value which is represented visually by a Colours show height ramped colour Each cell is assigned one height measurement, which may be the maximum, minimum, median, or mean height of the ground in the cell
  • 36.
    Raster models aren’treally continuous at all… How the data is visualised as a raster • When we create the raster grid, we are dividing the World into discrete cells and assigning single values to each. There is a hard, discrete boundary around each cell-fragments • Are there any genuinely continuous data models? – They are working on it, warped surfaces and TINs (triangulated irregular networks) are possibilities but they have their own problems.
  • 37.
    Classifying continuous data:the influence of break points “Continuous” height information
  • 38.
    Classifying continuous data:the influence of break points “Continuous” height information Classified into 1m bands
  • 39.
    Classifying continuous data:the influence of break points “Continuous” height information Classified into 1m bands Classified into 5m bands
  • 40.
    Classifying continuous data:the influence of break points “Continuous” height information Classified into 1m bands Classified into 5m bands Classified into 10m bands
  • 41.
  • 42.
    Converting vector raster Data can be degraded, unpredictably and irreversibly every time you convert from one data model to the other
  • 43.
    Converting vector raster Data can be degraded, unpredictably and irreversibly every time you convert from one data model to the other
  • 44.
    What GIS programsare available • Large number of GIS programs on the market – Some are very specialised for scientific purposes – Some are little more than digital map viewers used in asset management • Main systems used: – ArcGIS from ESRI Inc. – Idrisi from Clarke University – Geomedia from Intergraph Inc – MapInfo – Small World
  • 45.
    RAC GIS systems ArcGISfrom ESRI Installed in room 10