
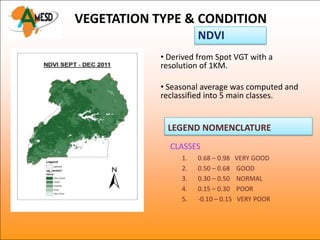
![VEGETATION TYPE & CONDITION
Land Use Land Cover
Land use land cover class aggregation:
1. Forest
2. Agriculture:[ shrubs, bush land,
perennial crops]
3. Grassland:[Annual crops, grassland
savanna, grassland]
4. Woodland:[Woodland, woodland
savanna
5. Bare Soils:[Bare soils, Bare rocks]](https://image.slidesharecdn.com/ldimpresentation-130410104328-phpapp02/85/Muyambi-Benda-FORTUNATE-Land-degradation-assessment-in-the-IGAD-Region-Its-extent-and-impact-17-320.jpg)
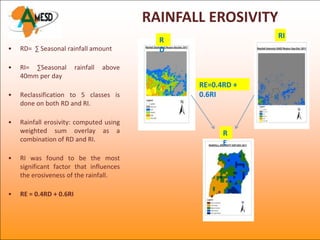
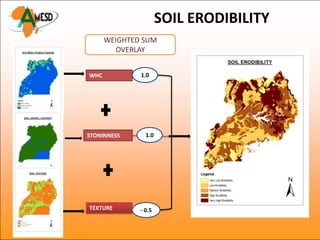
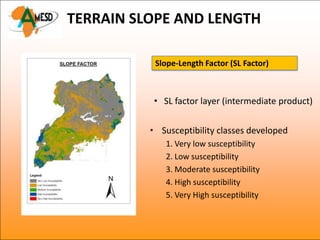
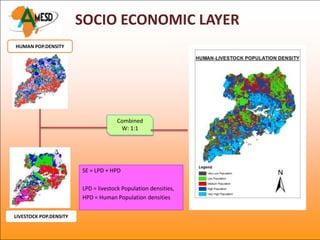
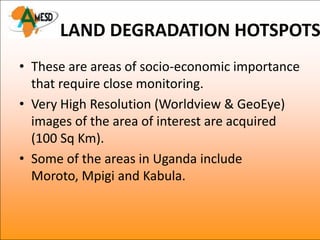

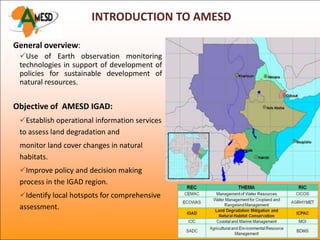
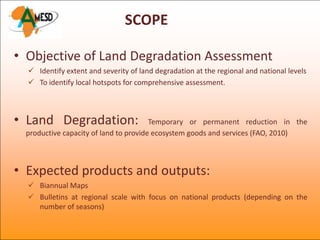
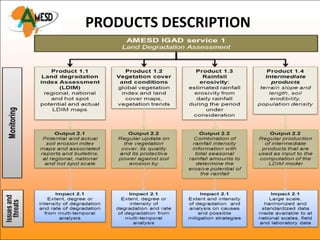
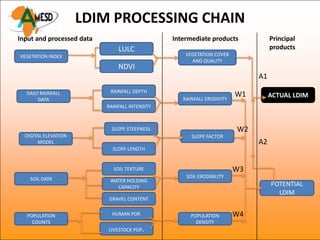
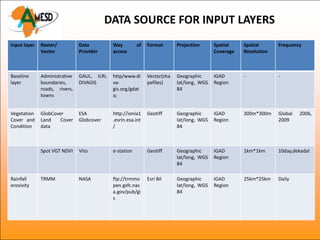
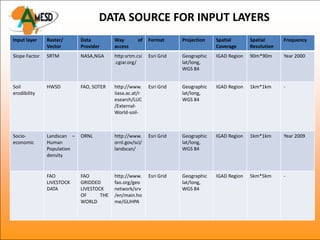
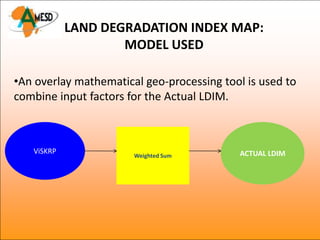
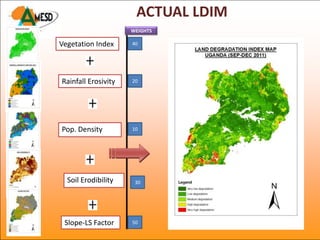
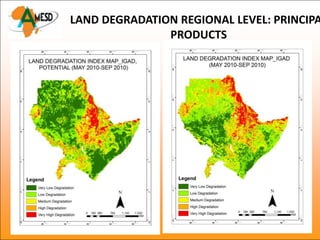
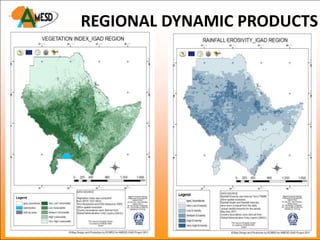
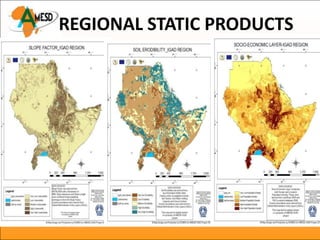
The document summarizes a land degradation assessment in the IGAD region of Africa. Several key factors that contribute to land degradation are analyzed using earth observation data, including vegetation cover, rainfall erosivity, population density, soil erodibility, and slope length. Maps are produced showing vegetation condition, rainfall erosivity, soil erodibility, terrain slope, and a combined land degradation index. The assessment finds that 45% of the IGAD region is affected by considerable land degradation, with the most extensive areas located in eastern and northern parts of the region. Several hotspot areas are also identified for more detailed analysis.


![[Day 2] Center Presentation: ICIMOD (1/2)](https://cdn.slidesharecdn.com/ss_thumbnails/cgiar-csi-day2-1apr2009-center-icimod-pt1-090405003340-phpapp02-thumbnail.jpg?width=640&height=640&fit=bounds)


![[Day 2] Center Presentation: IITA](https://cdn.slidesharecdn.com/ss_thumbnails/cgiar-csi-day2-1apr2009-center-iita-090405003235-phpapp01-thumbnail.jpg?width=640&height=640&fit=bounds)


