Downloaded 753 times
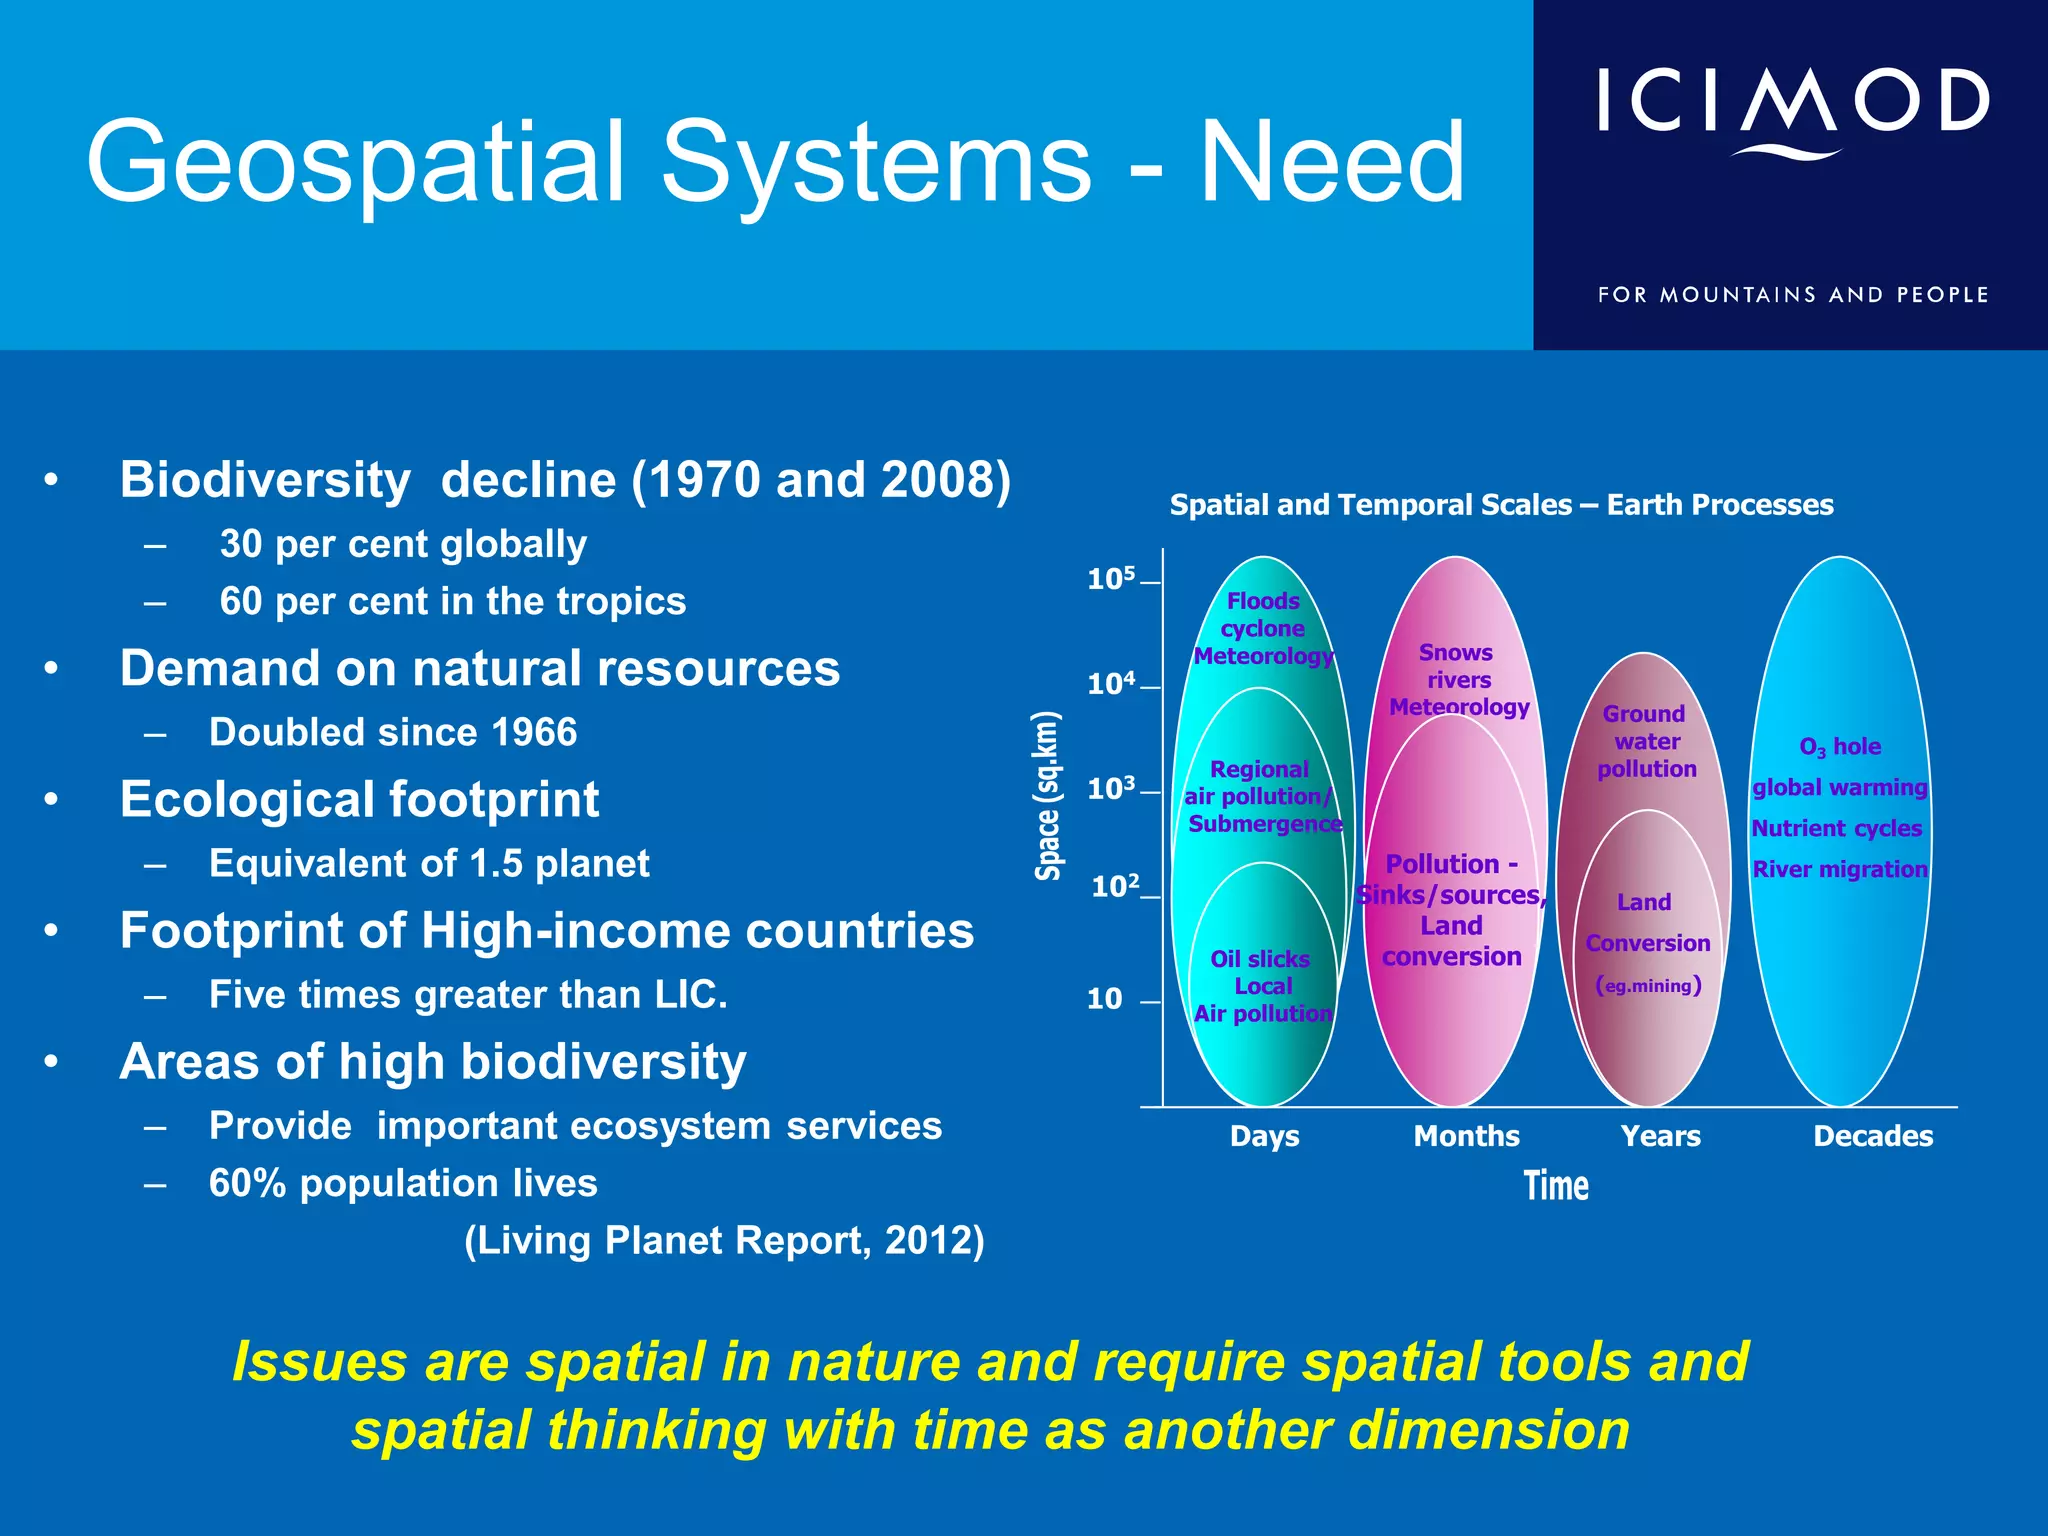
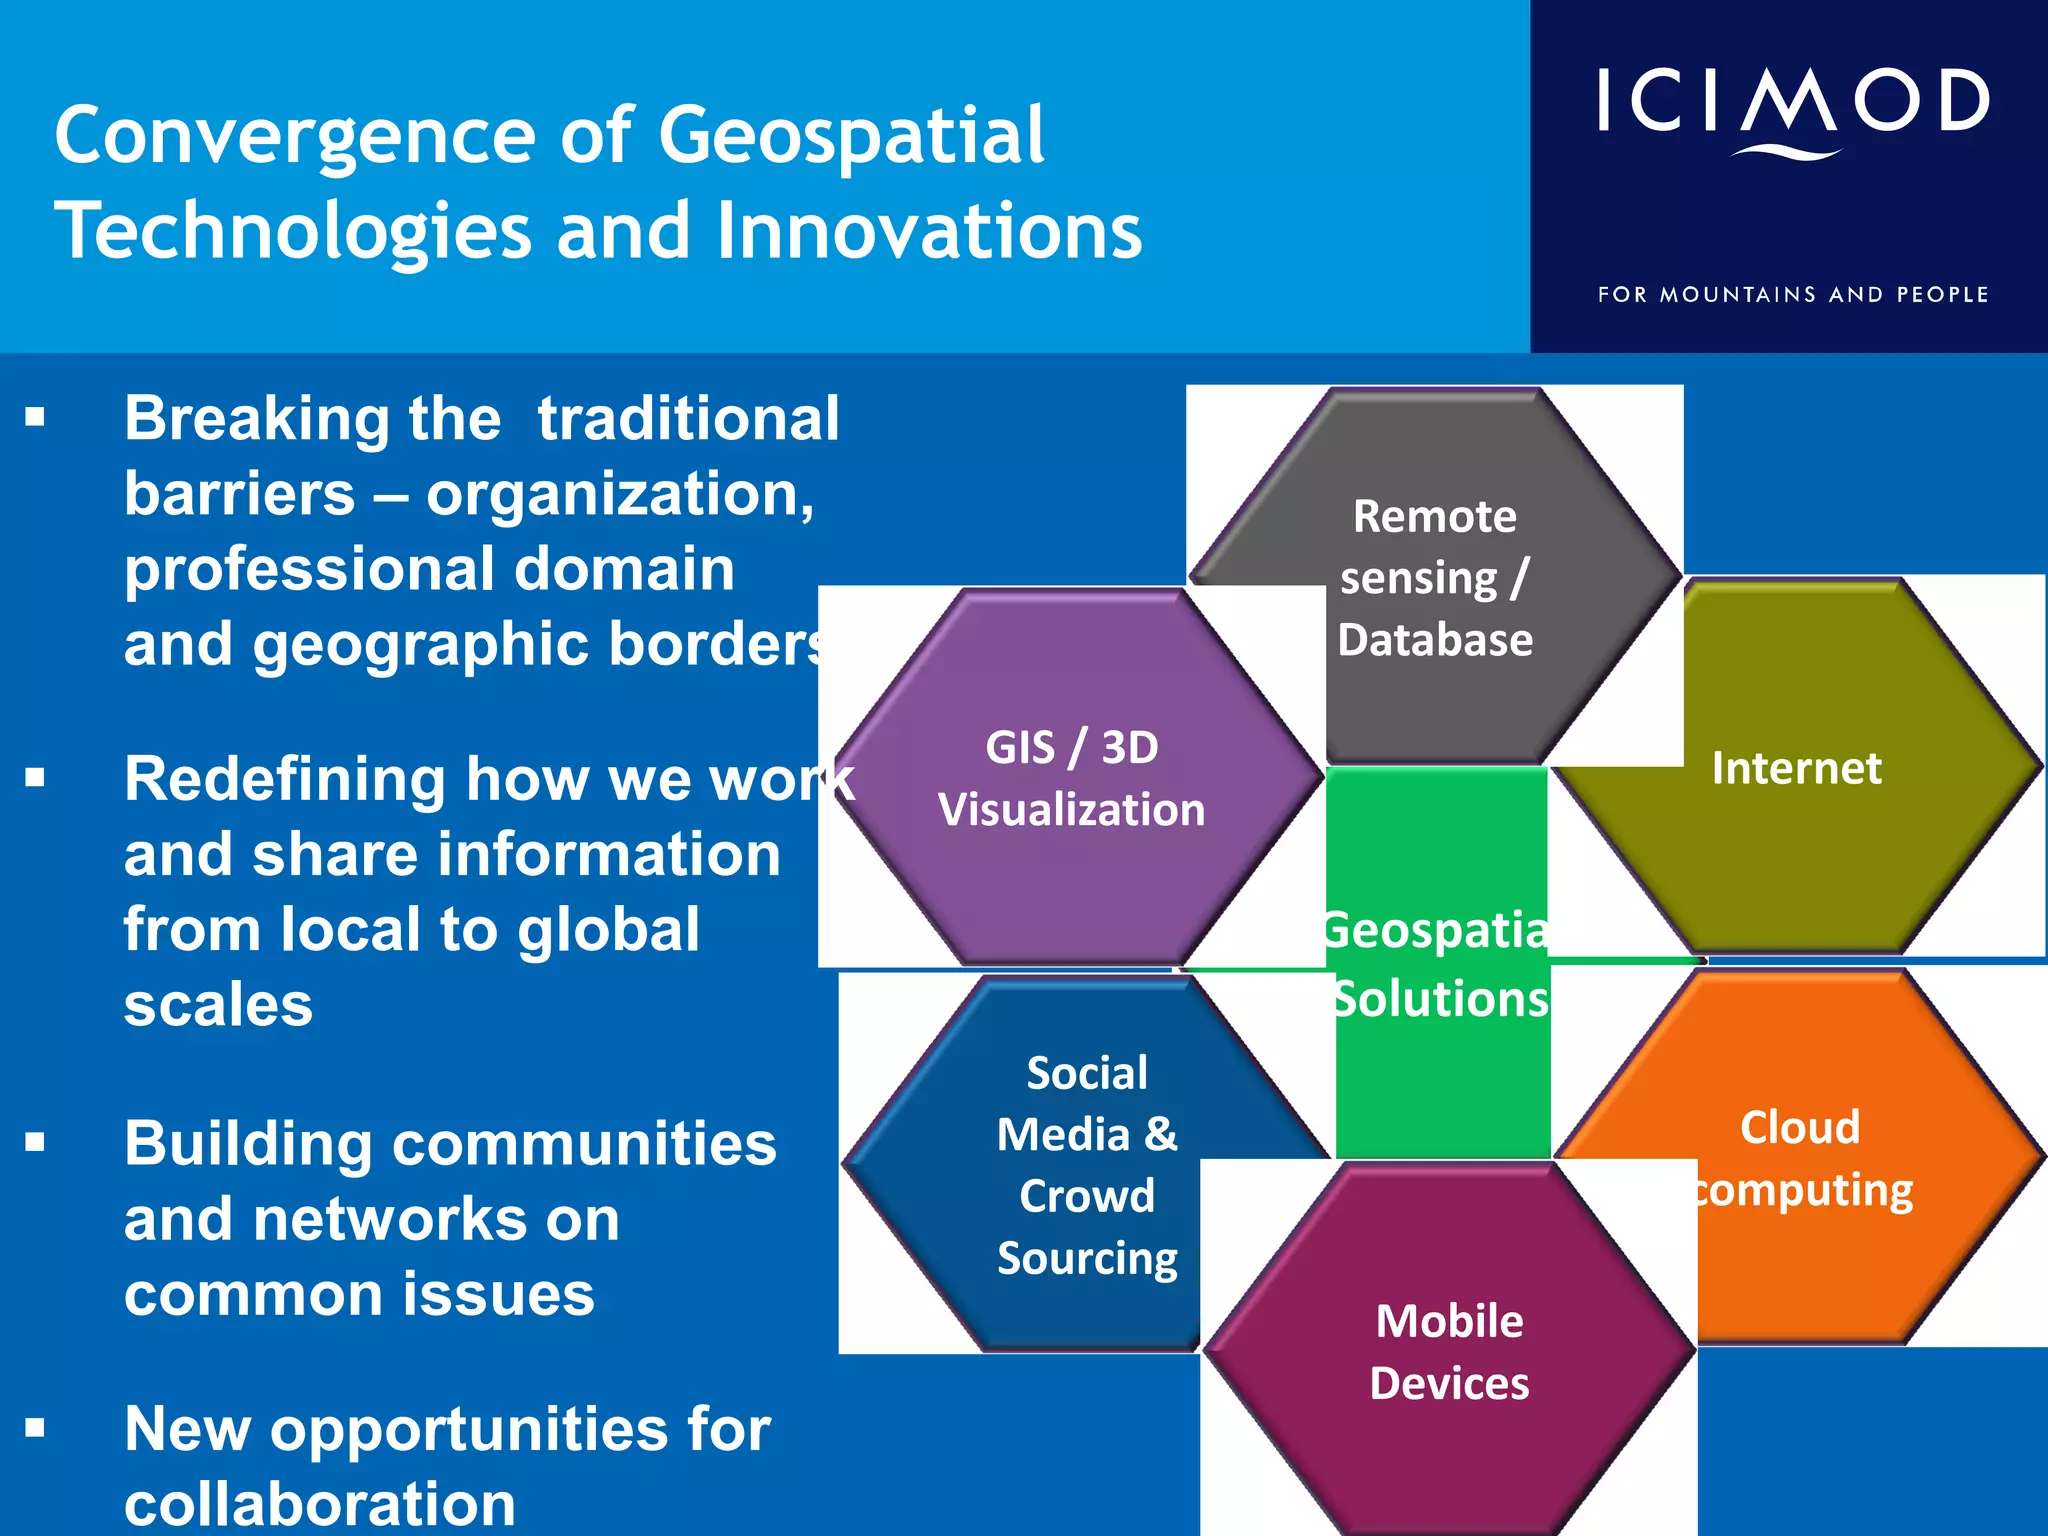
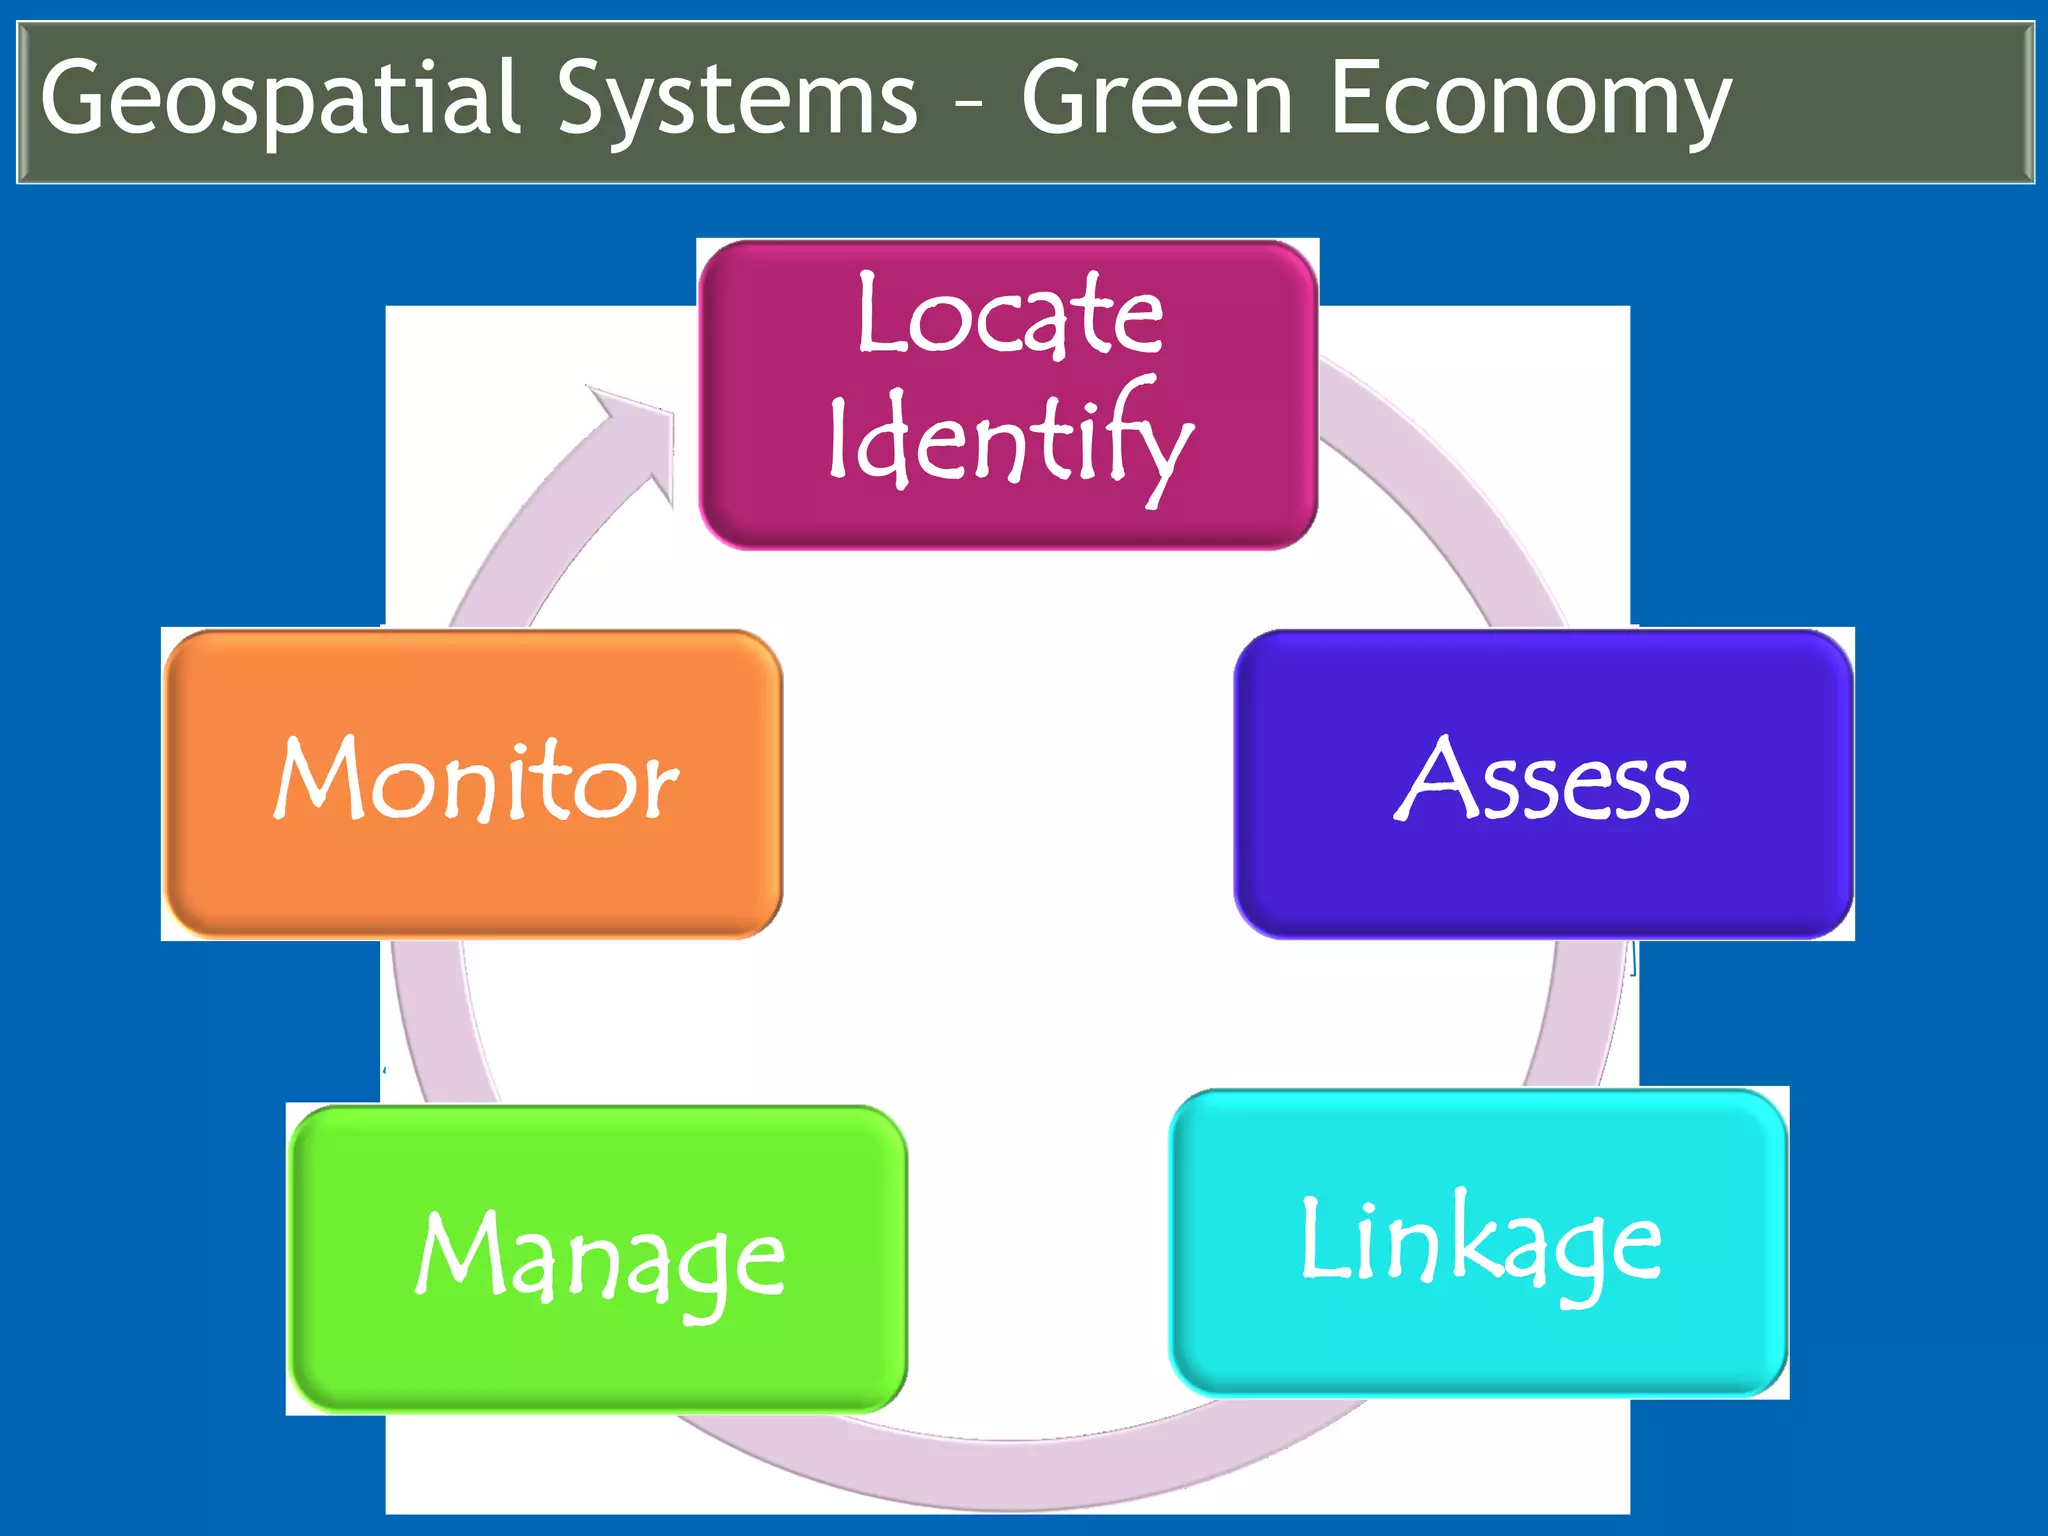
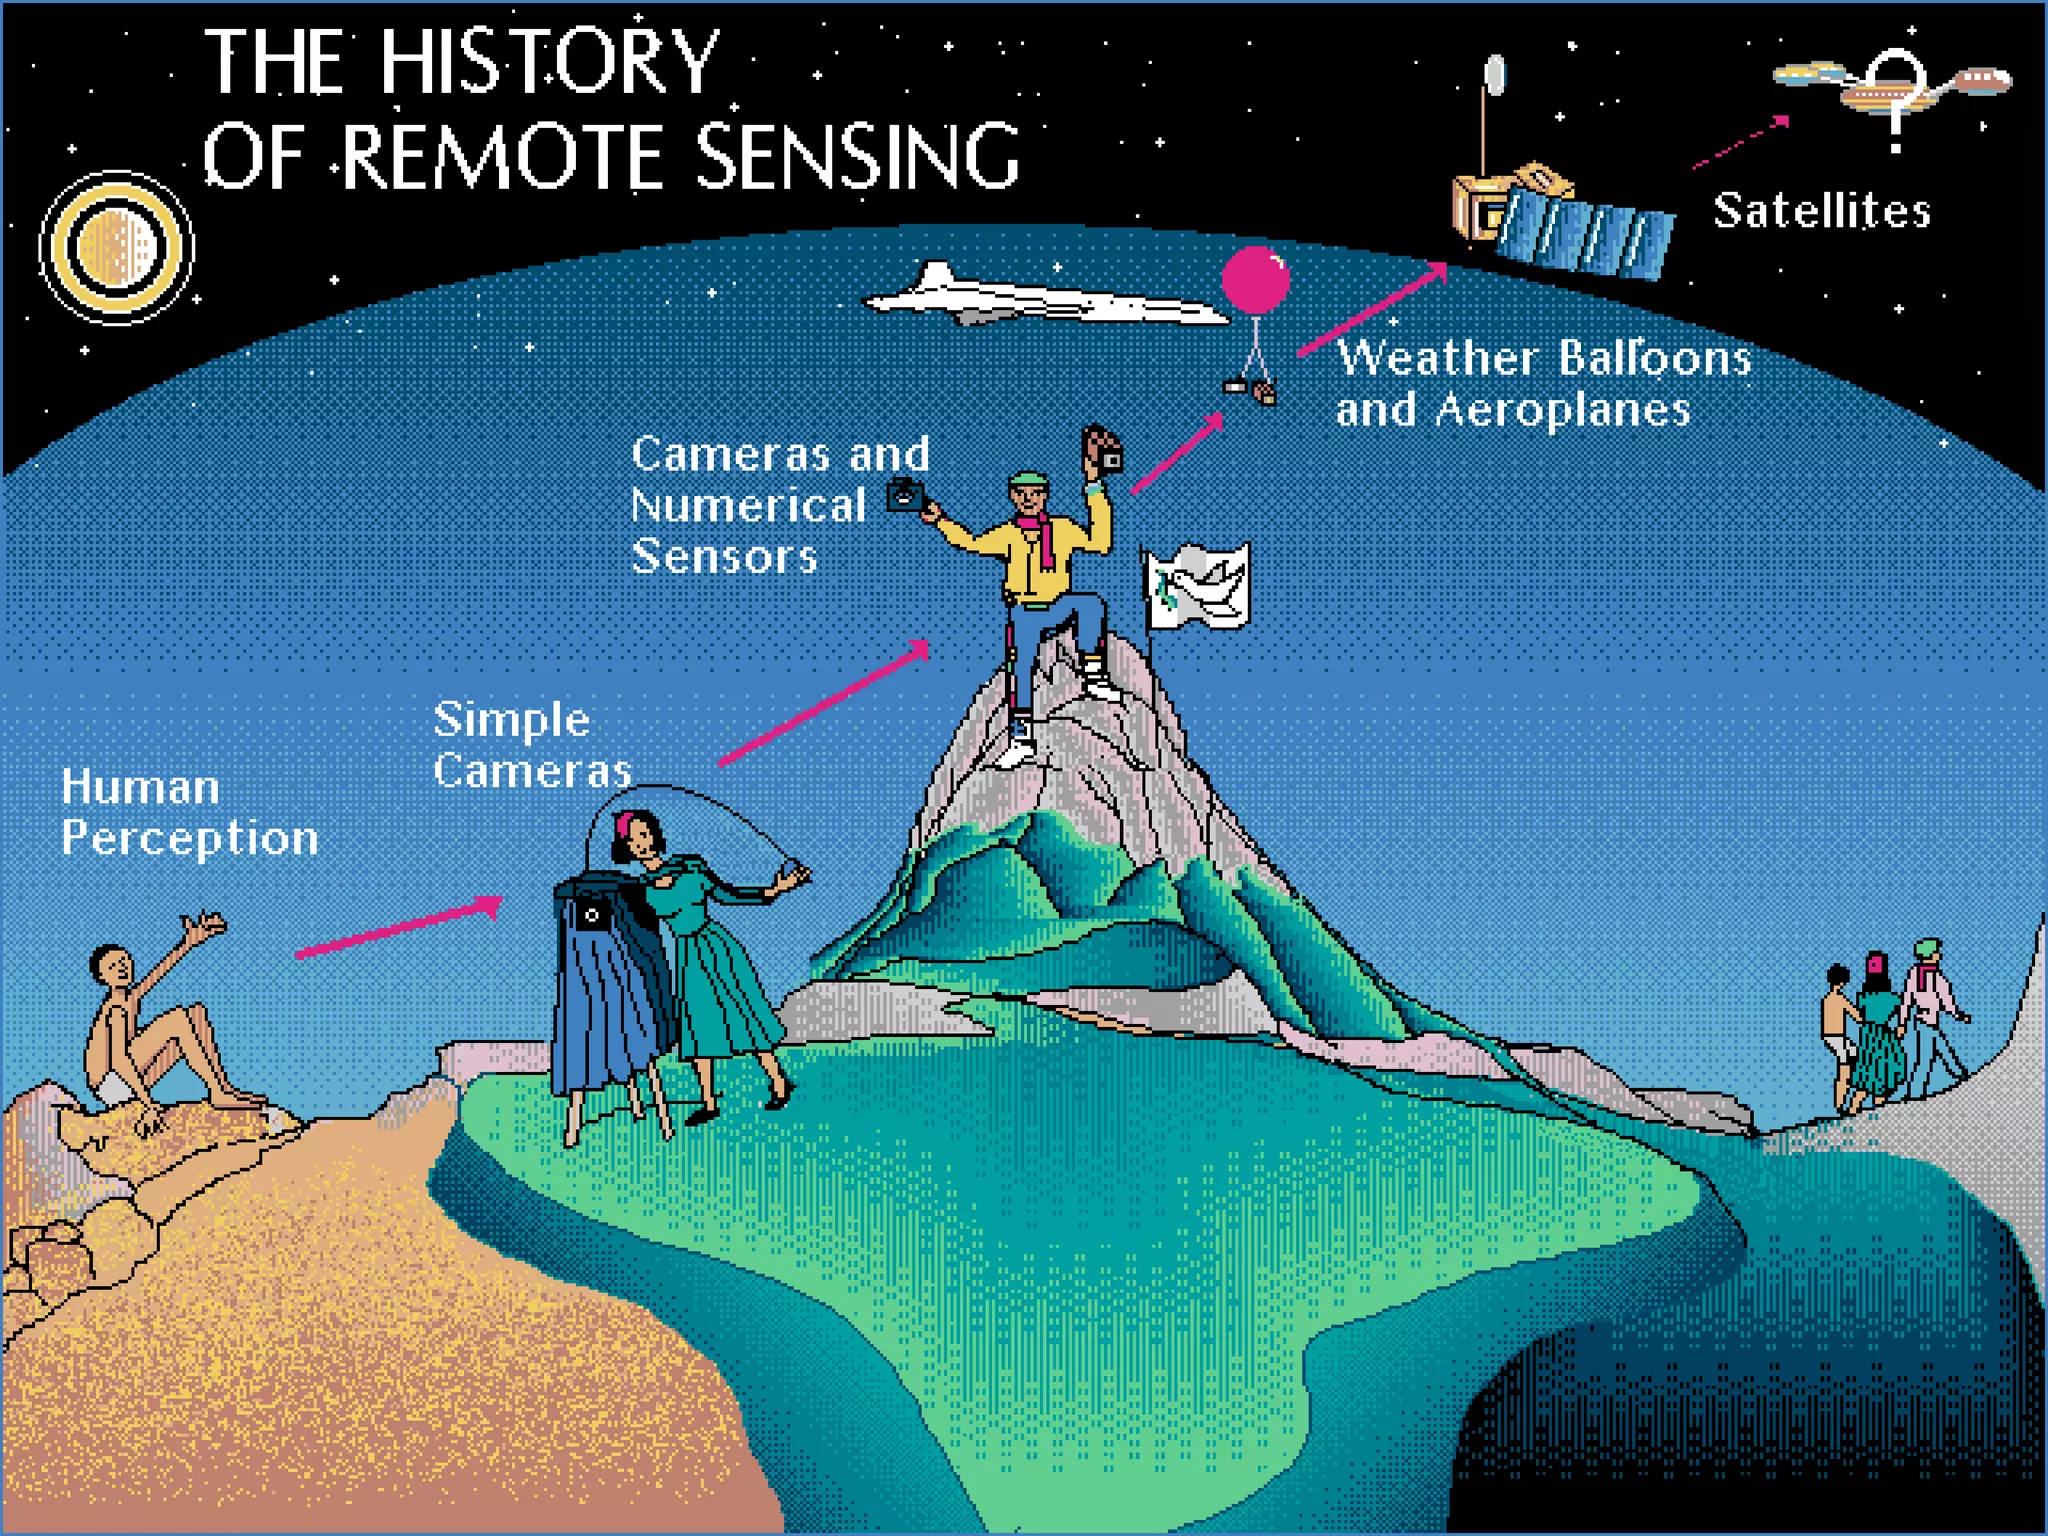
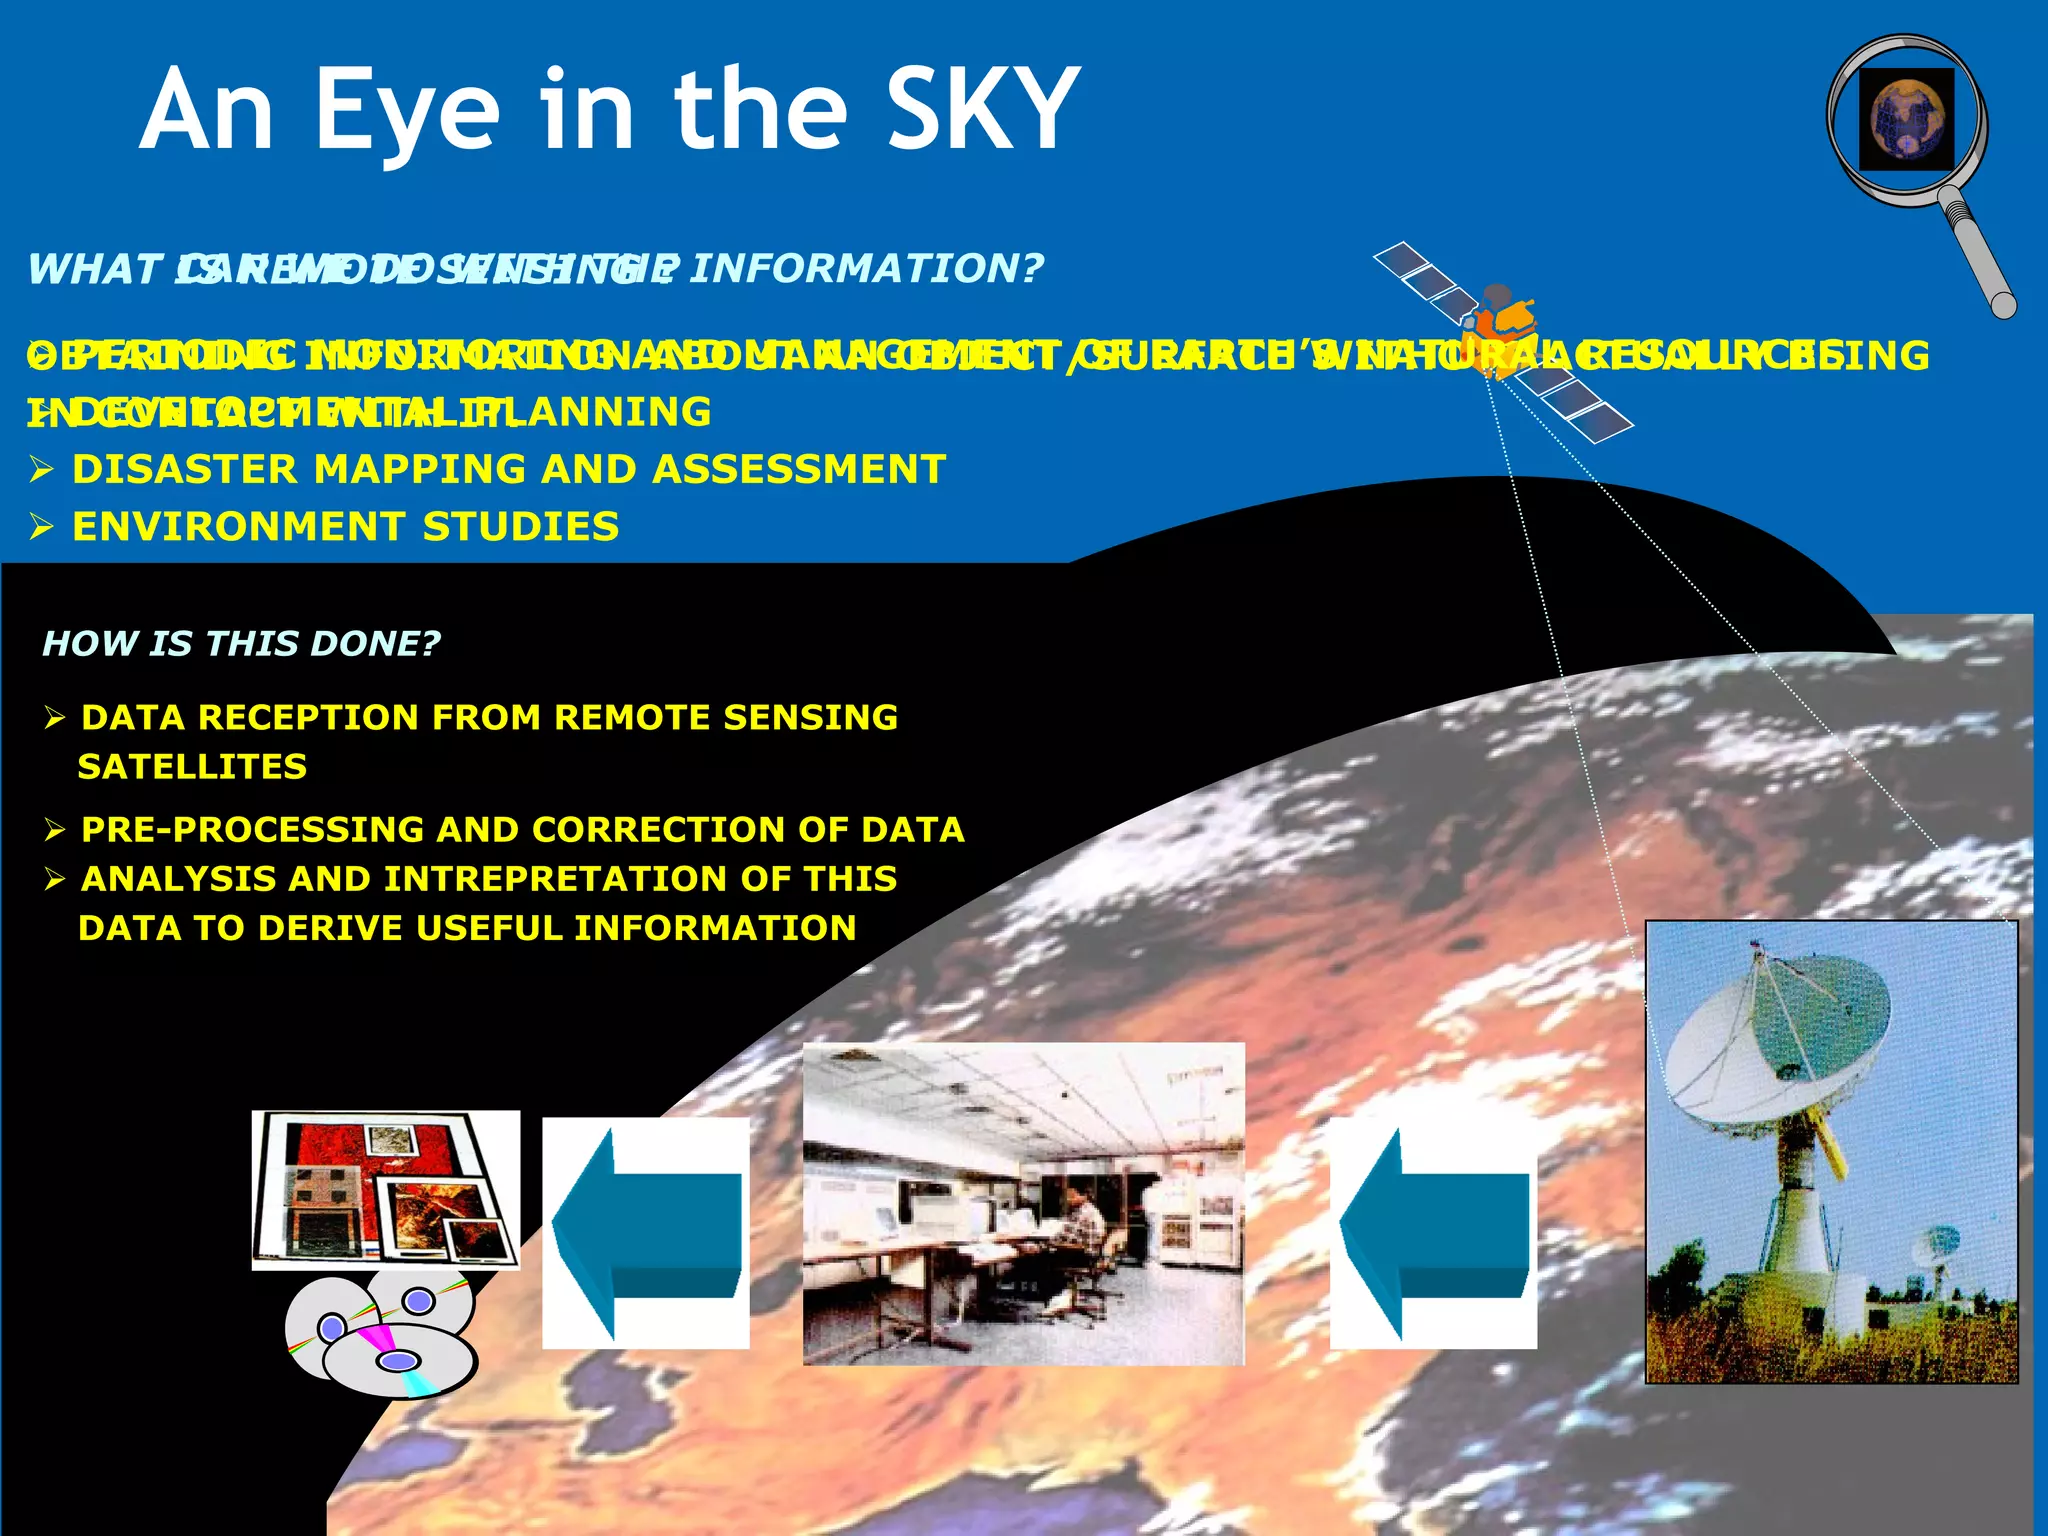
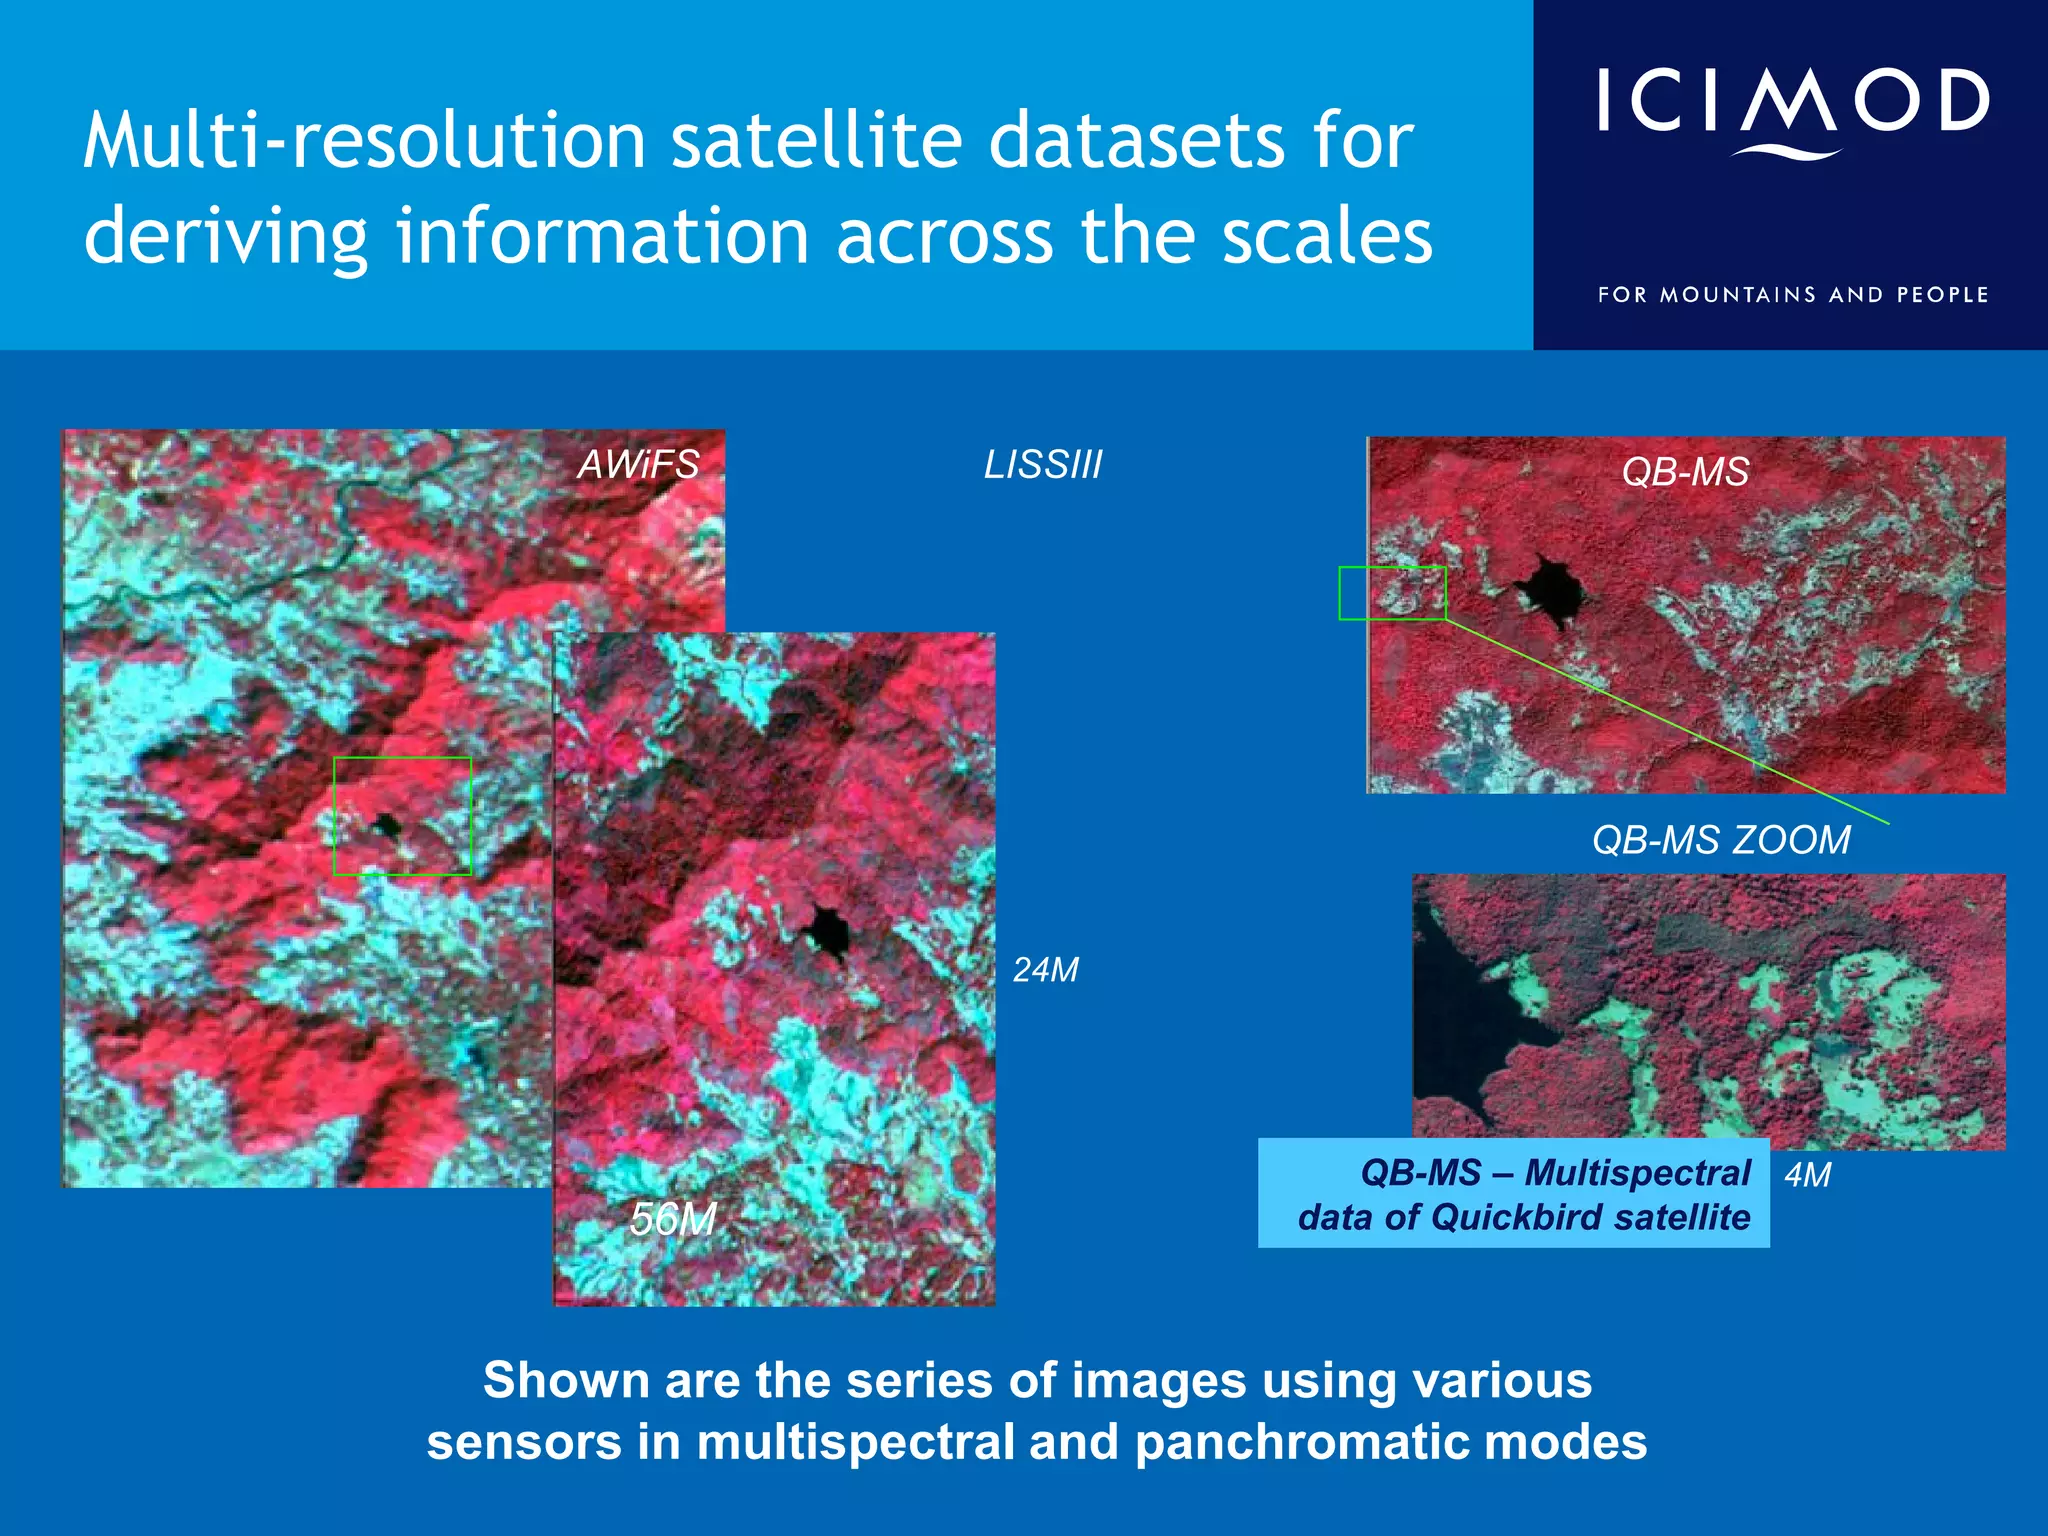
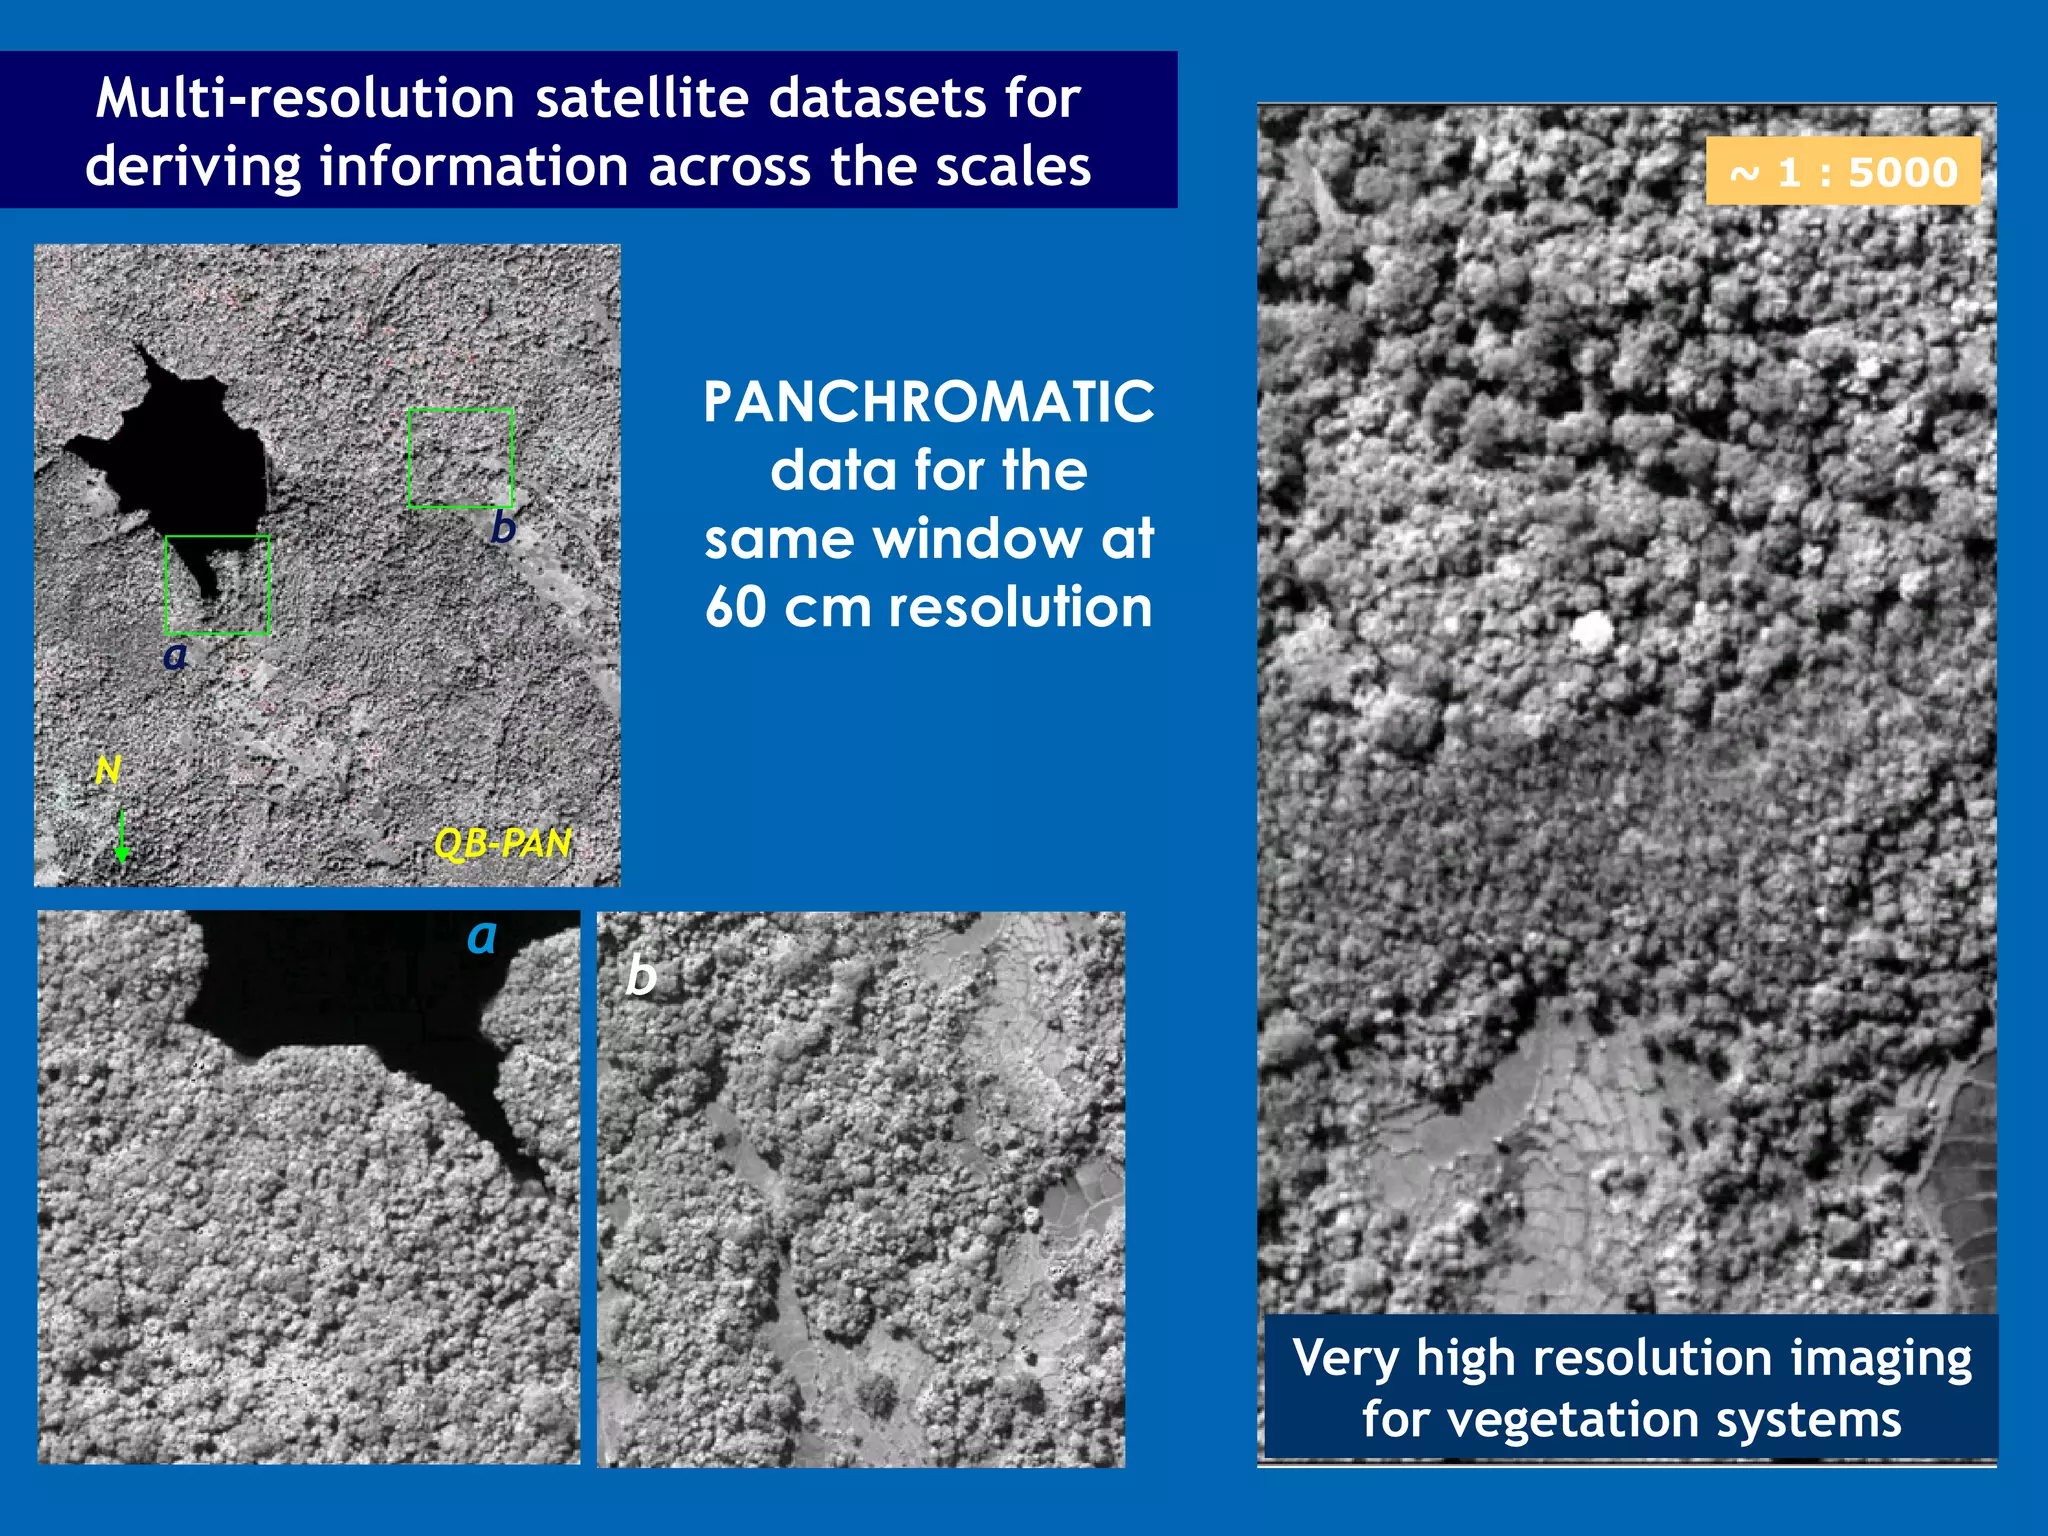
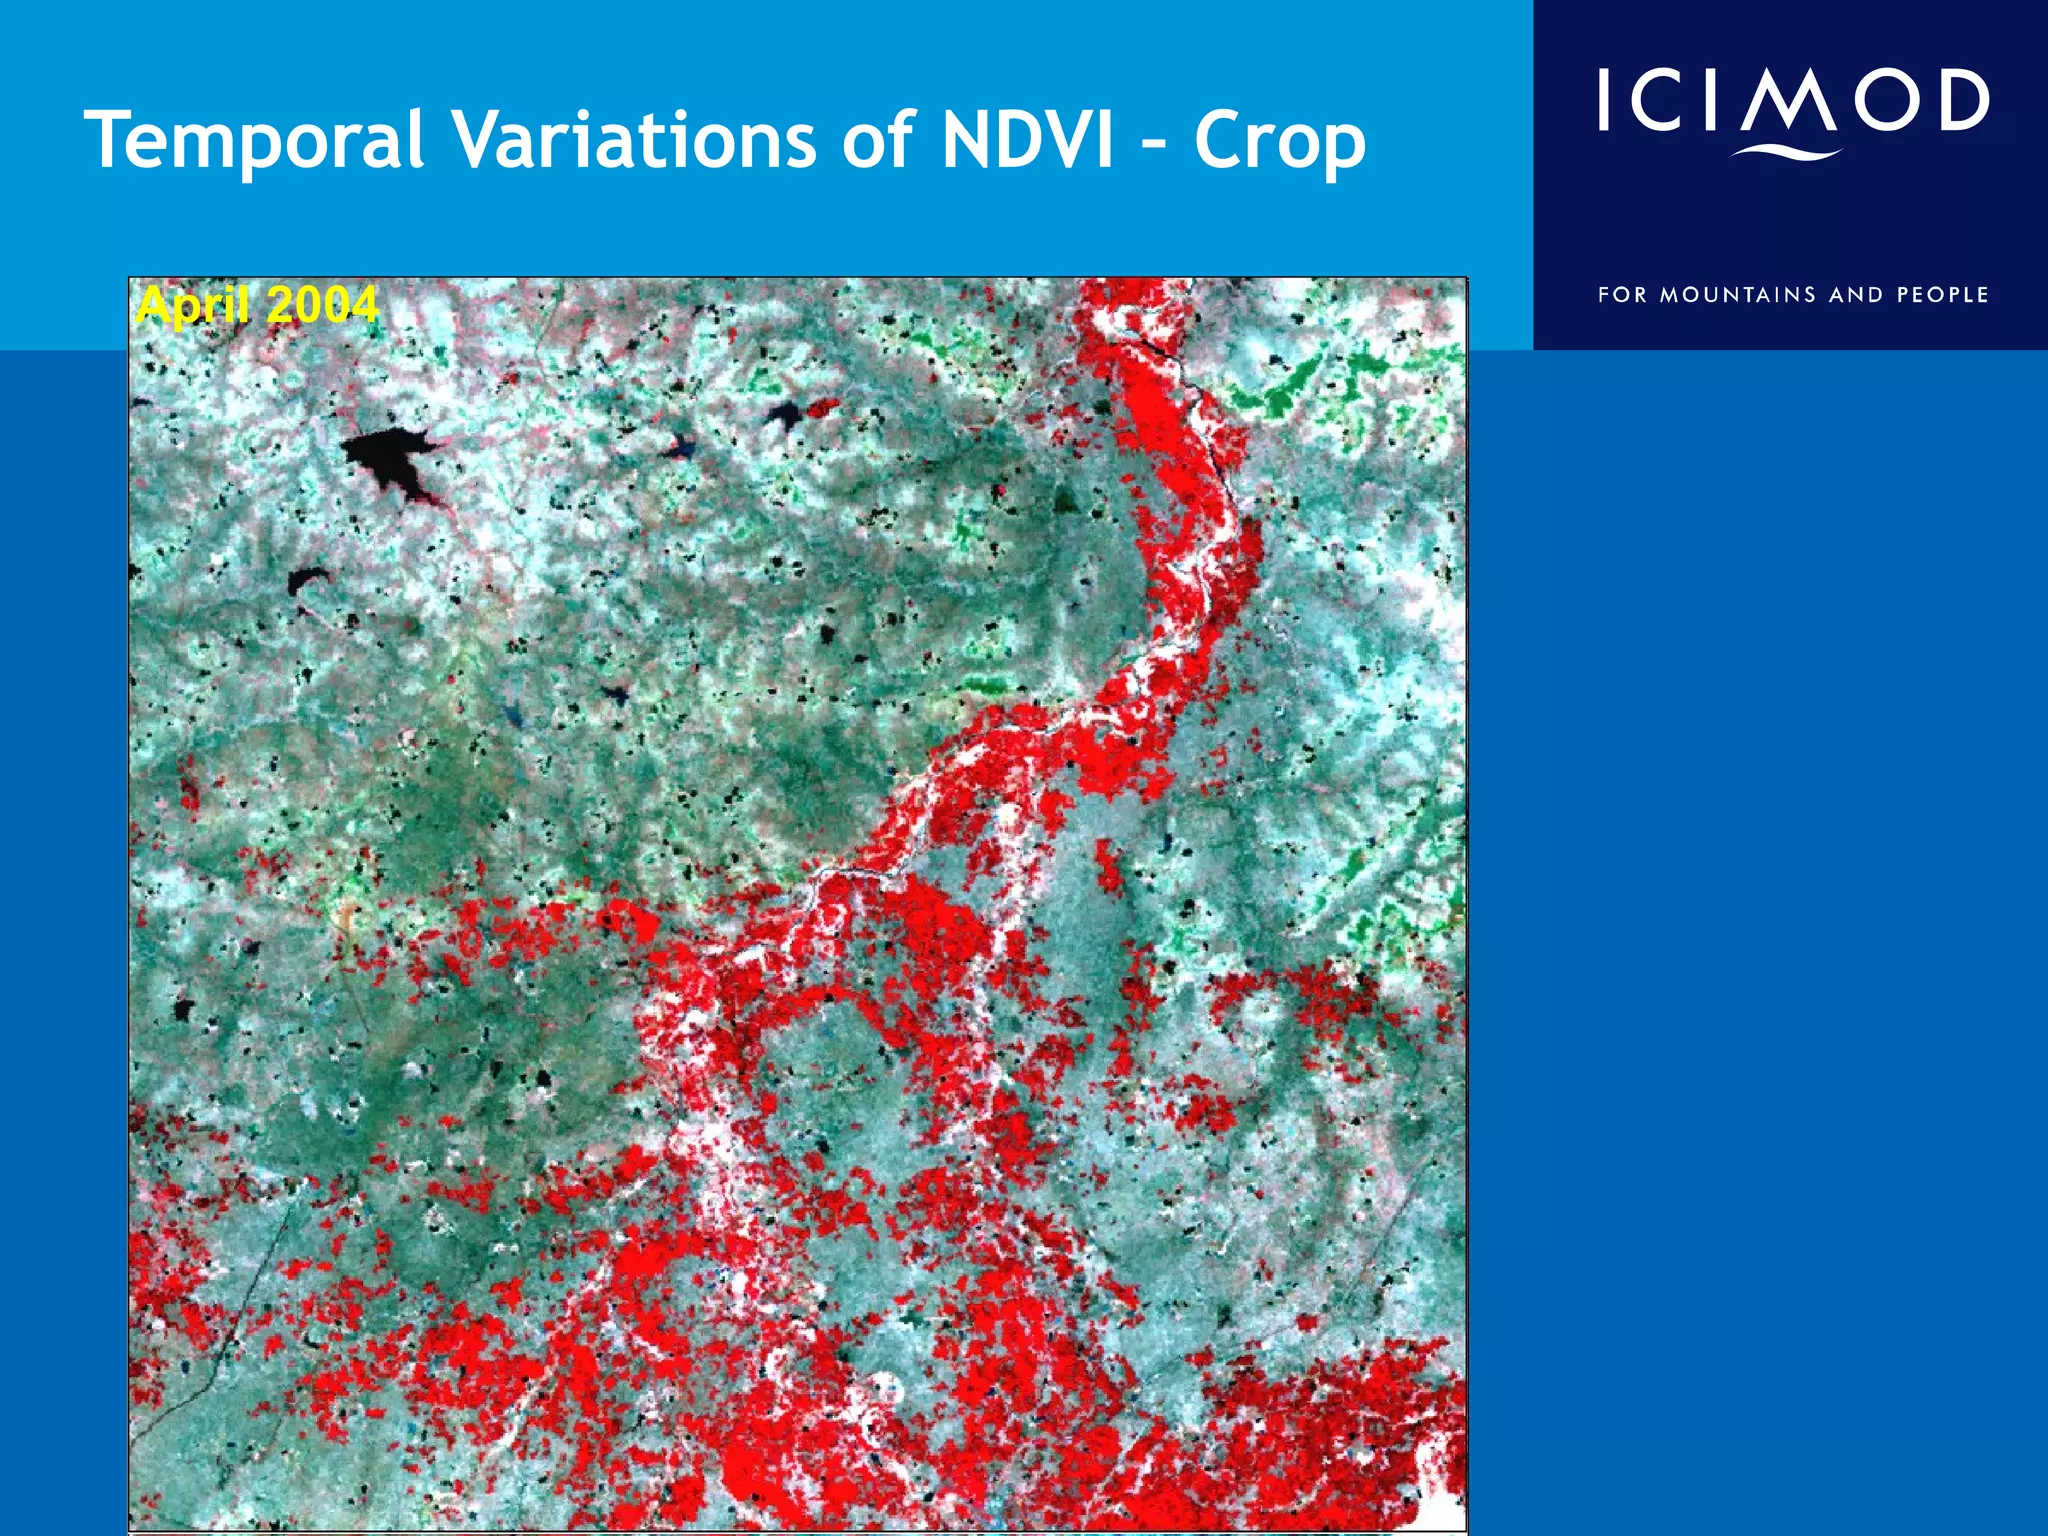
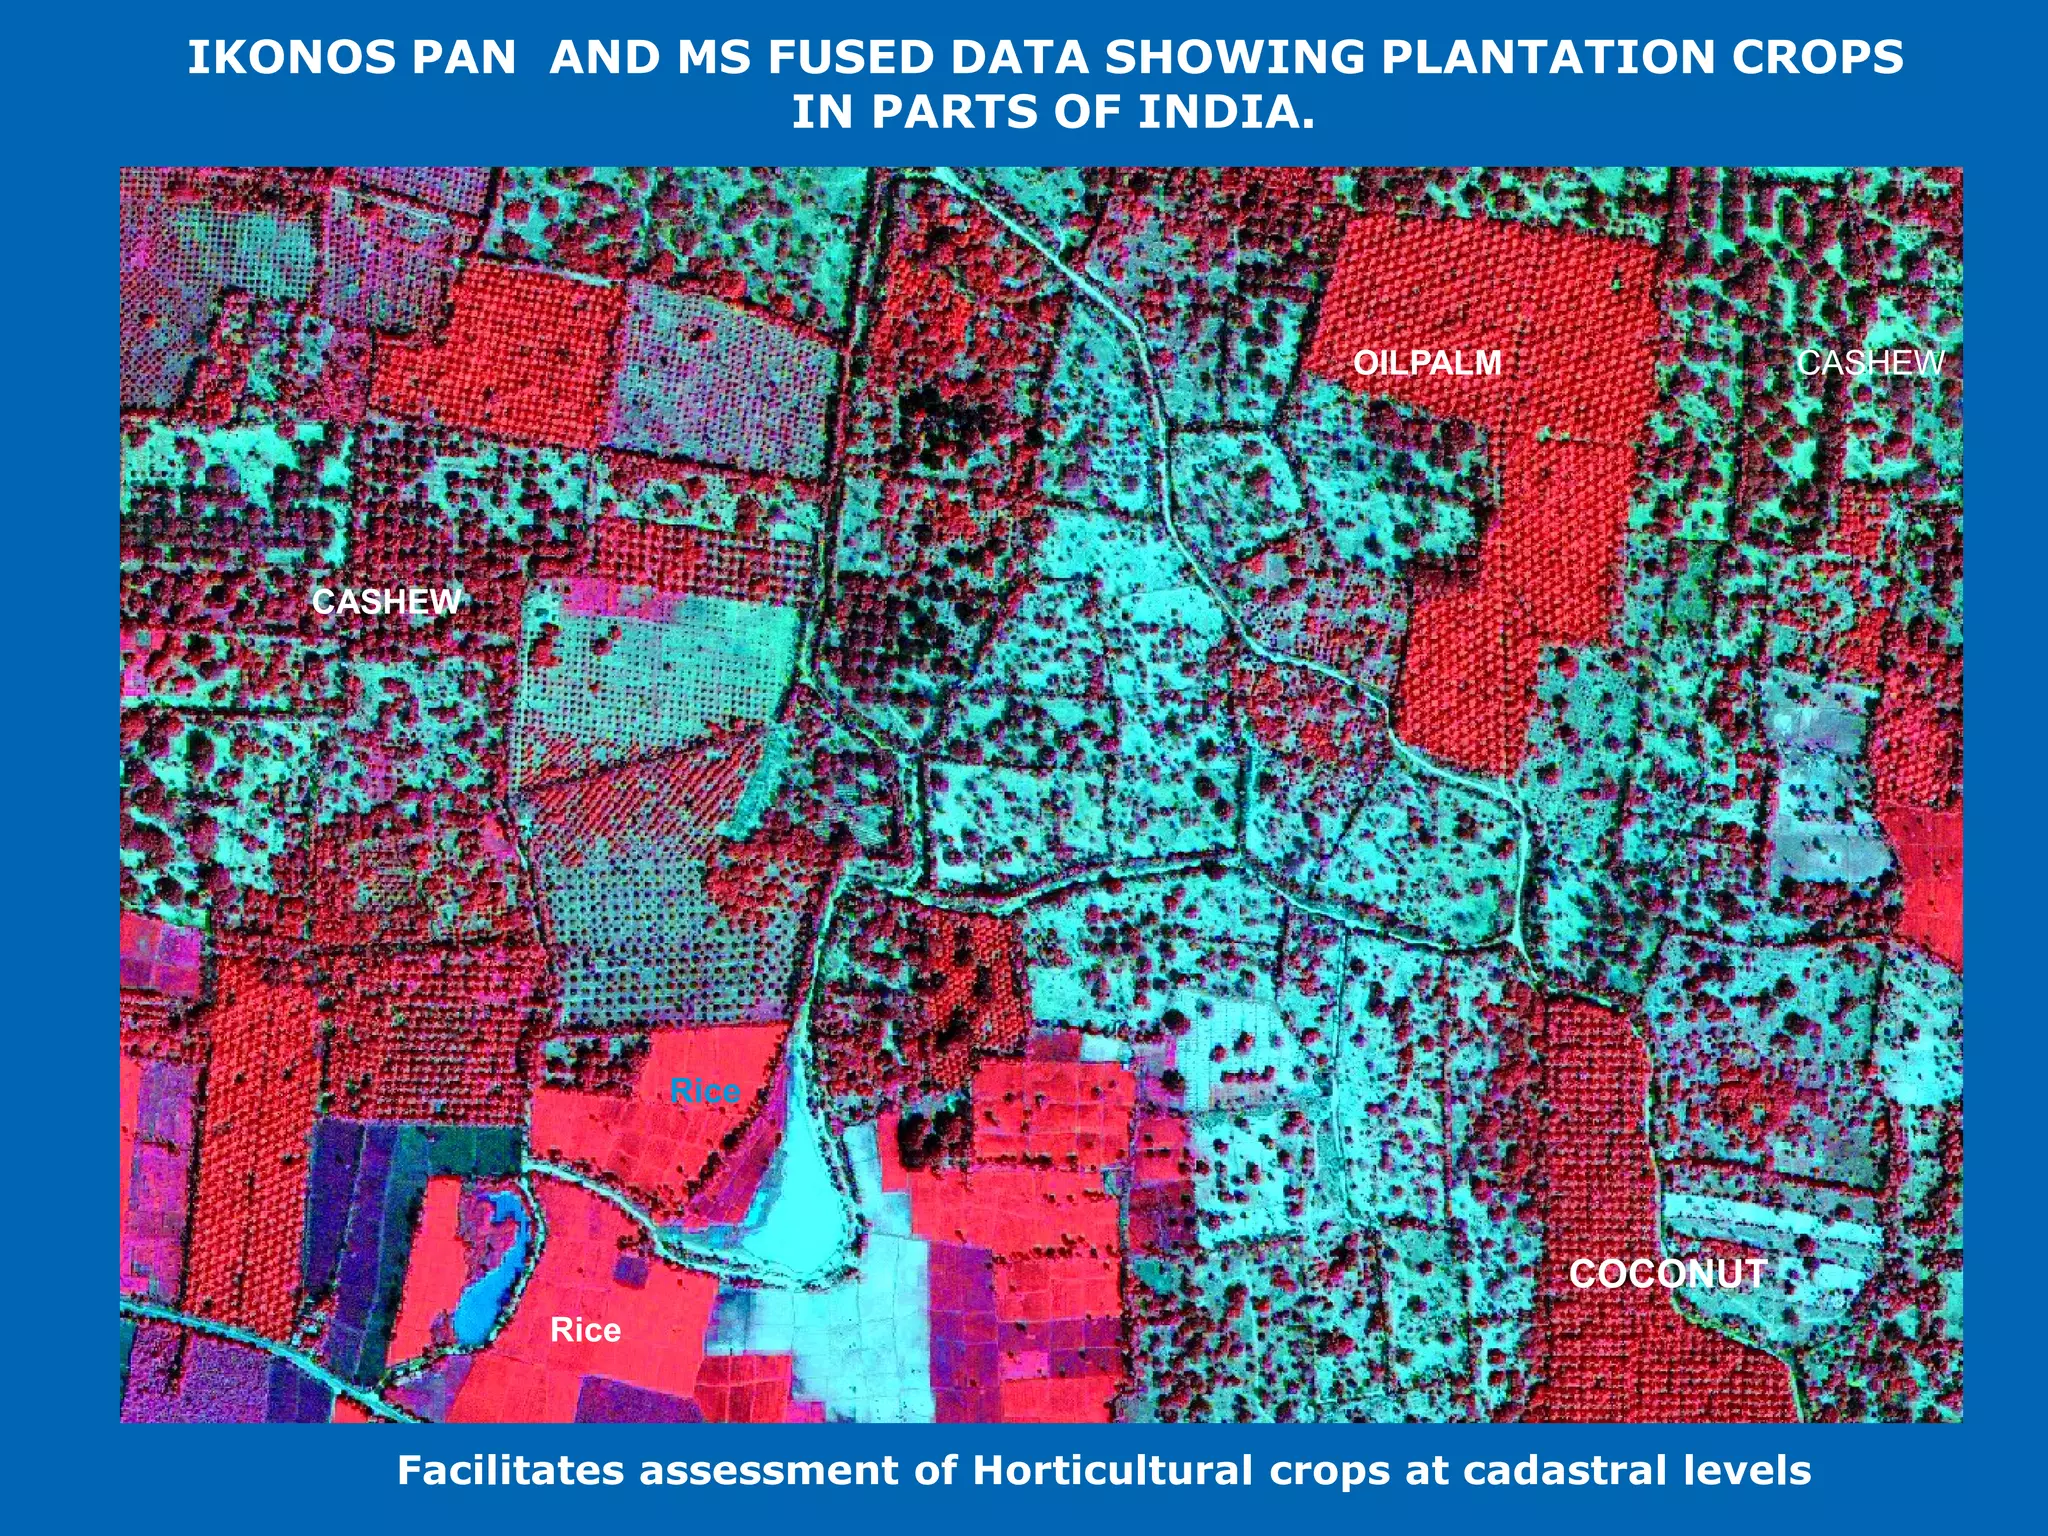
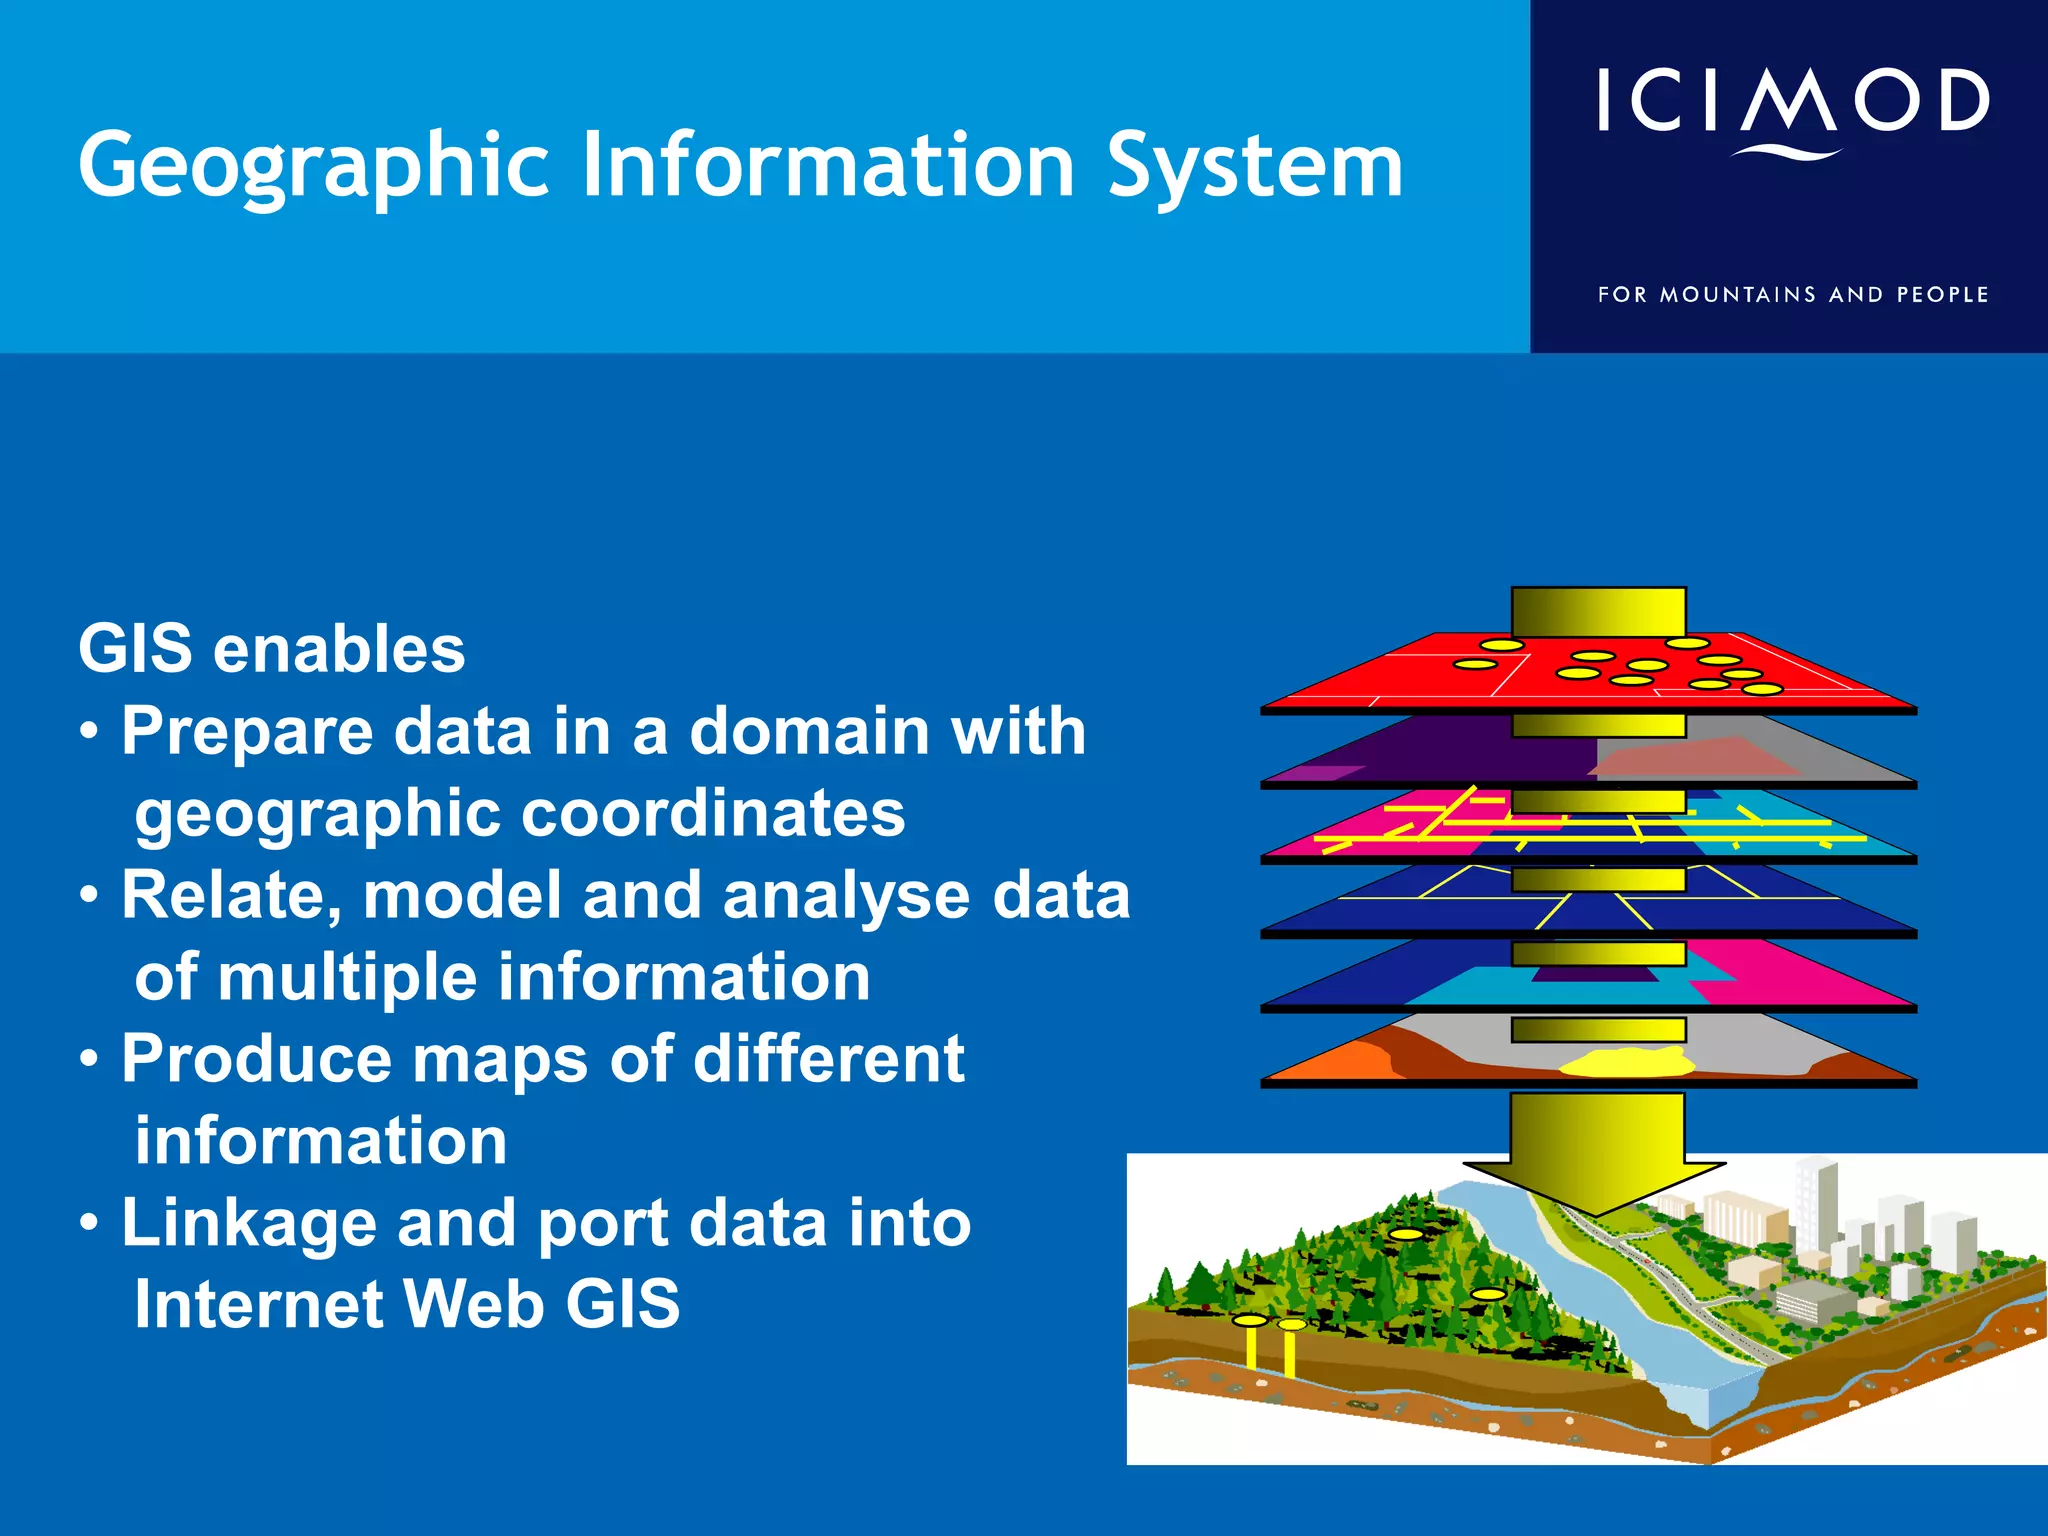
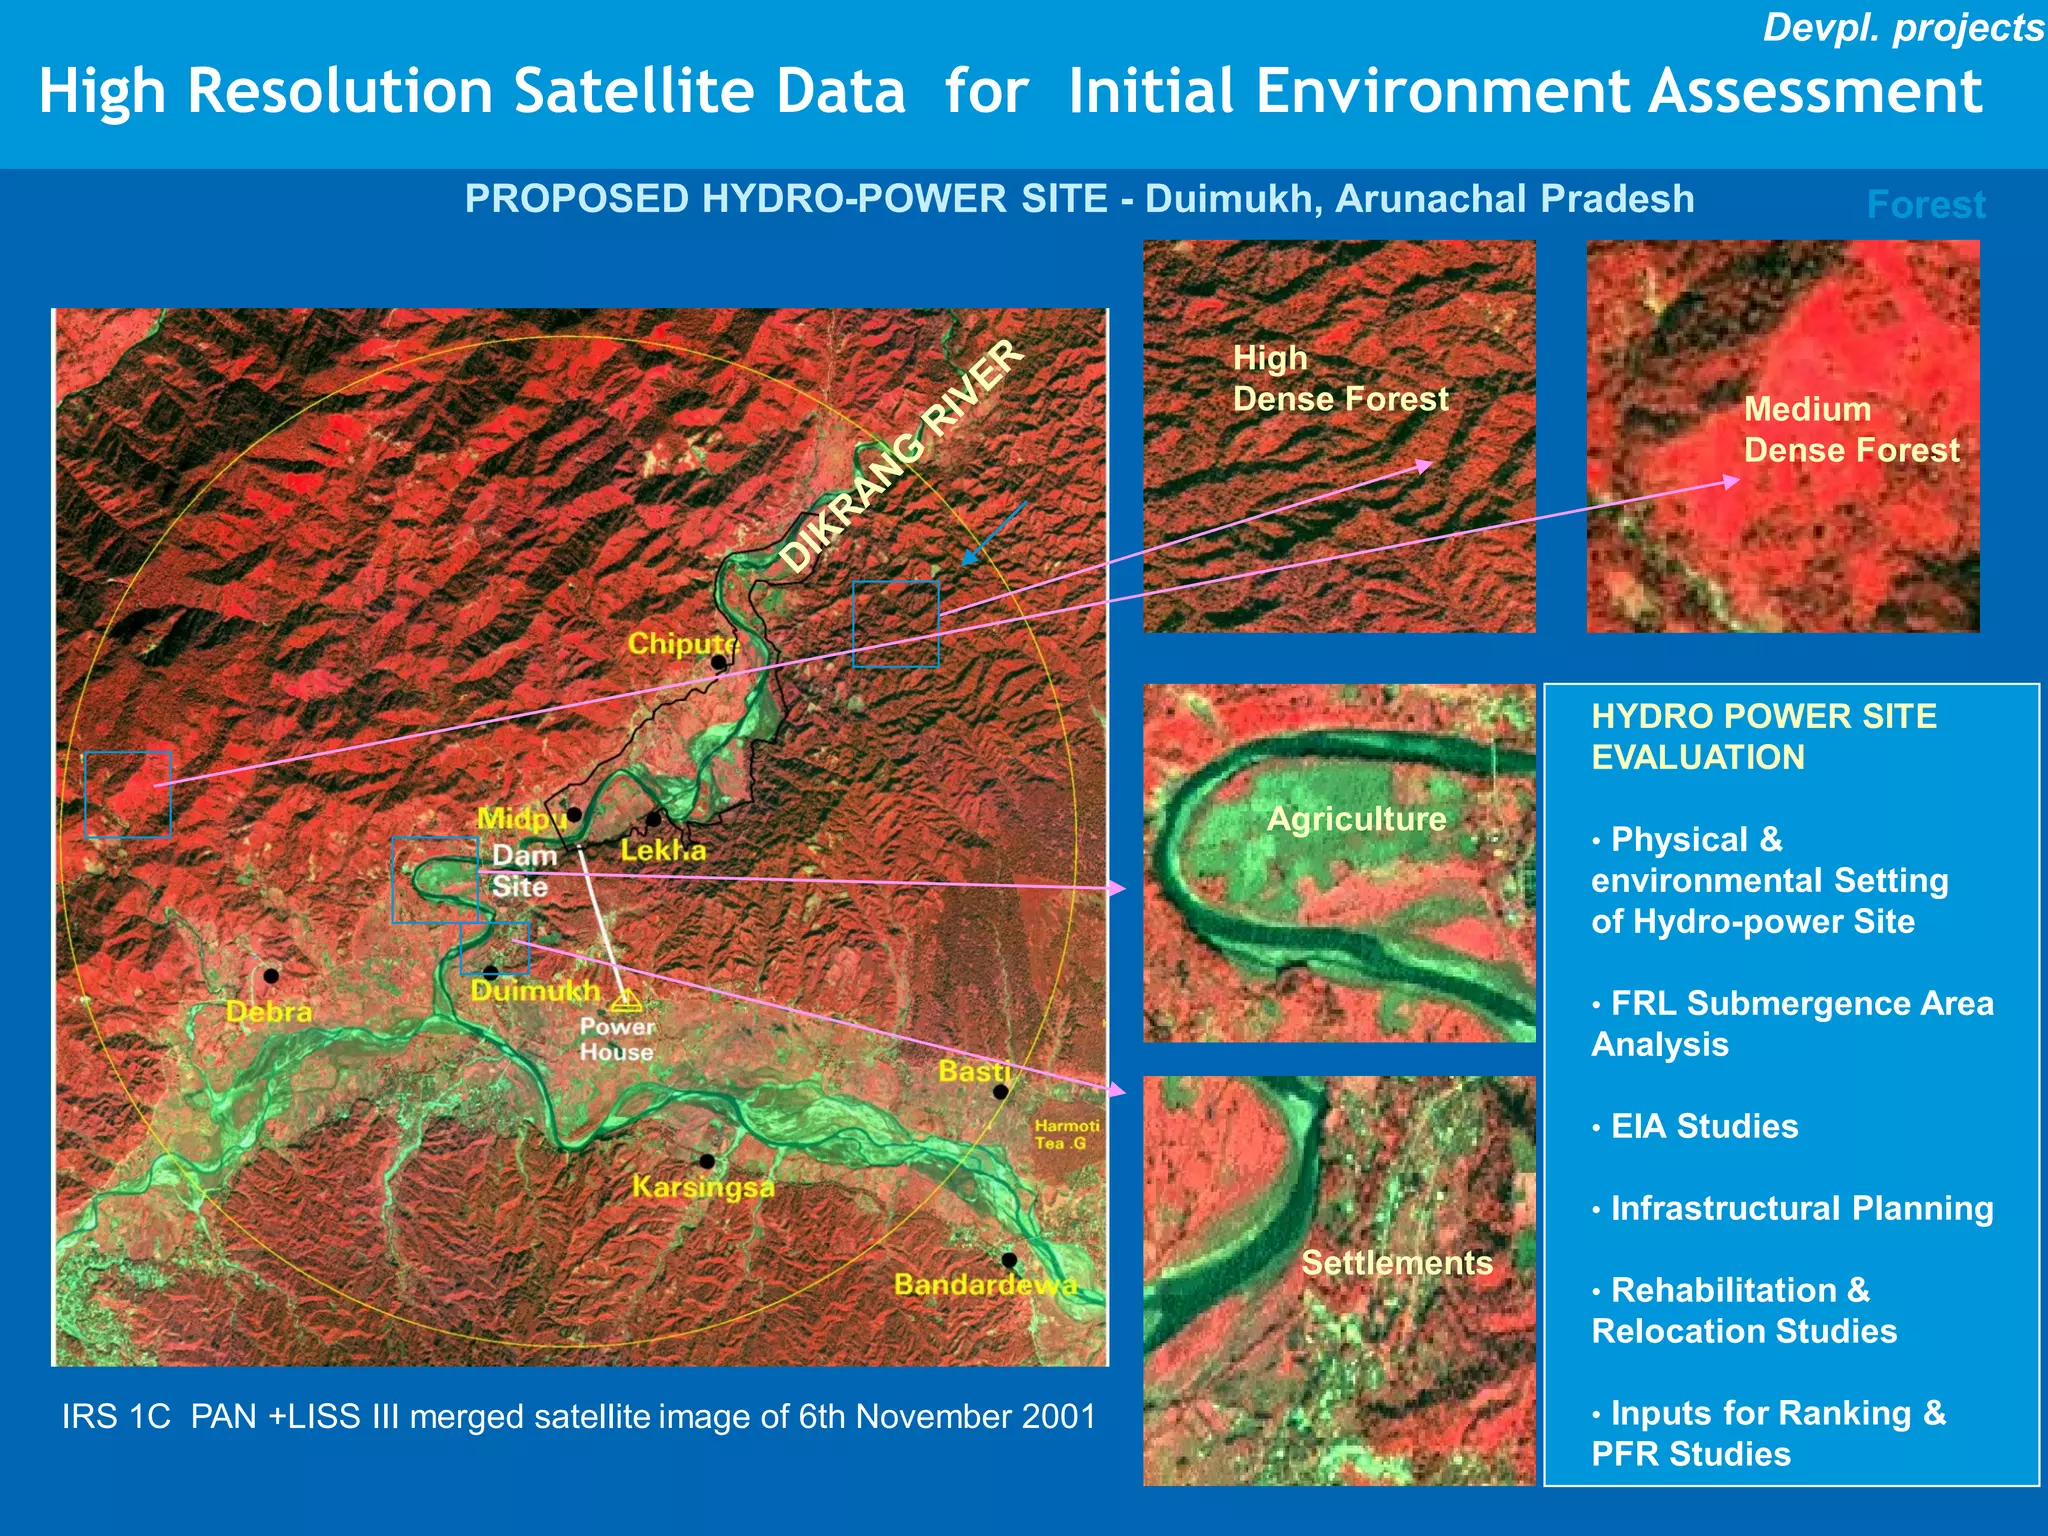
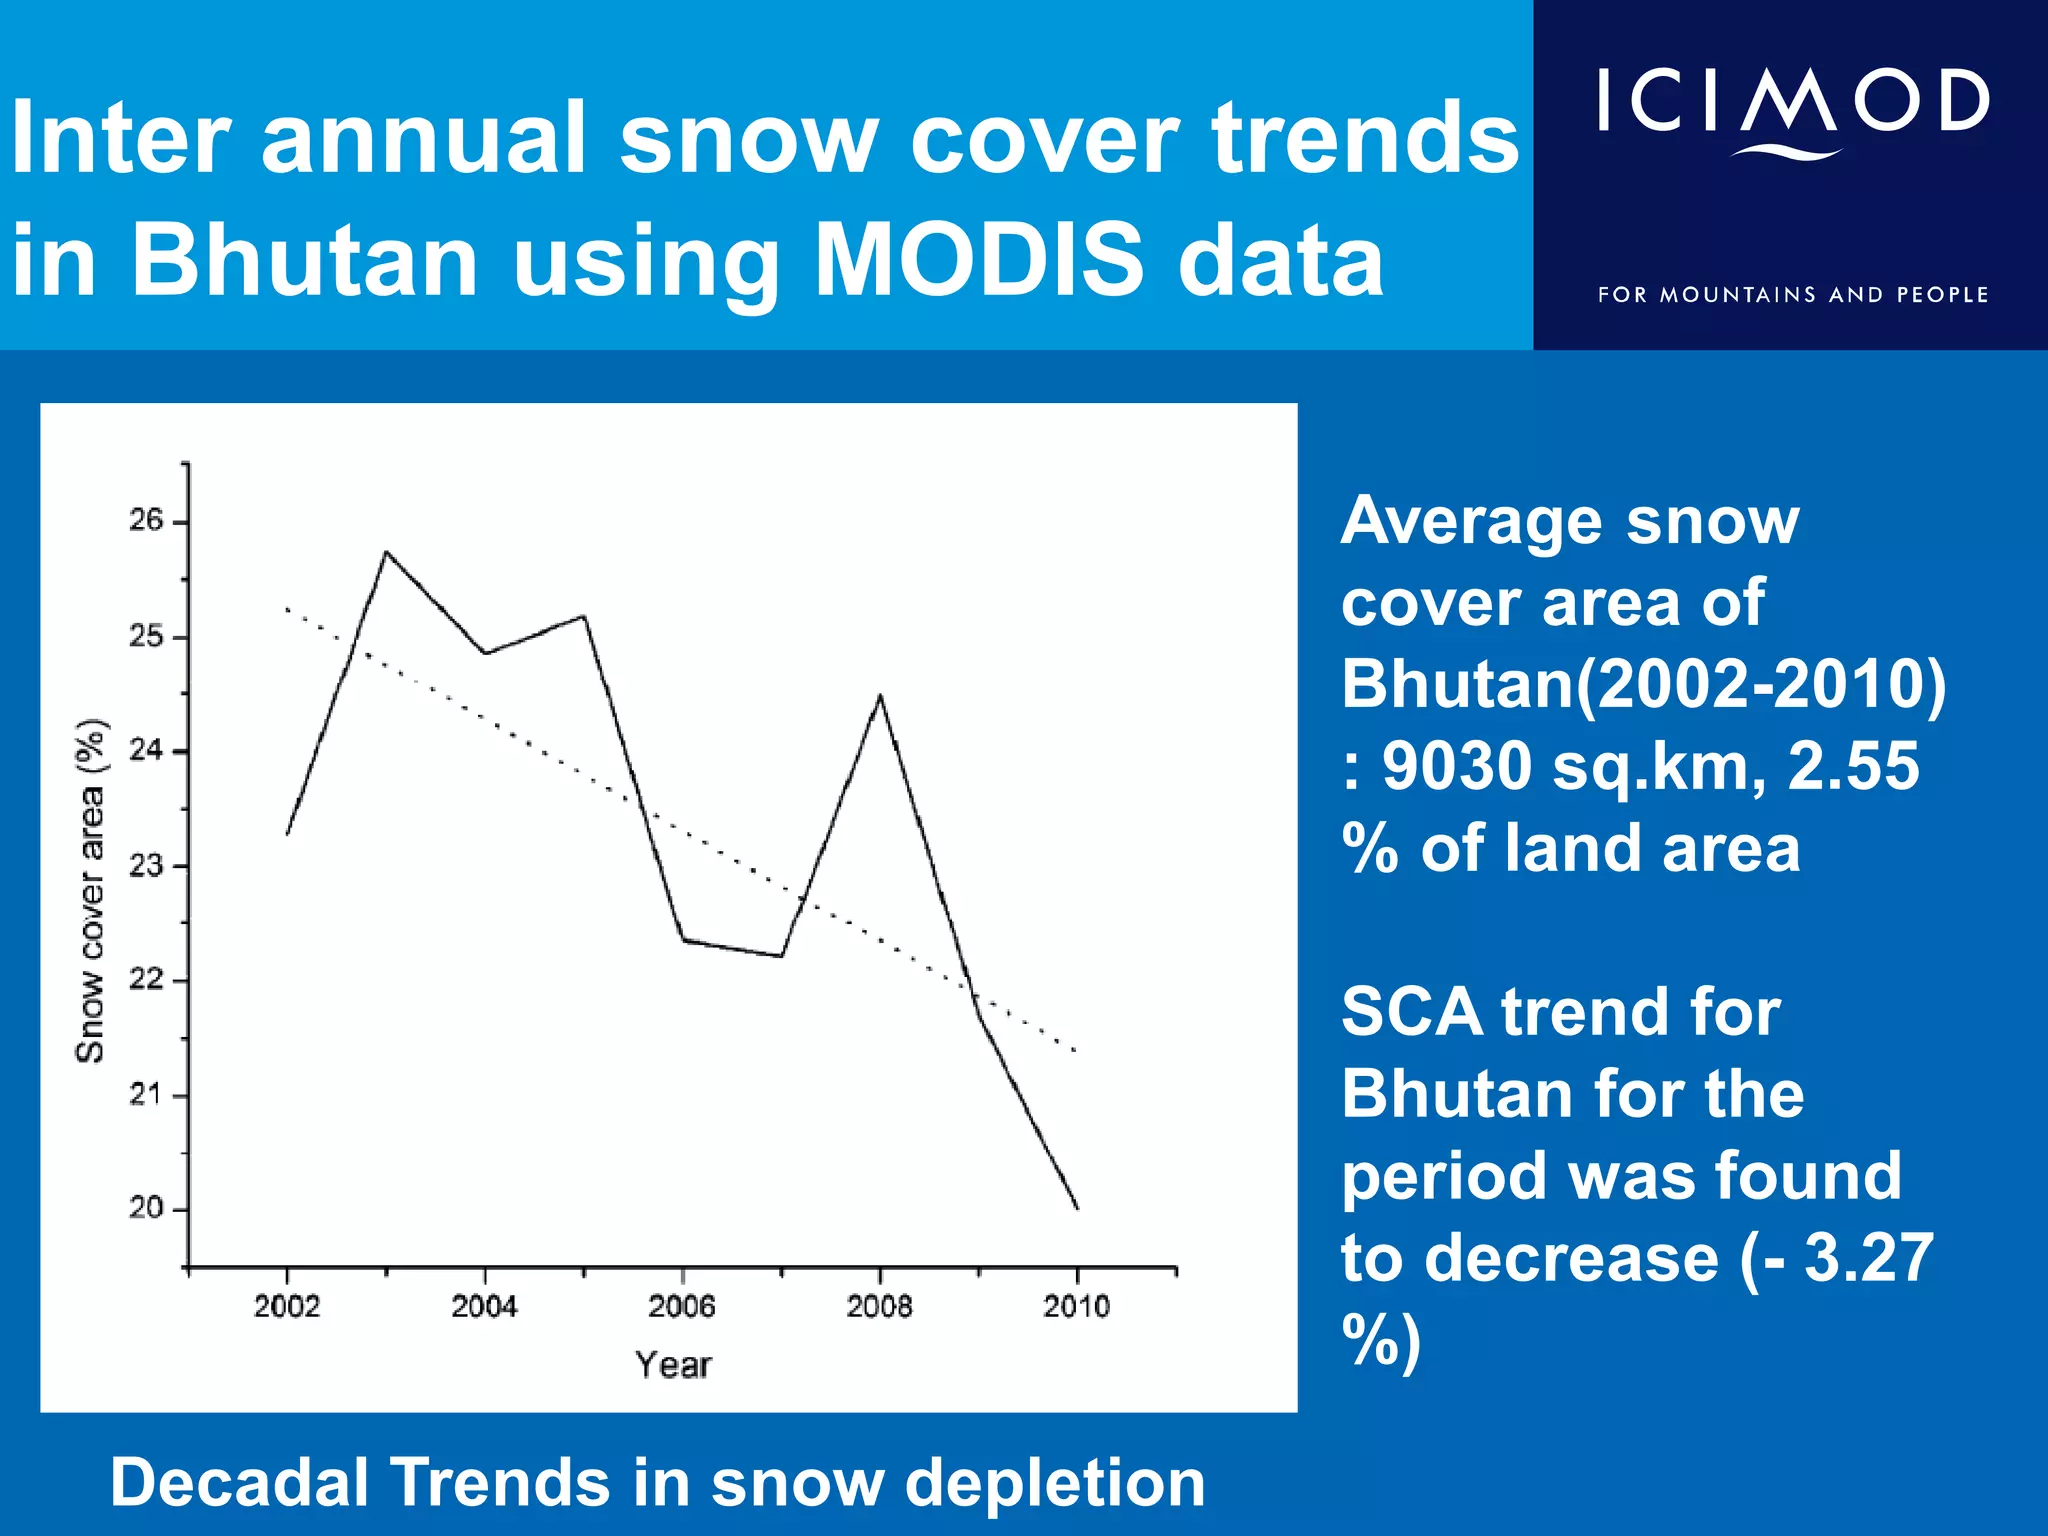
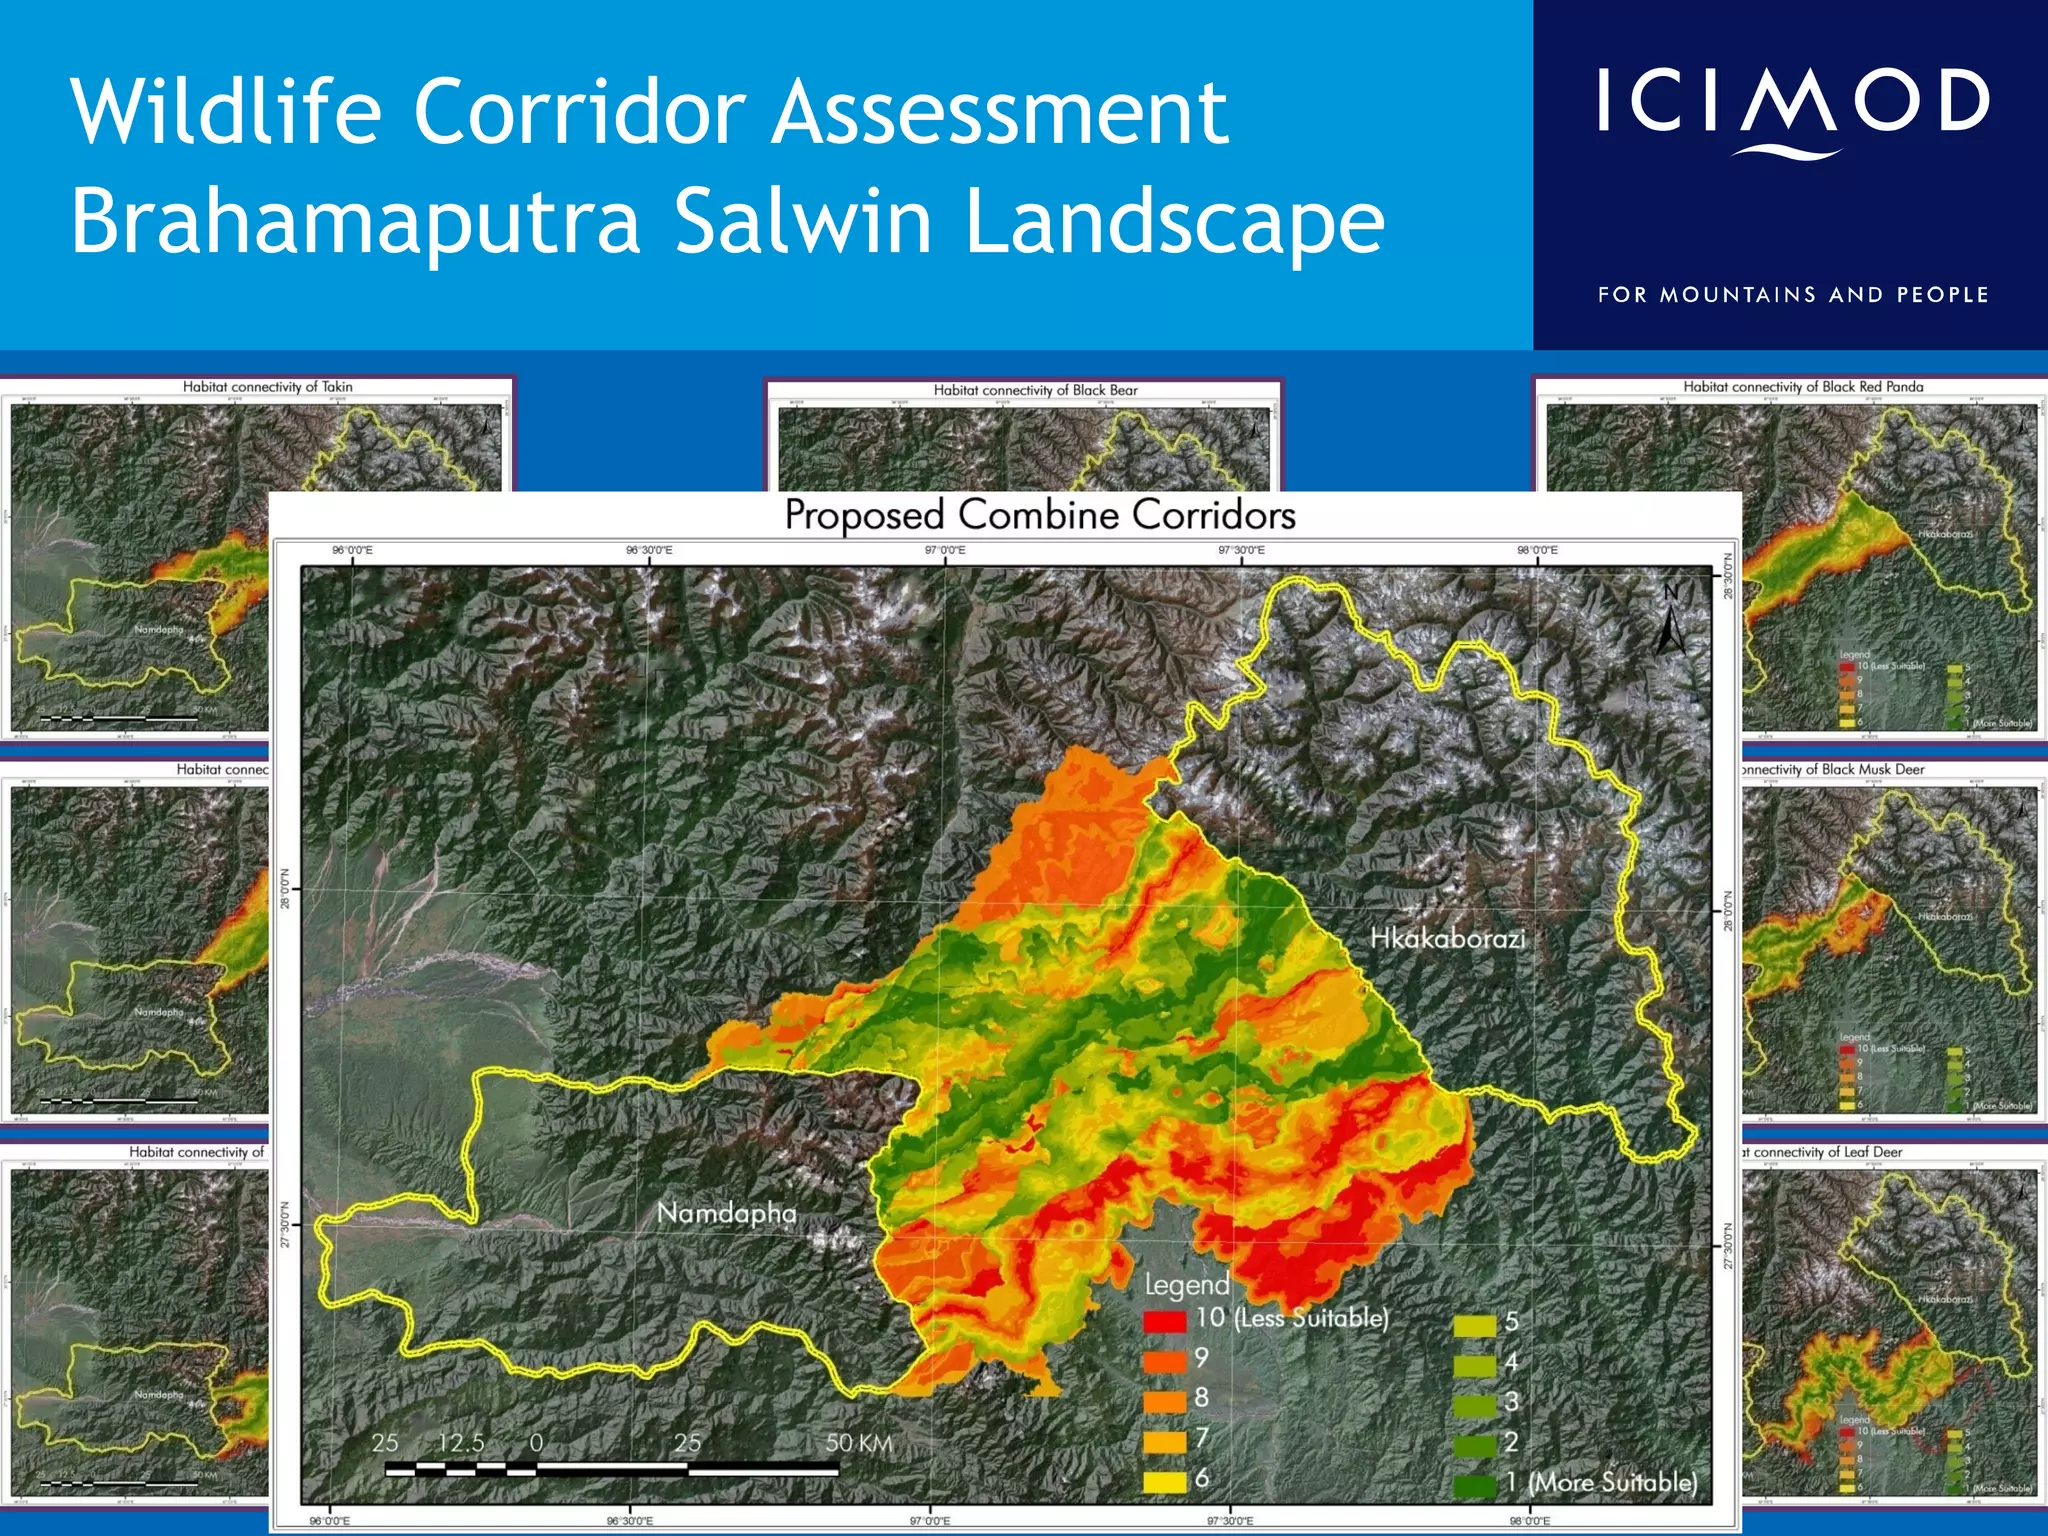
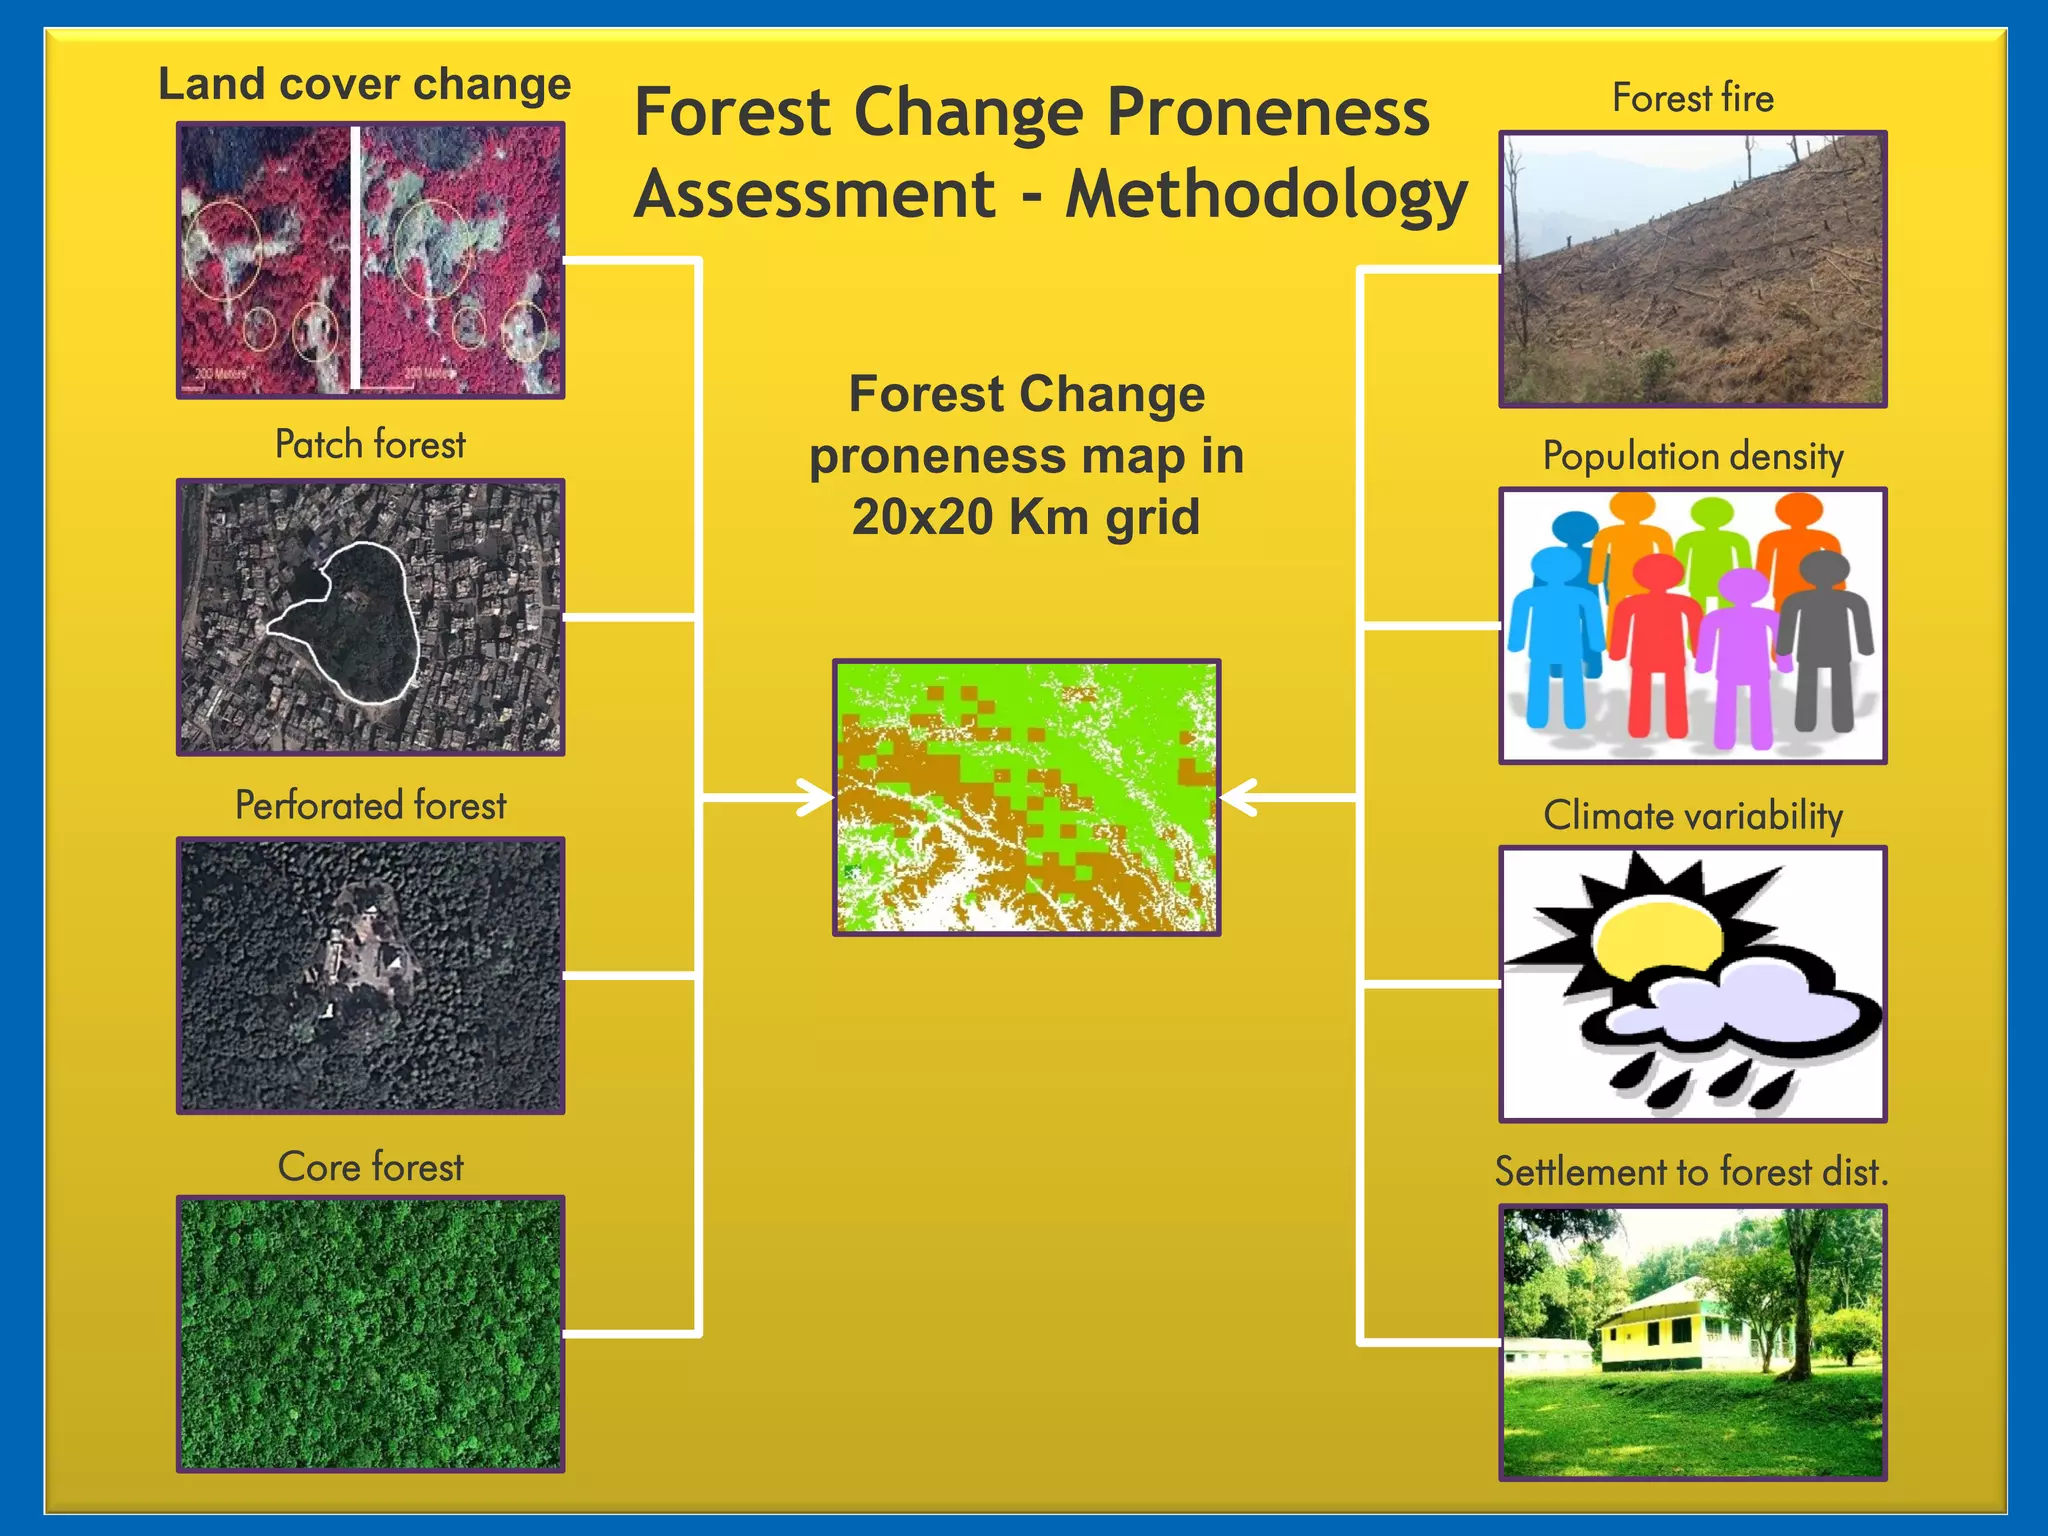
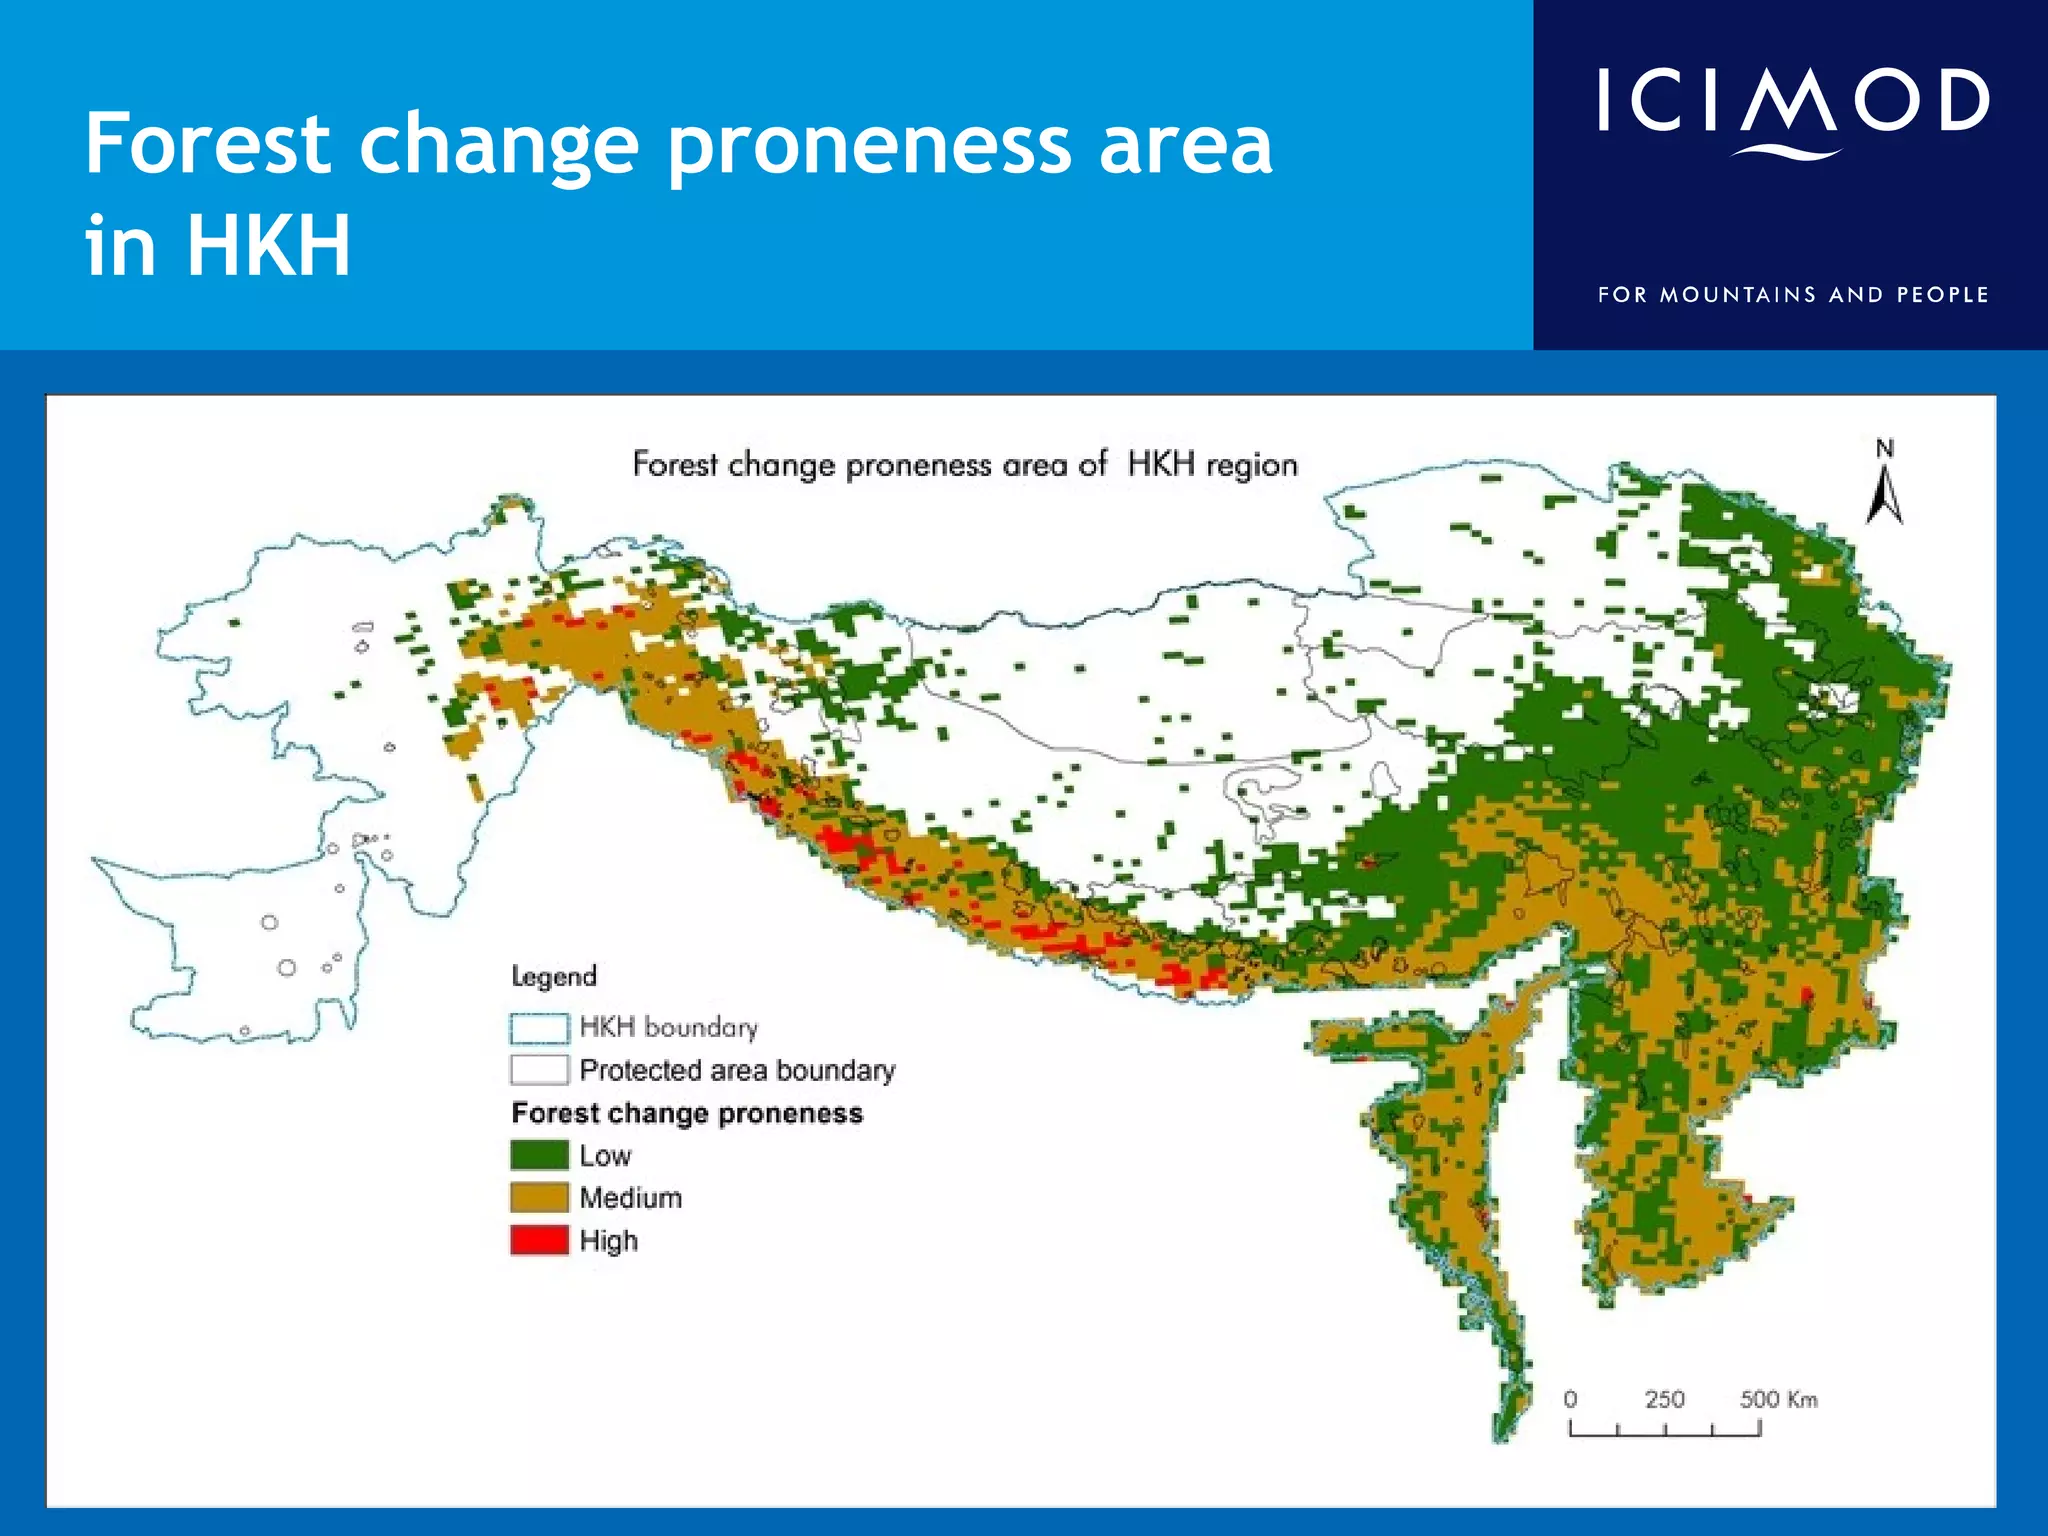
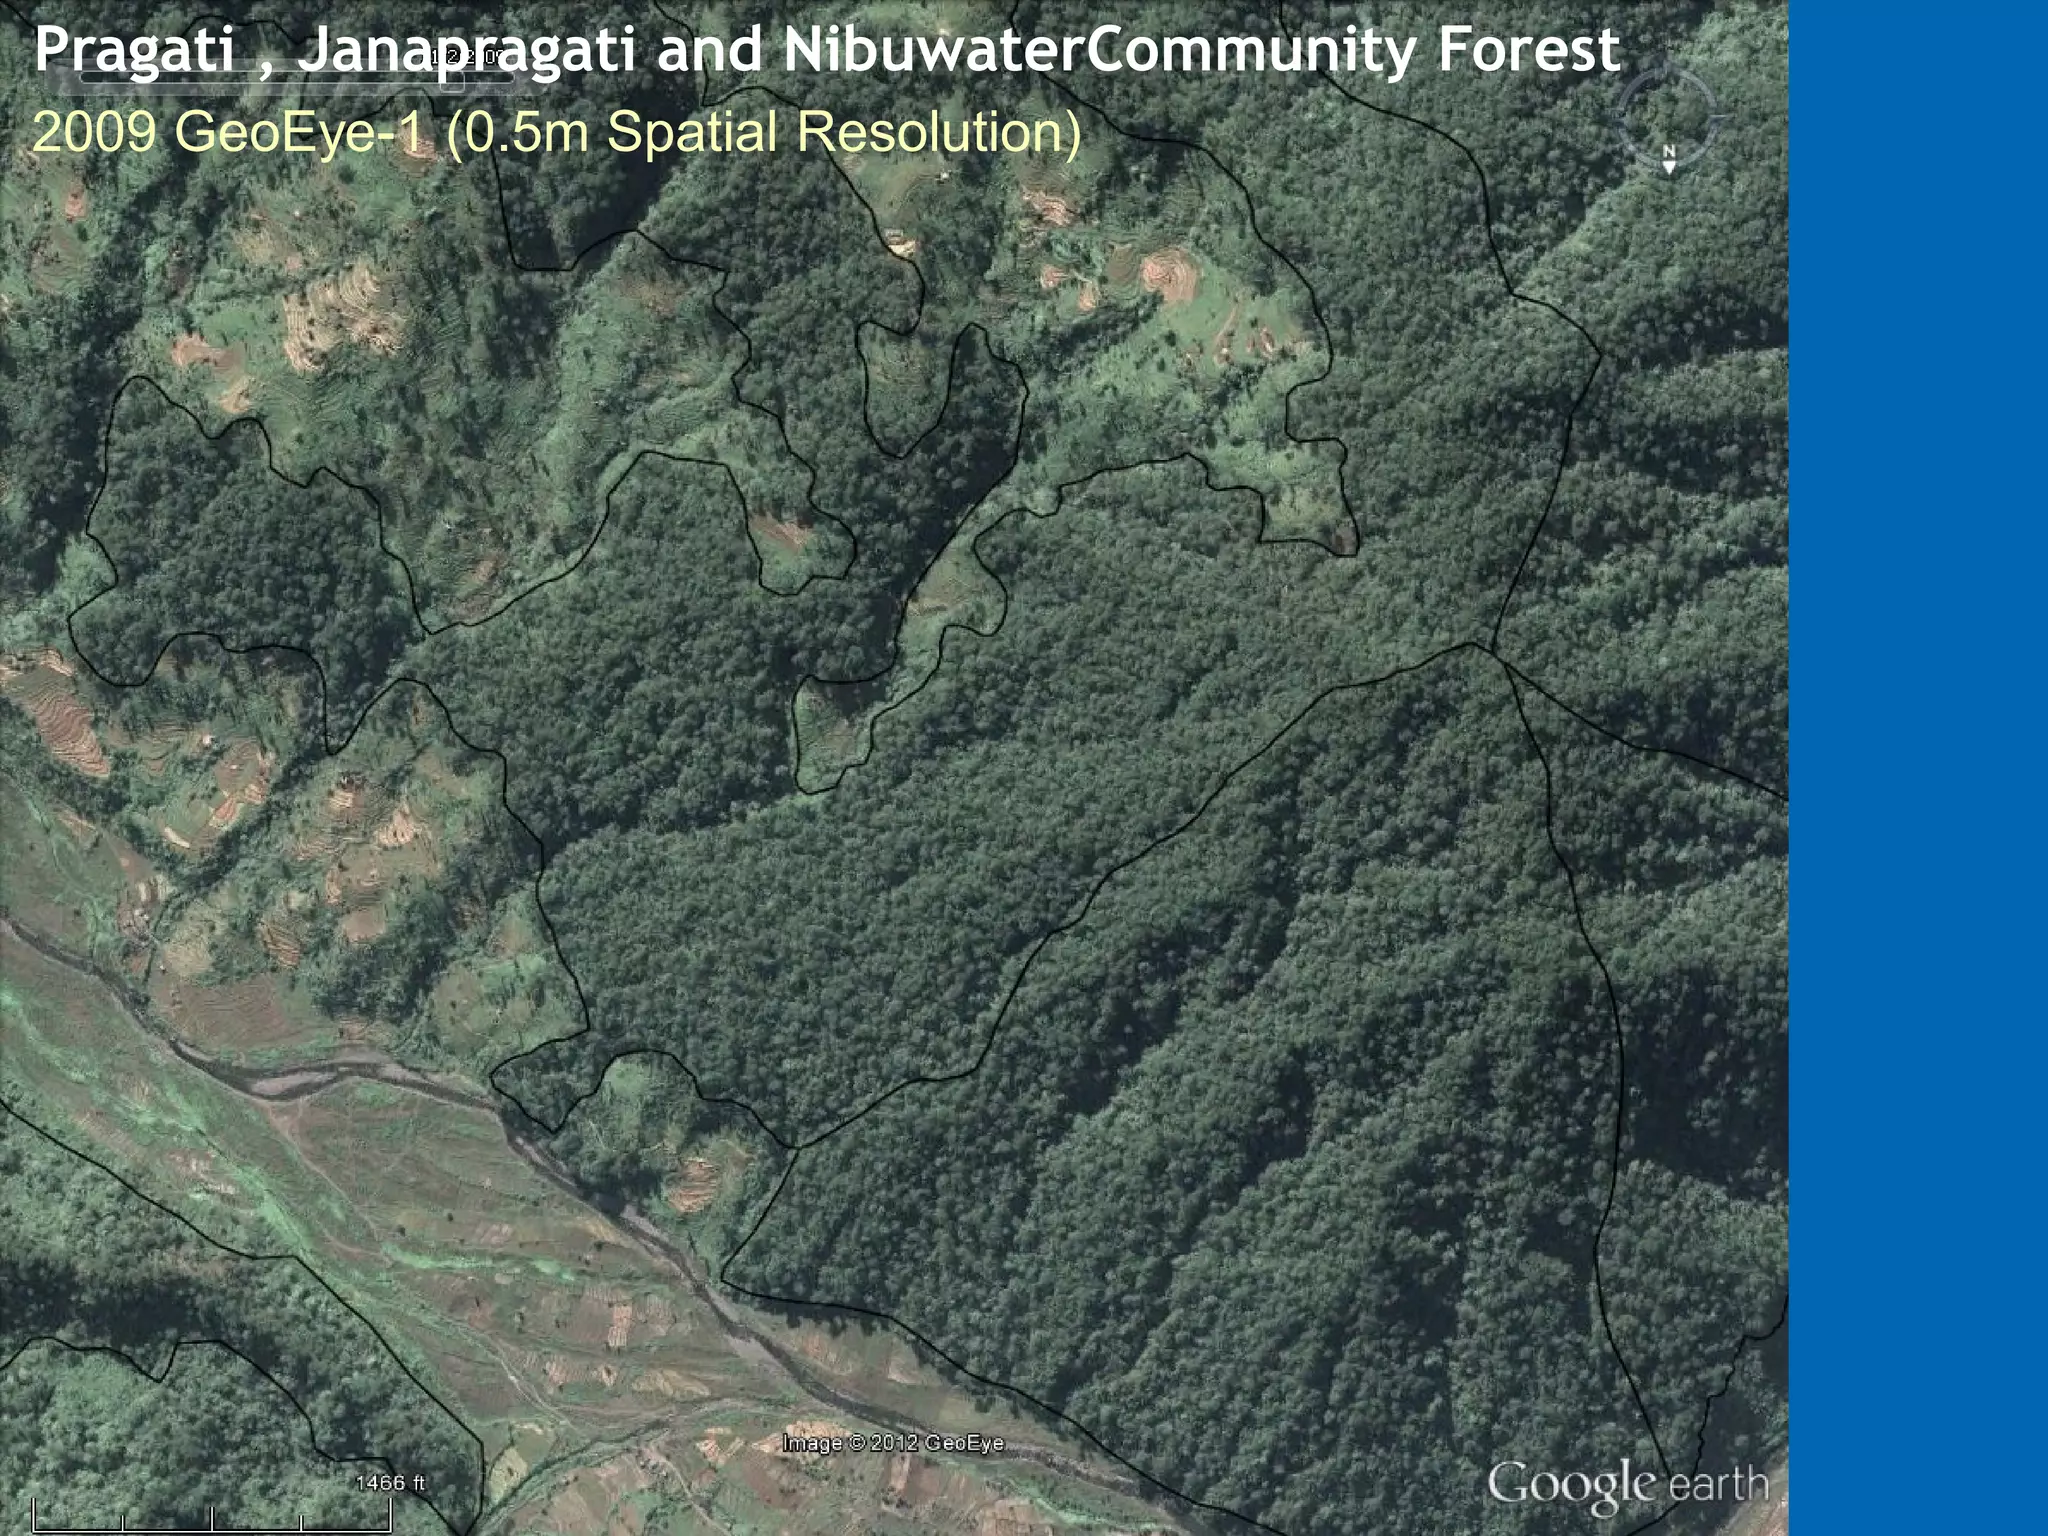
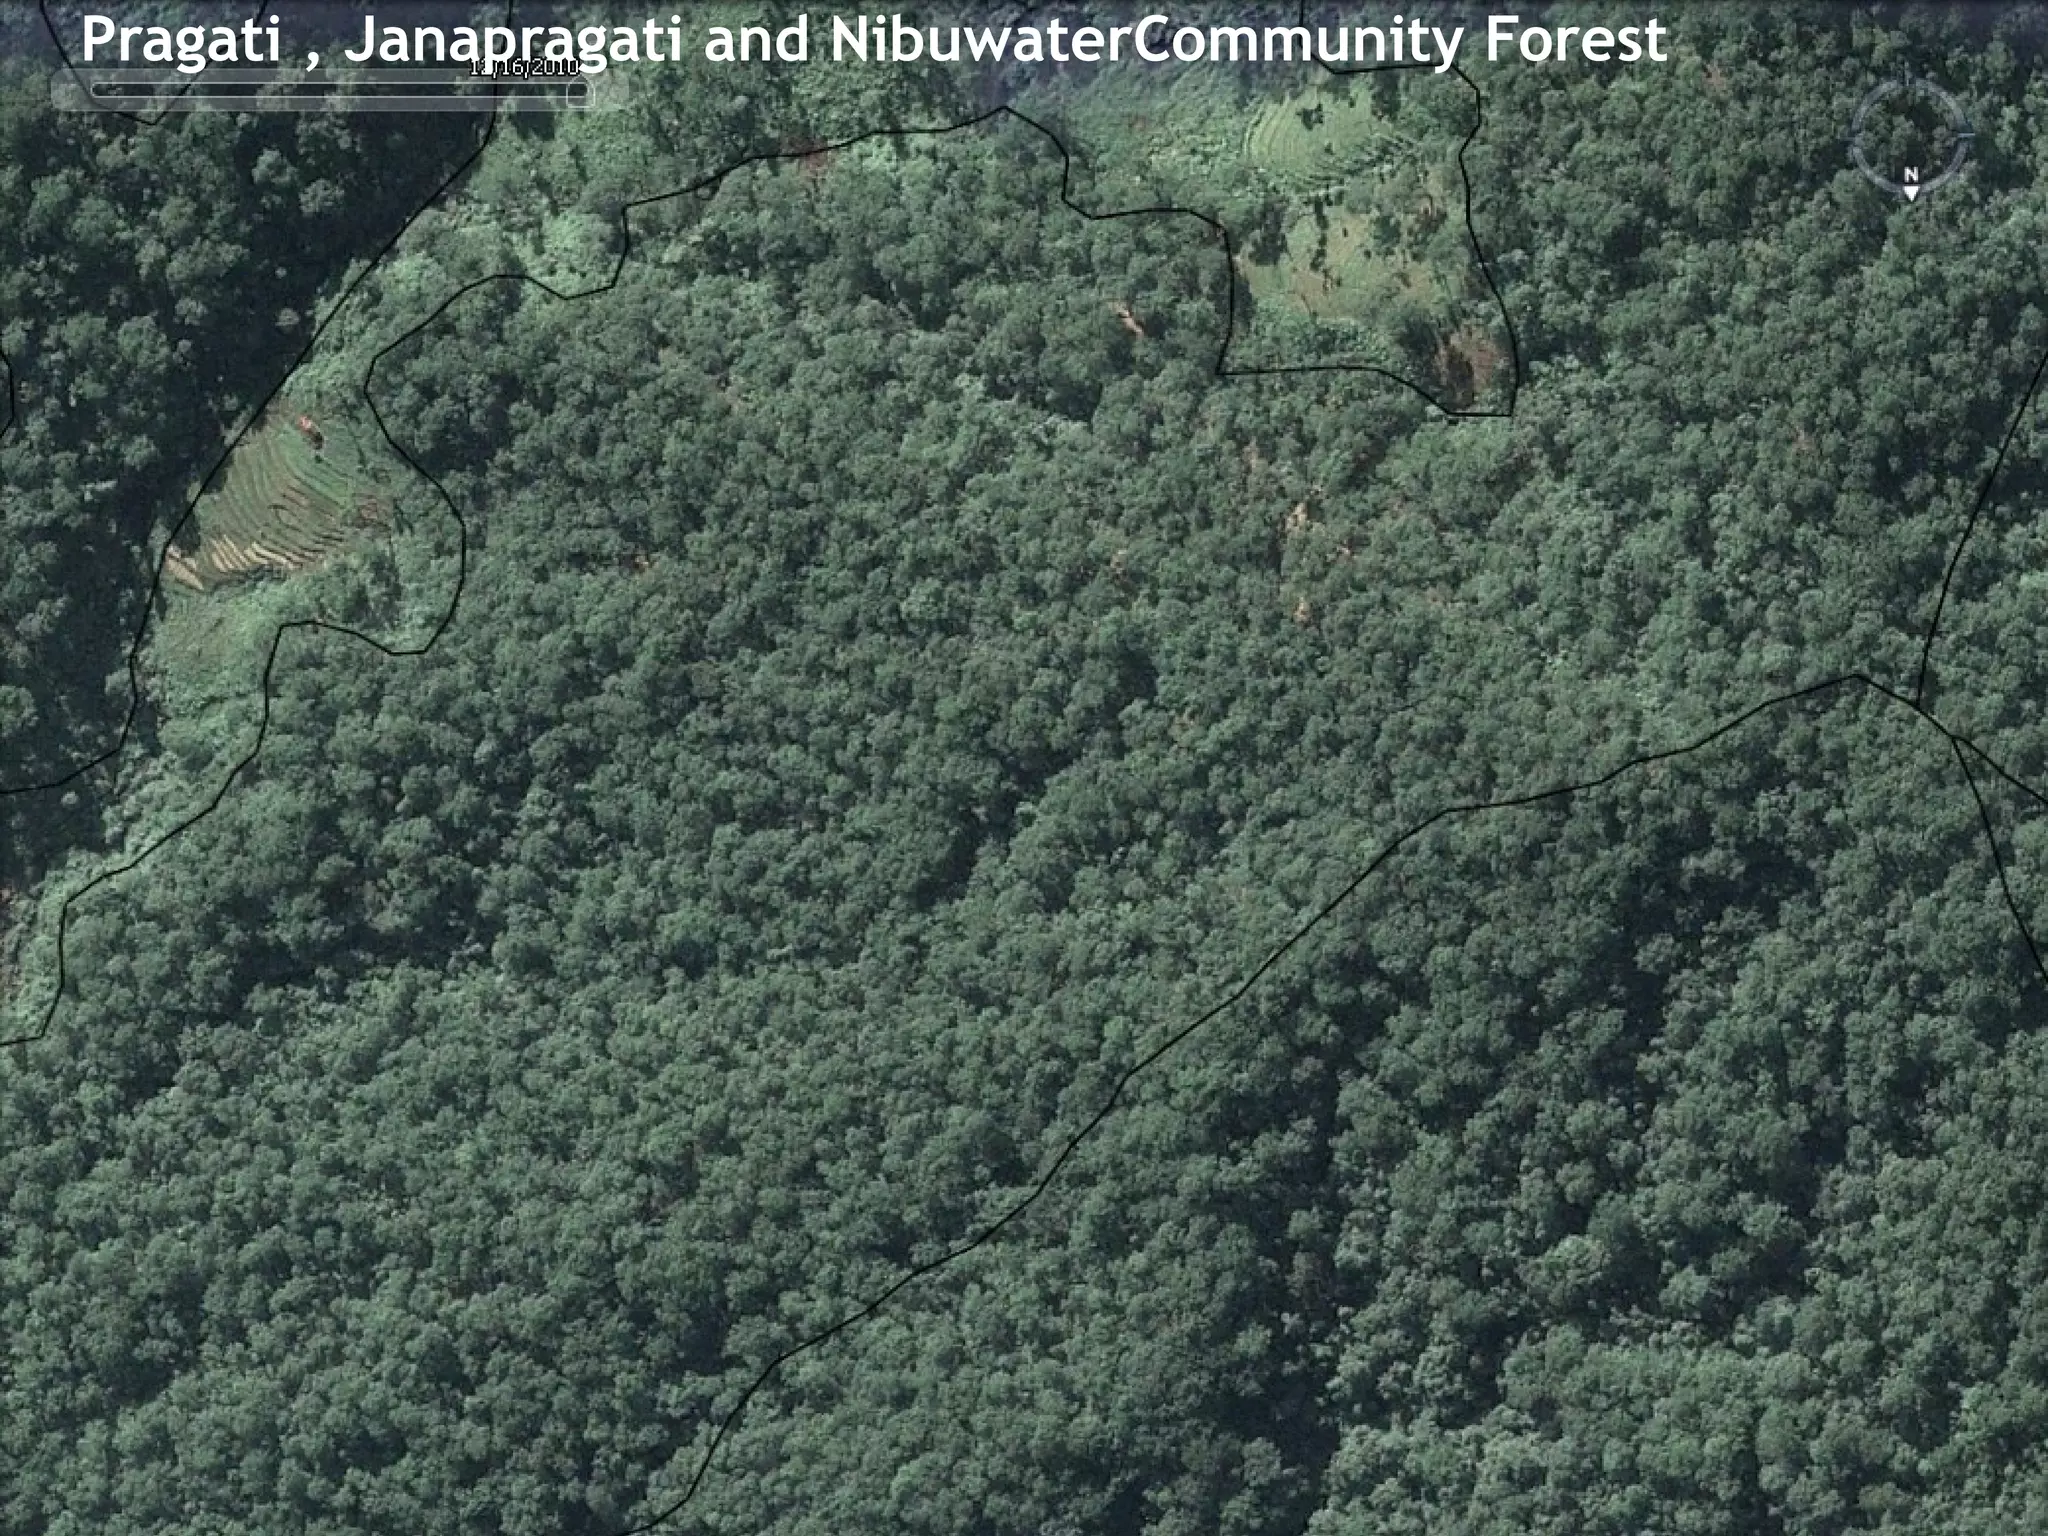
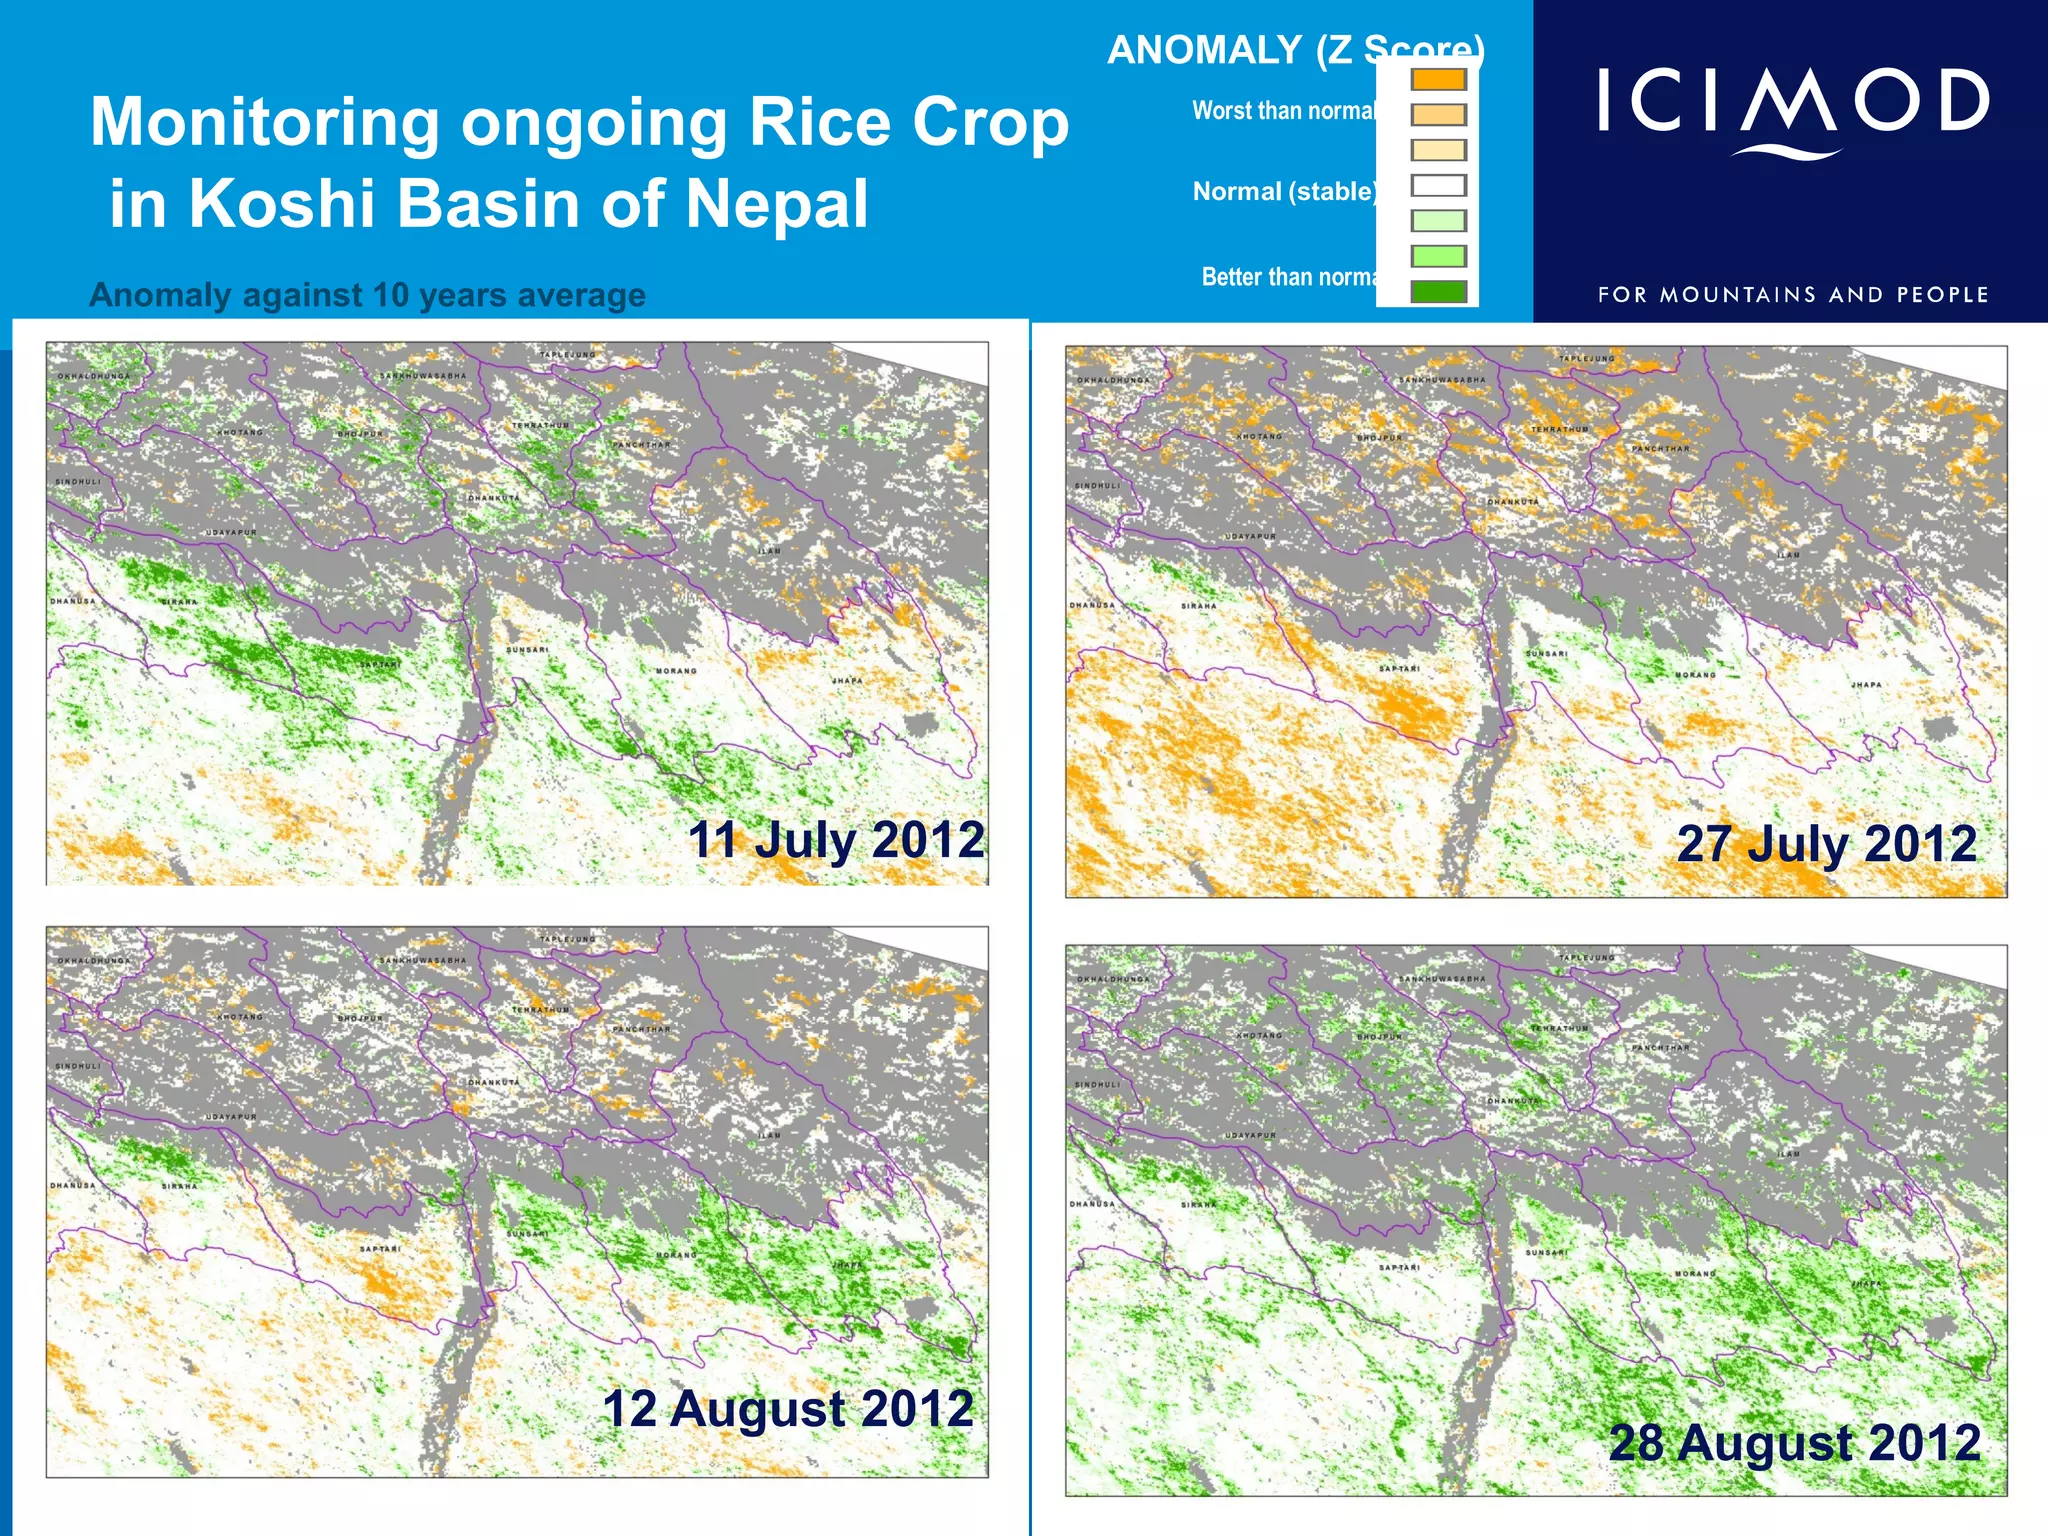
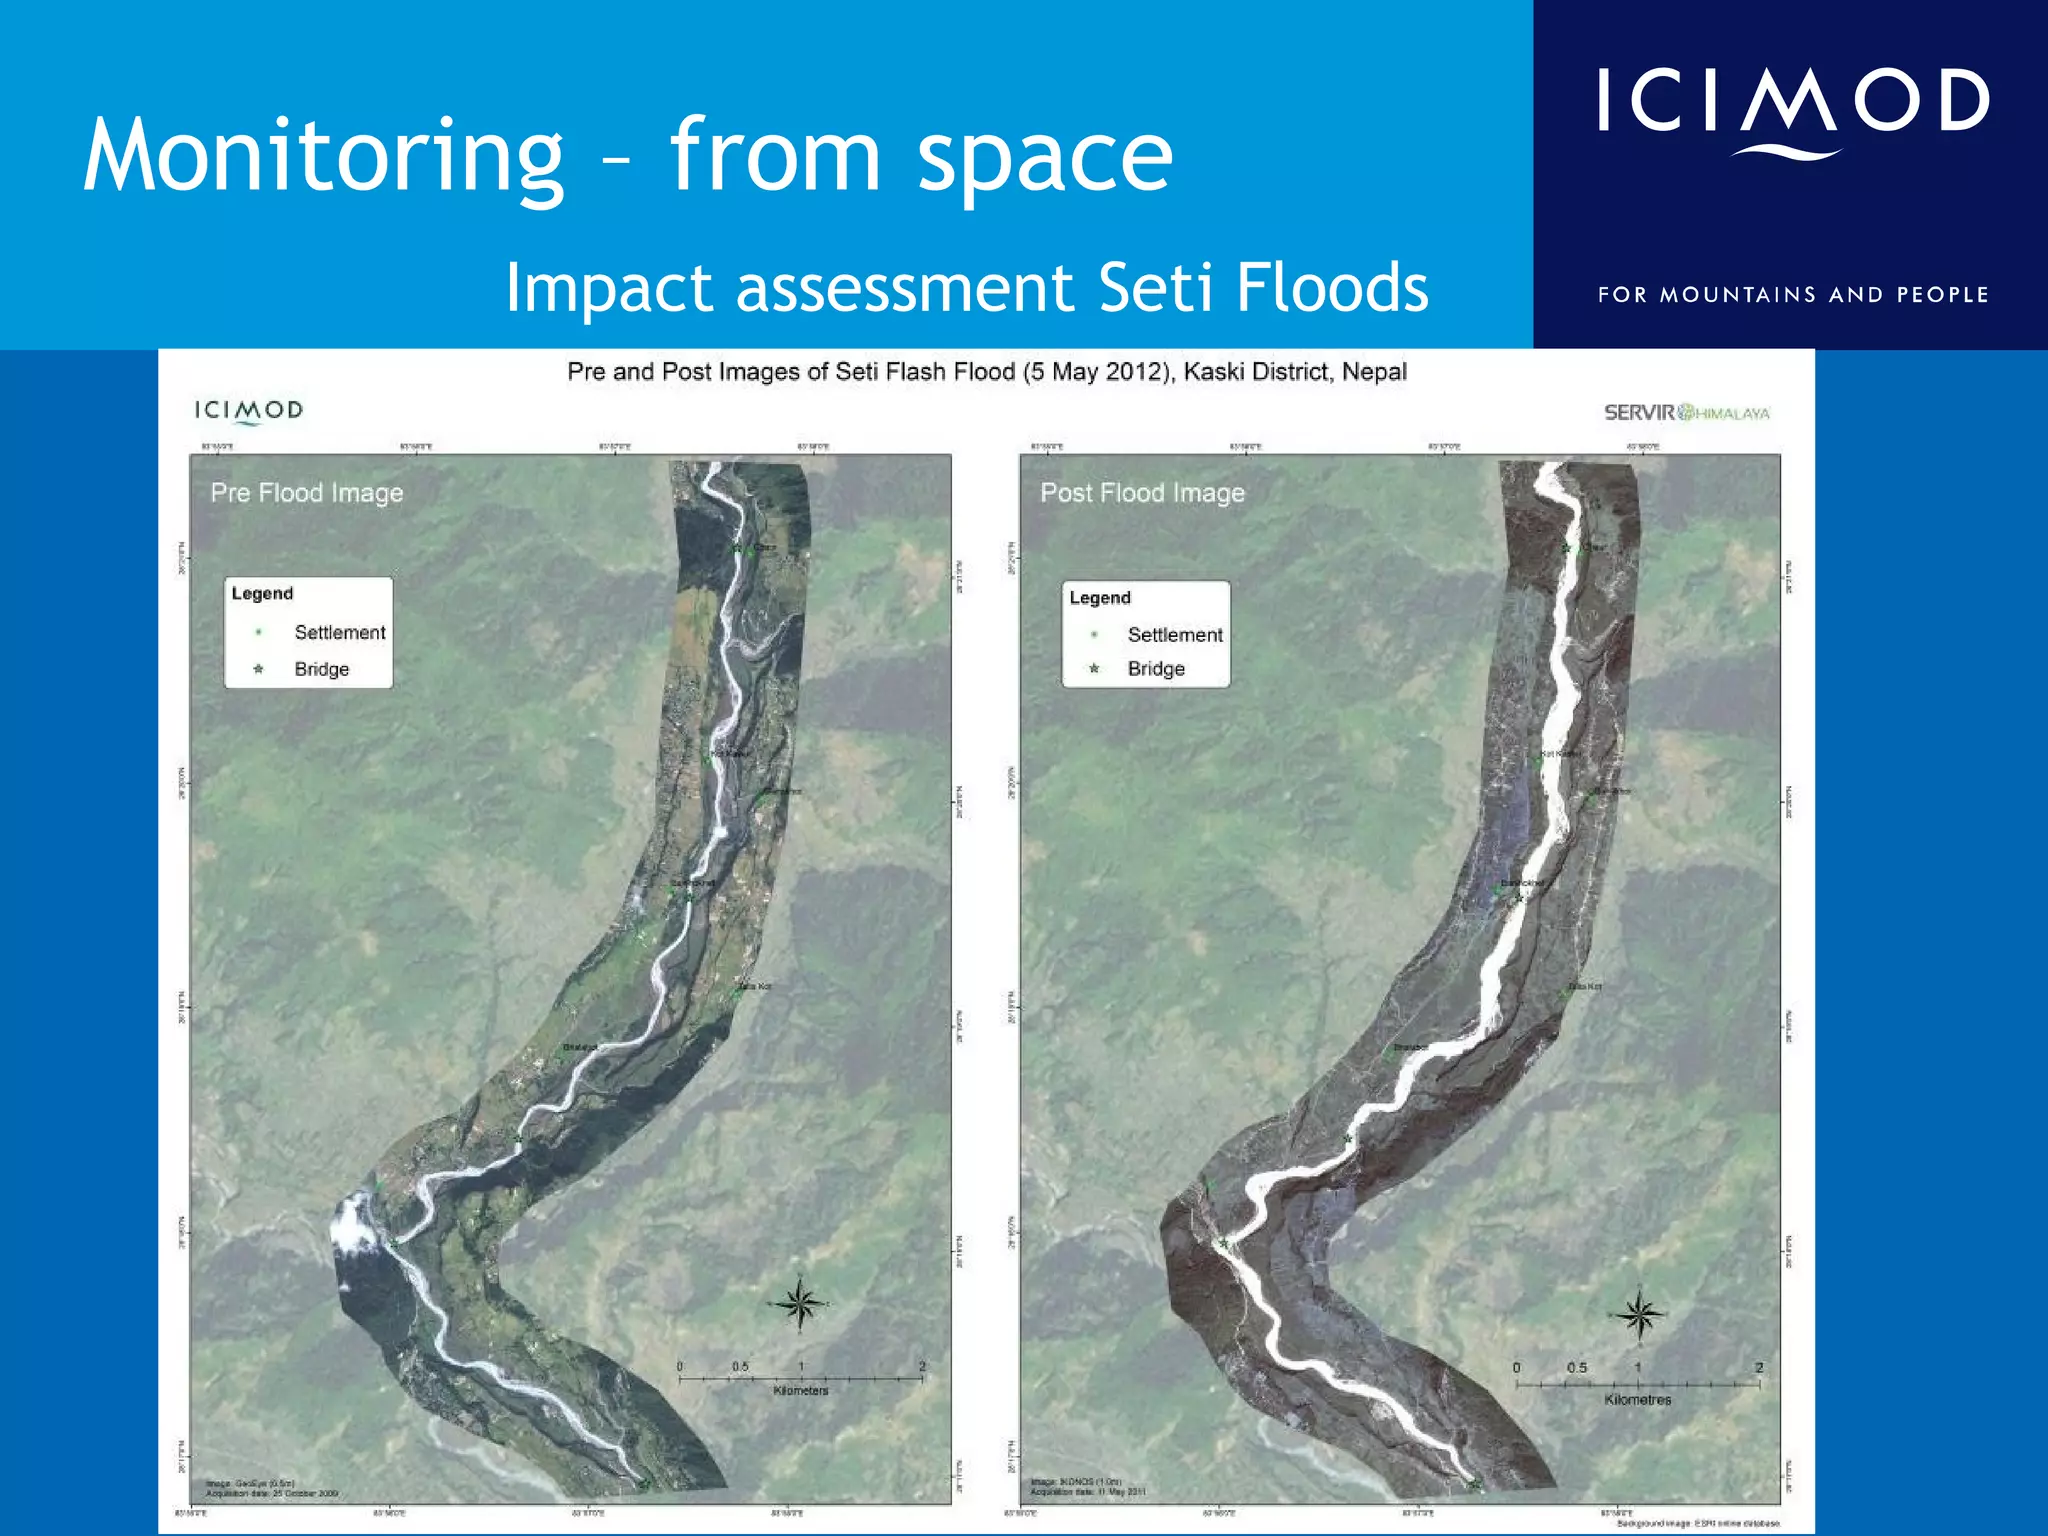

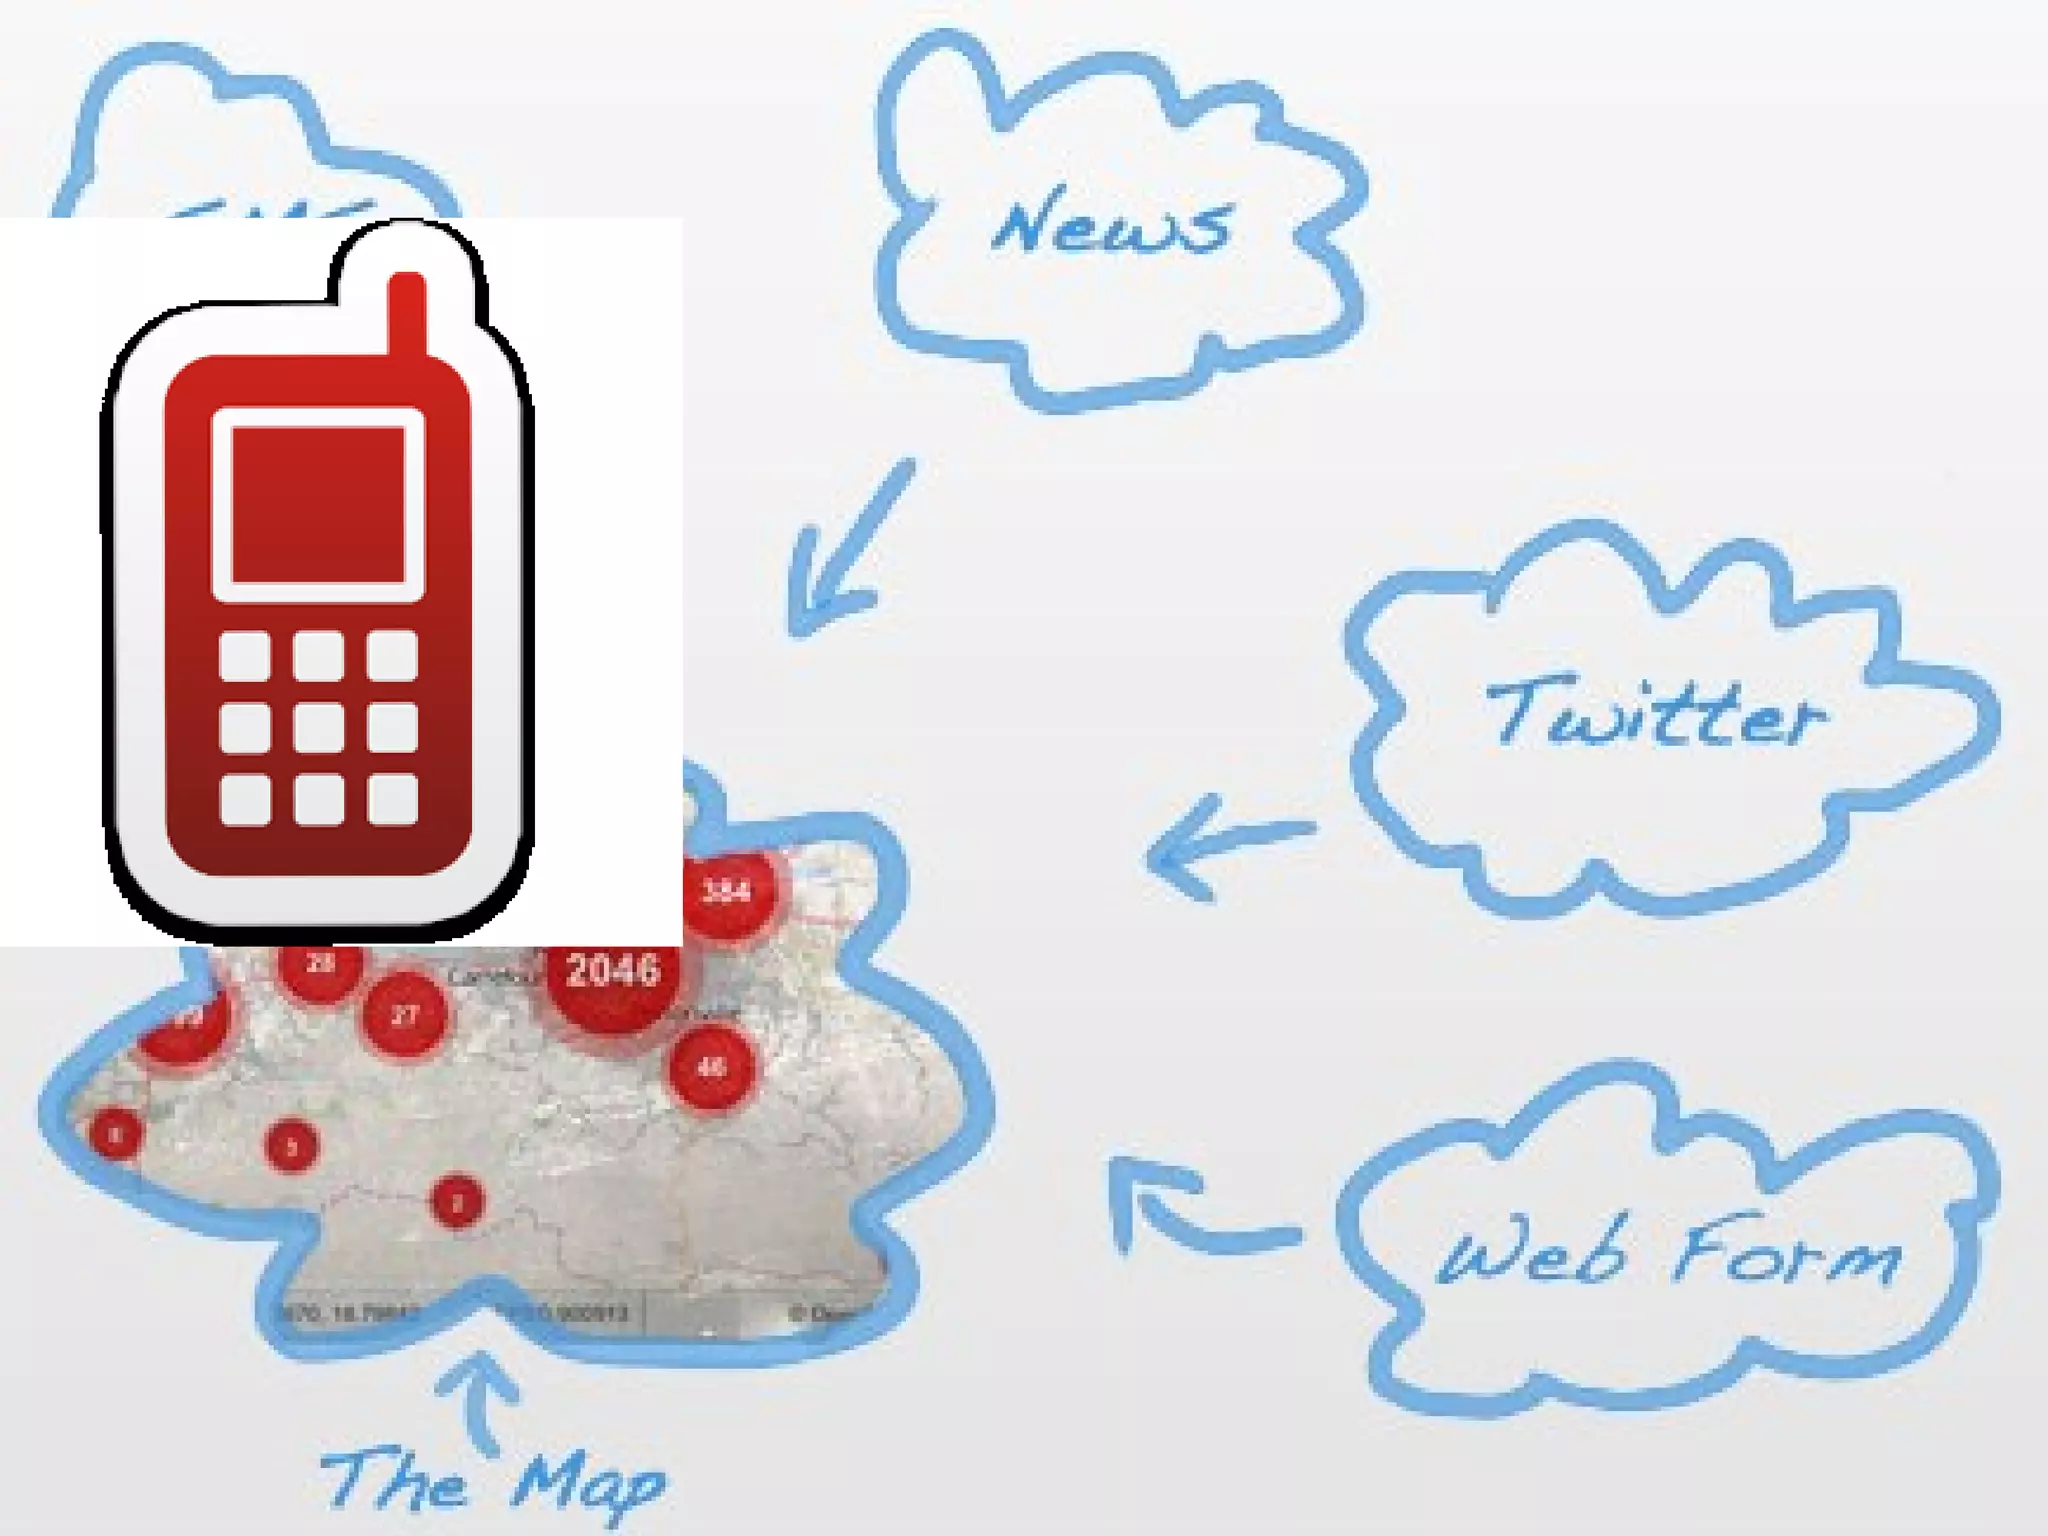
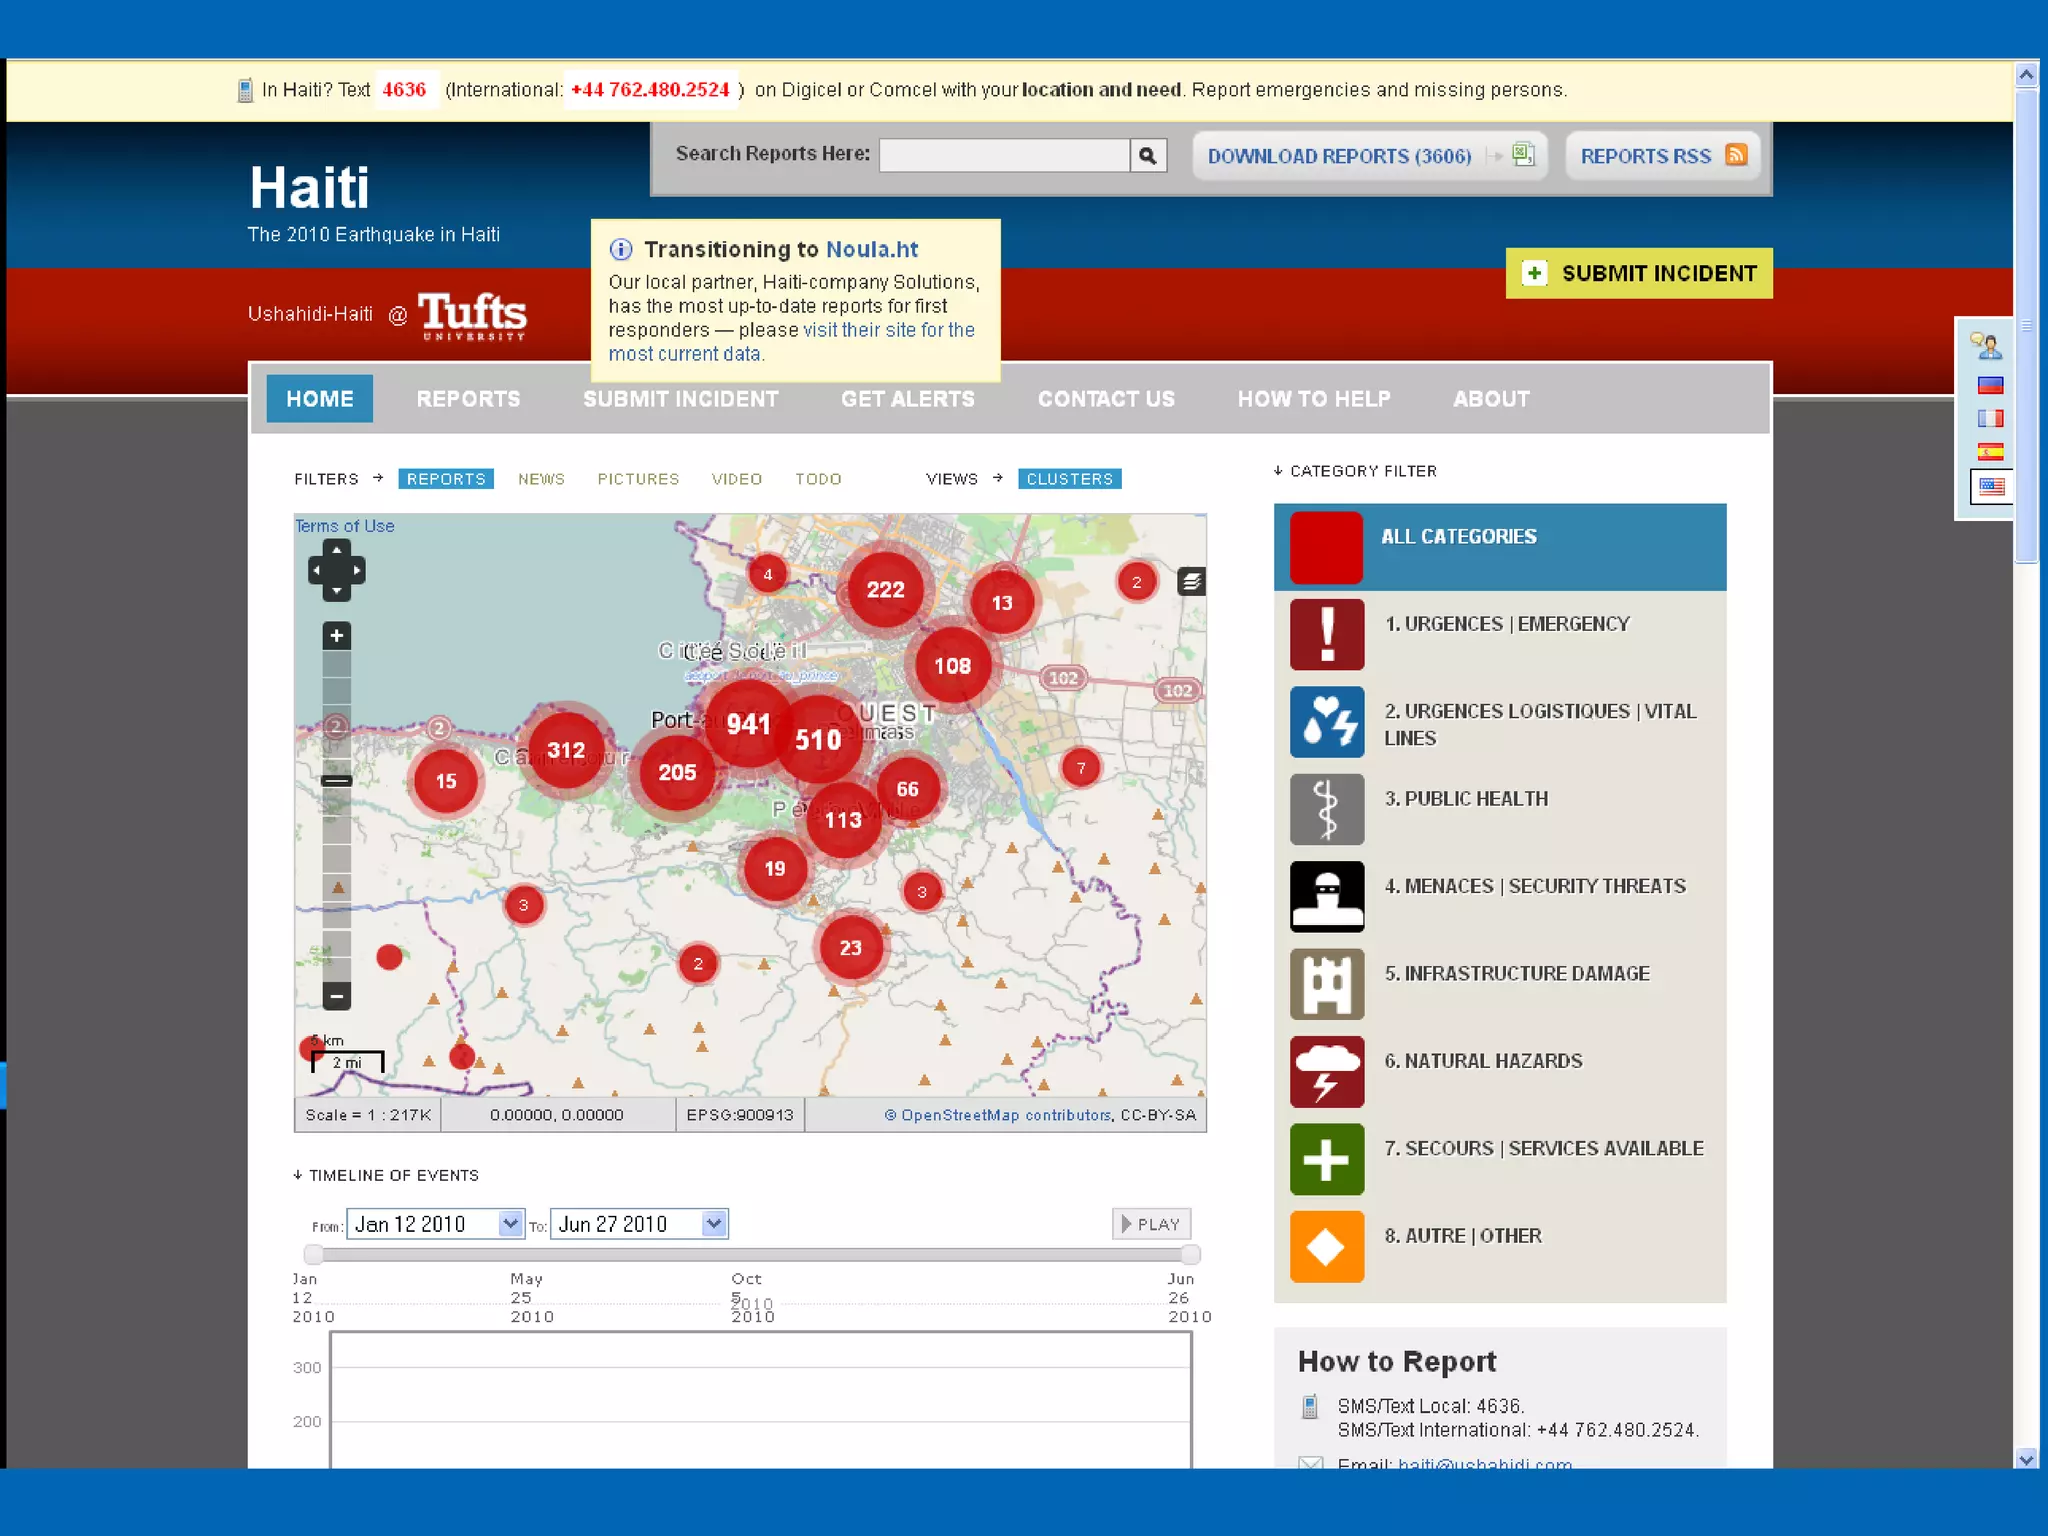
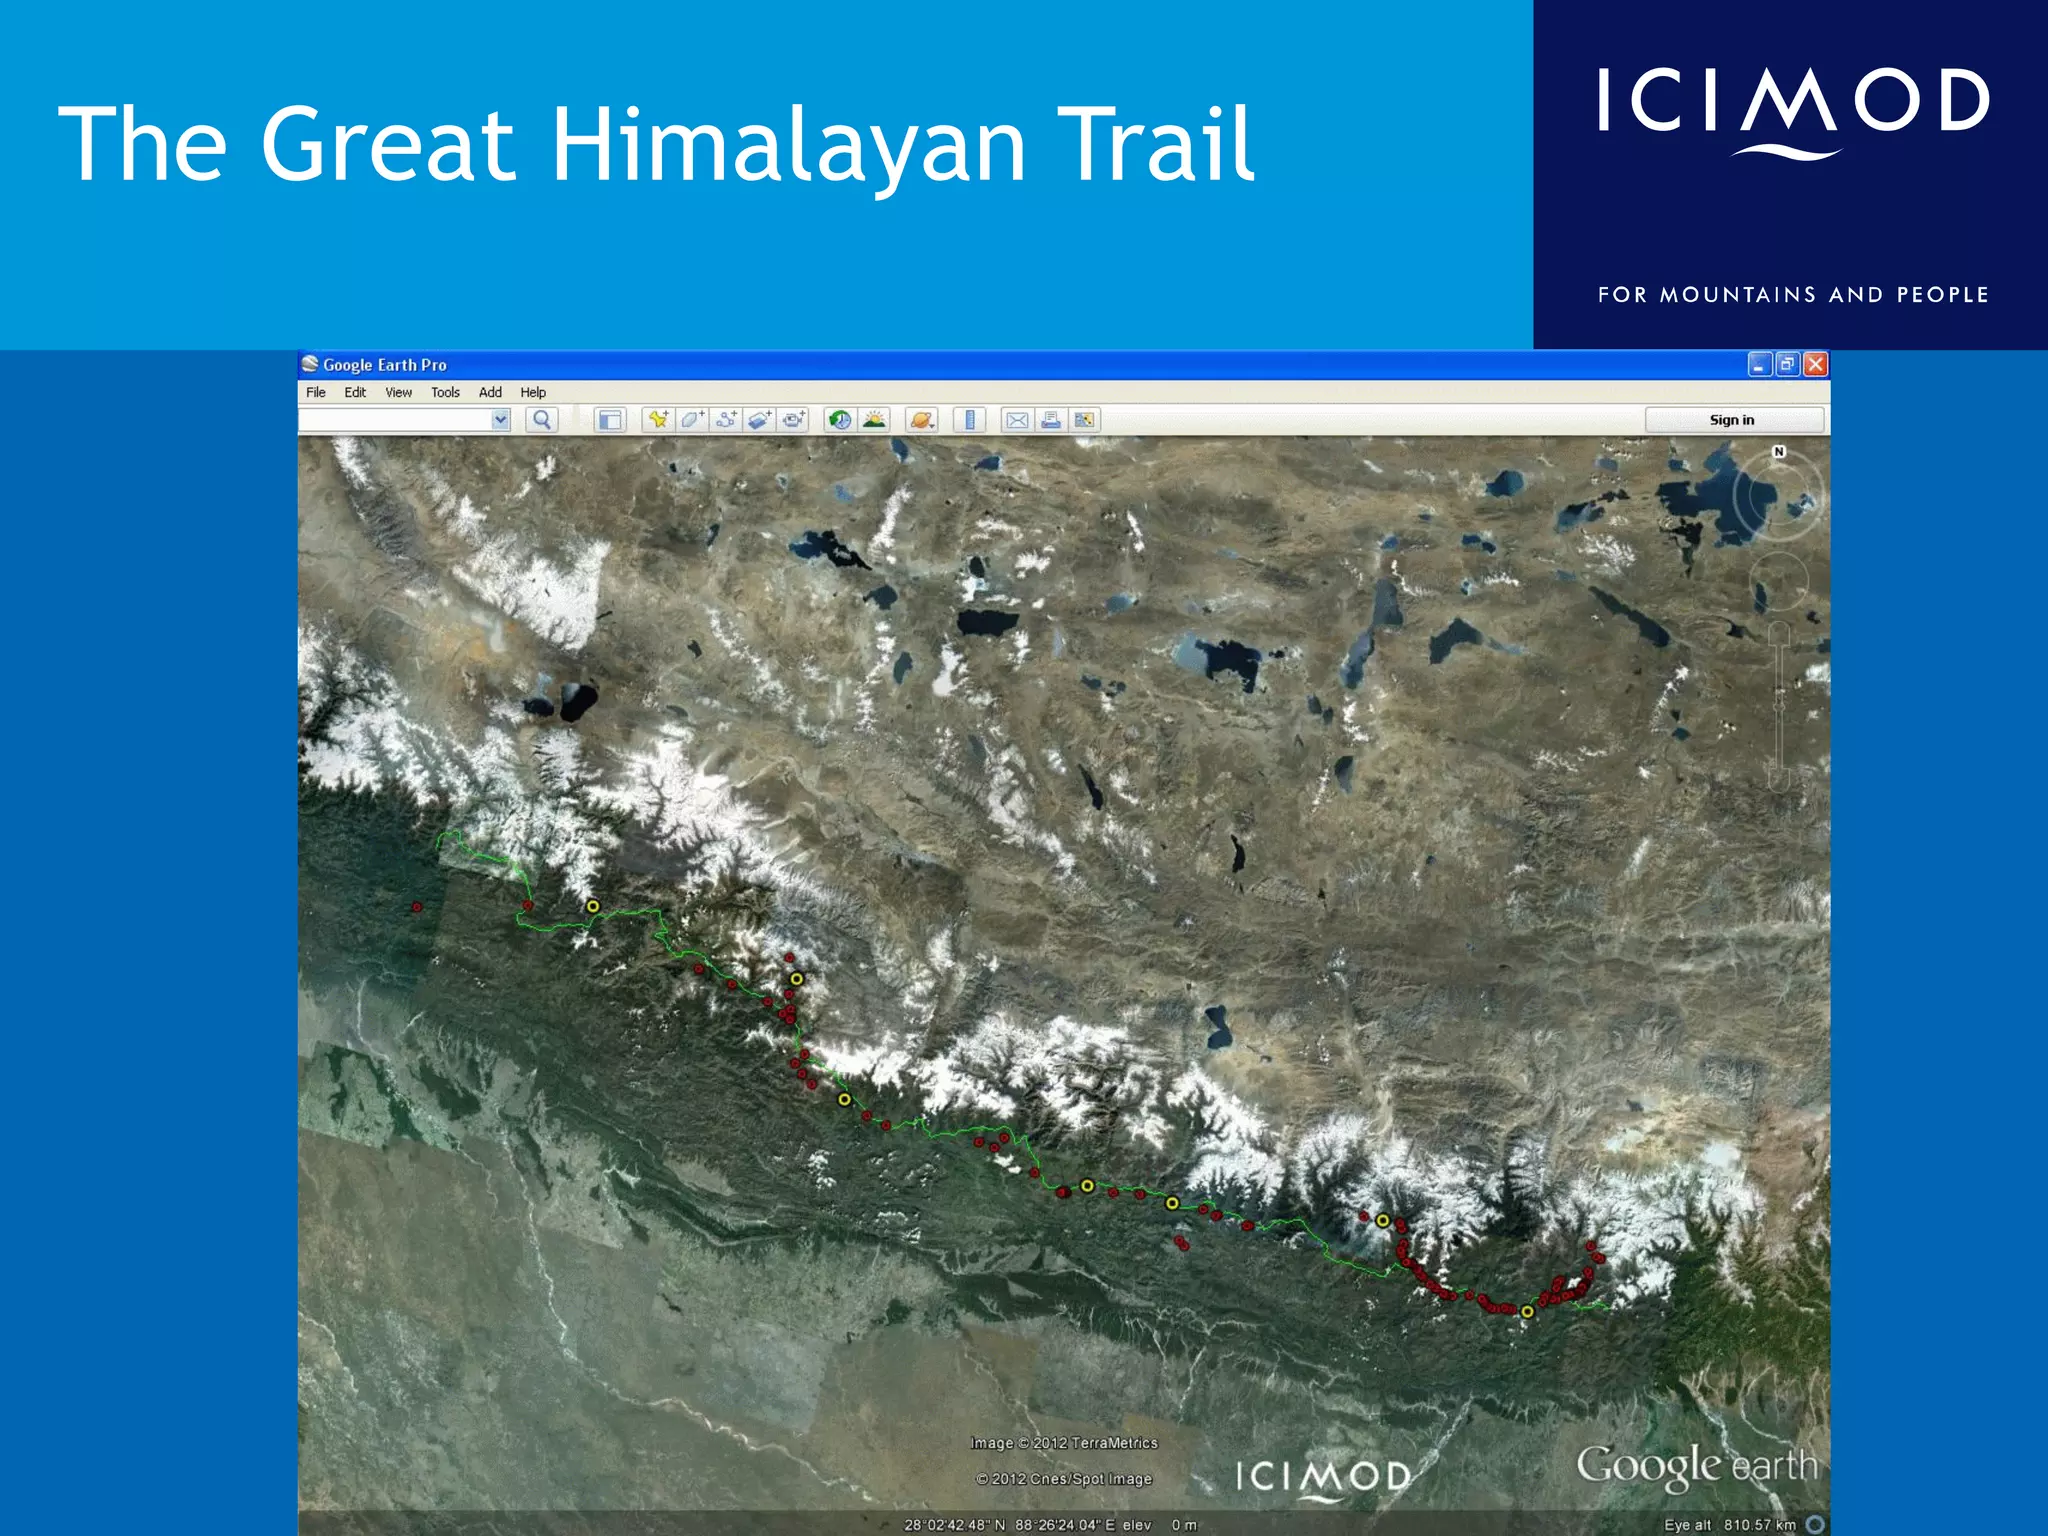

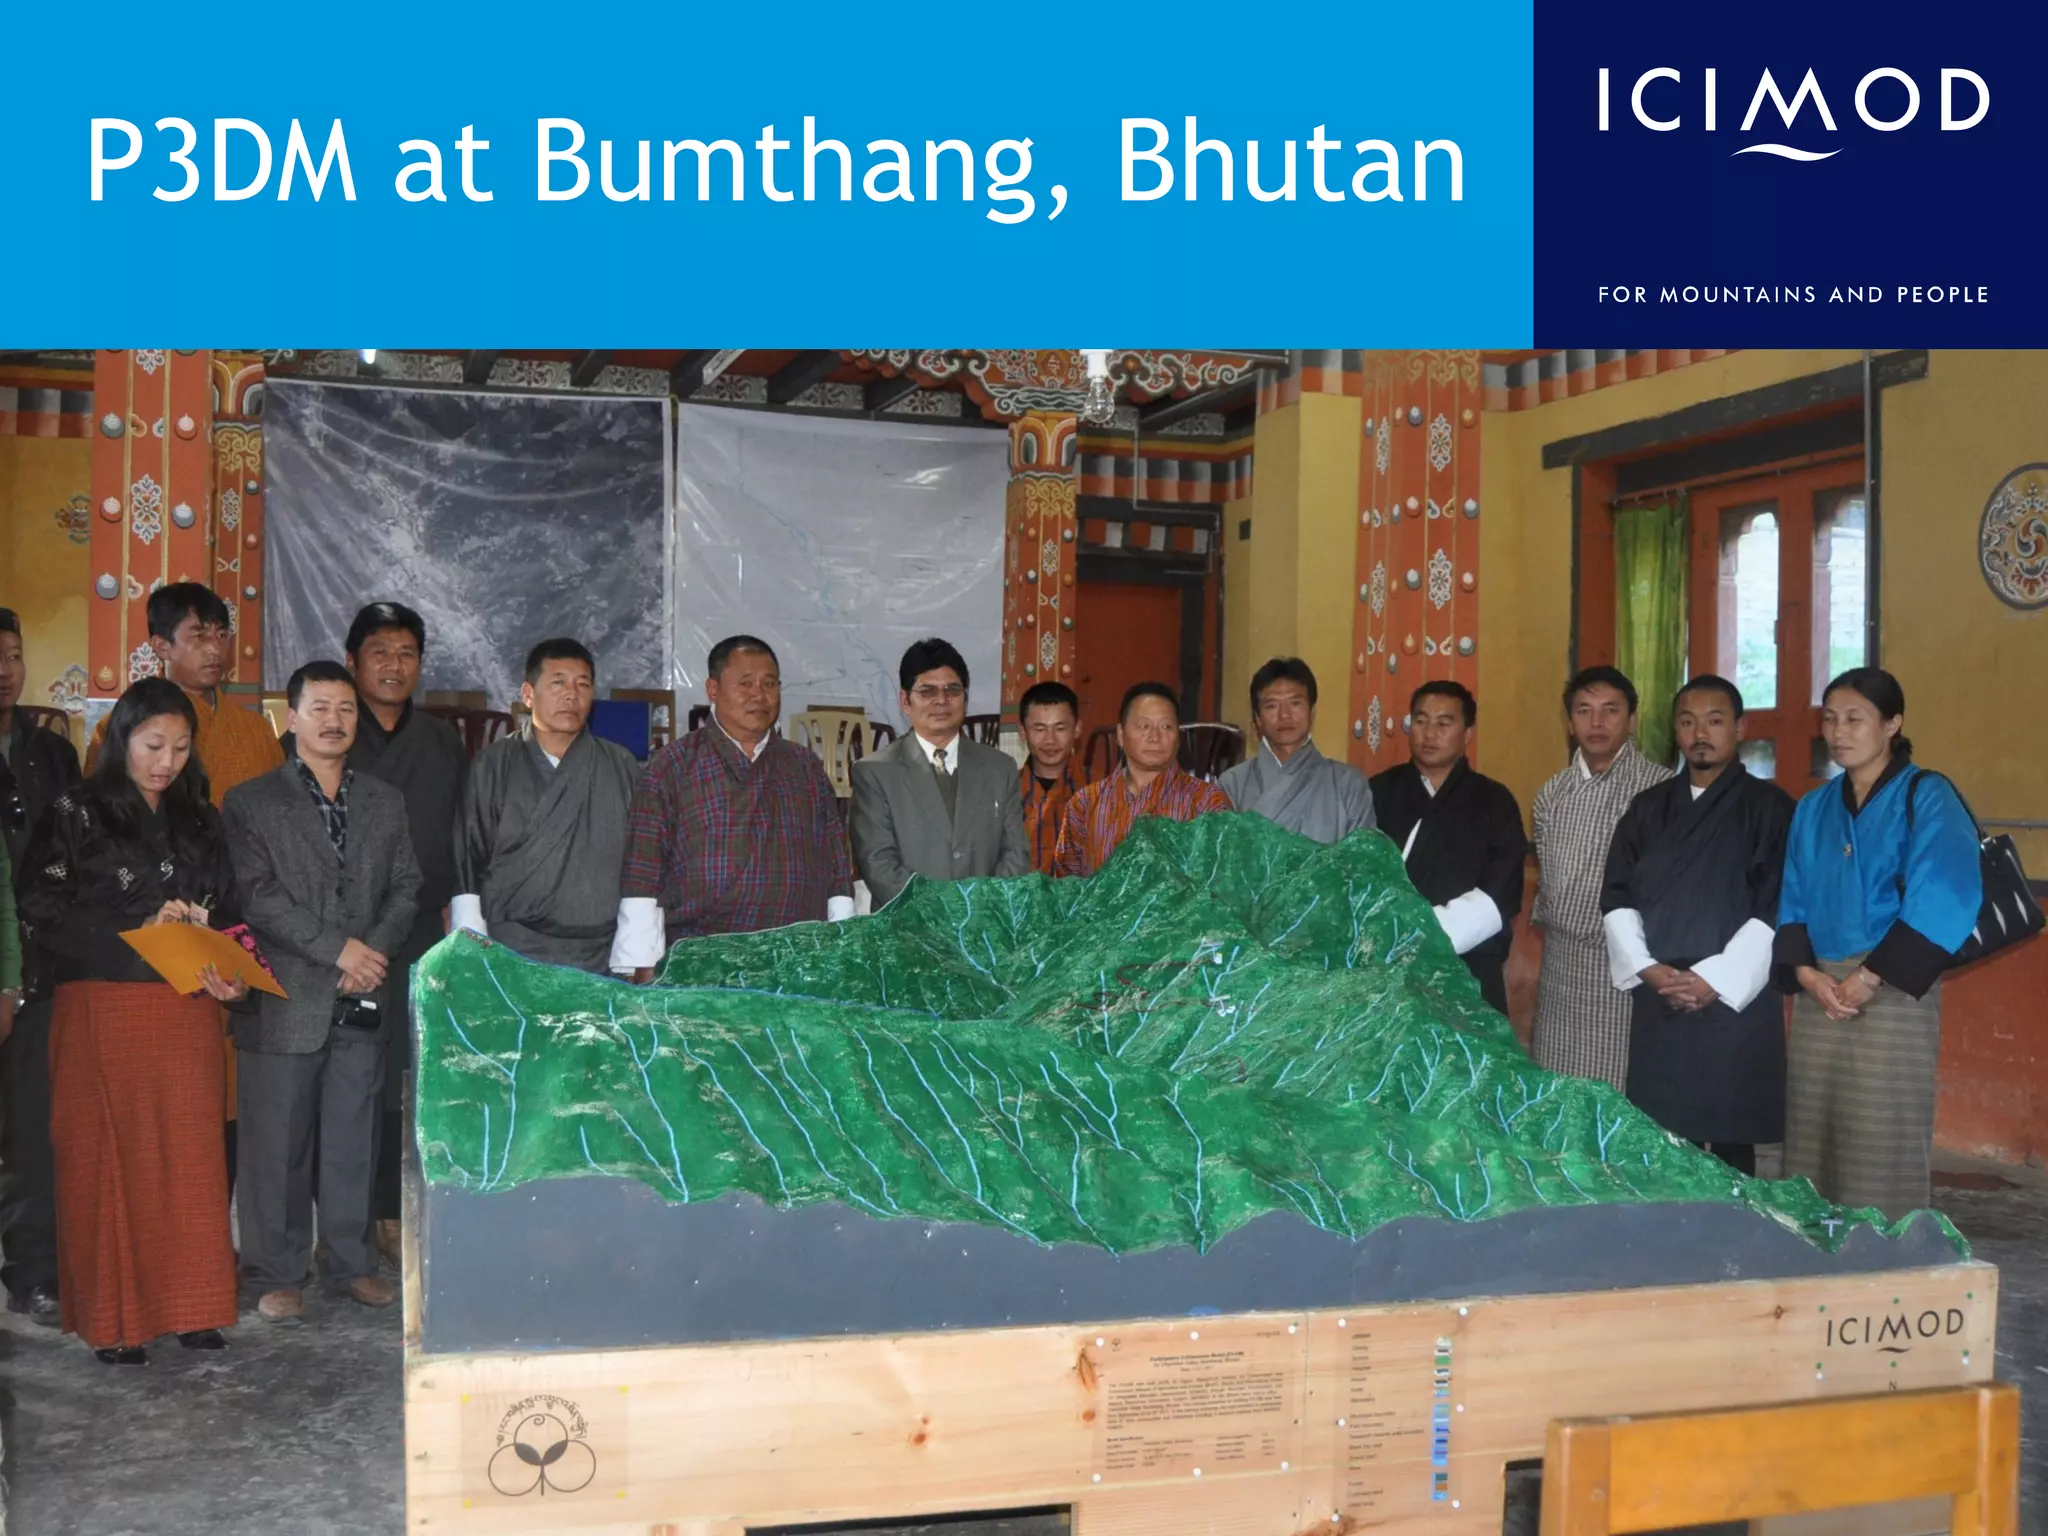
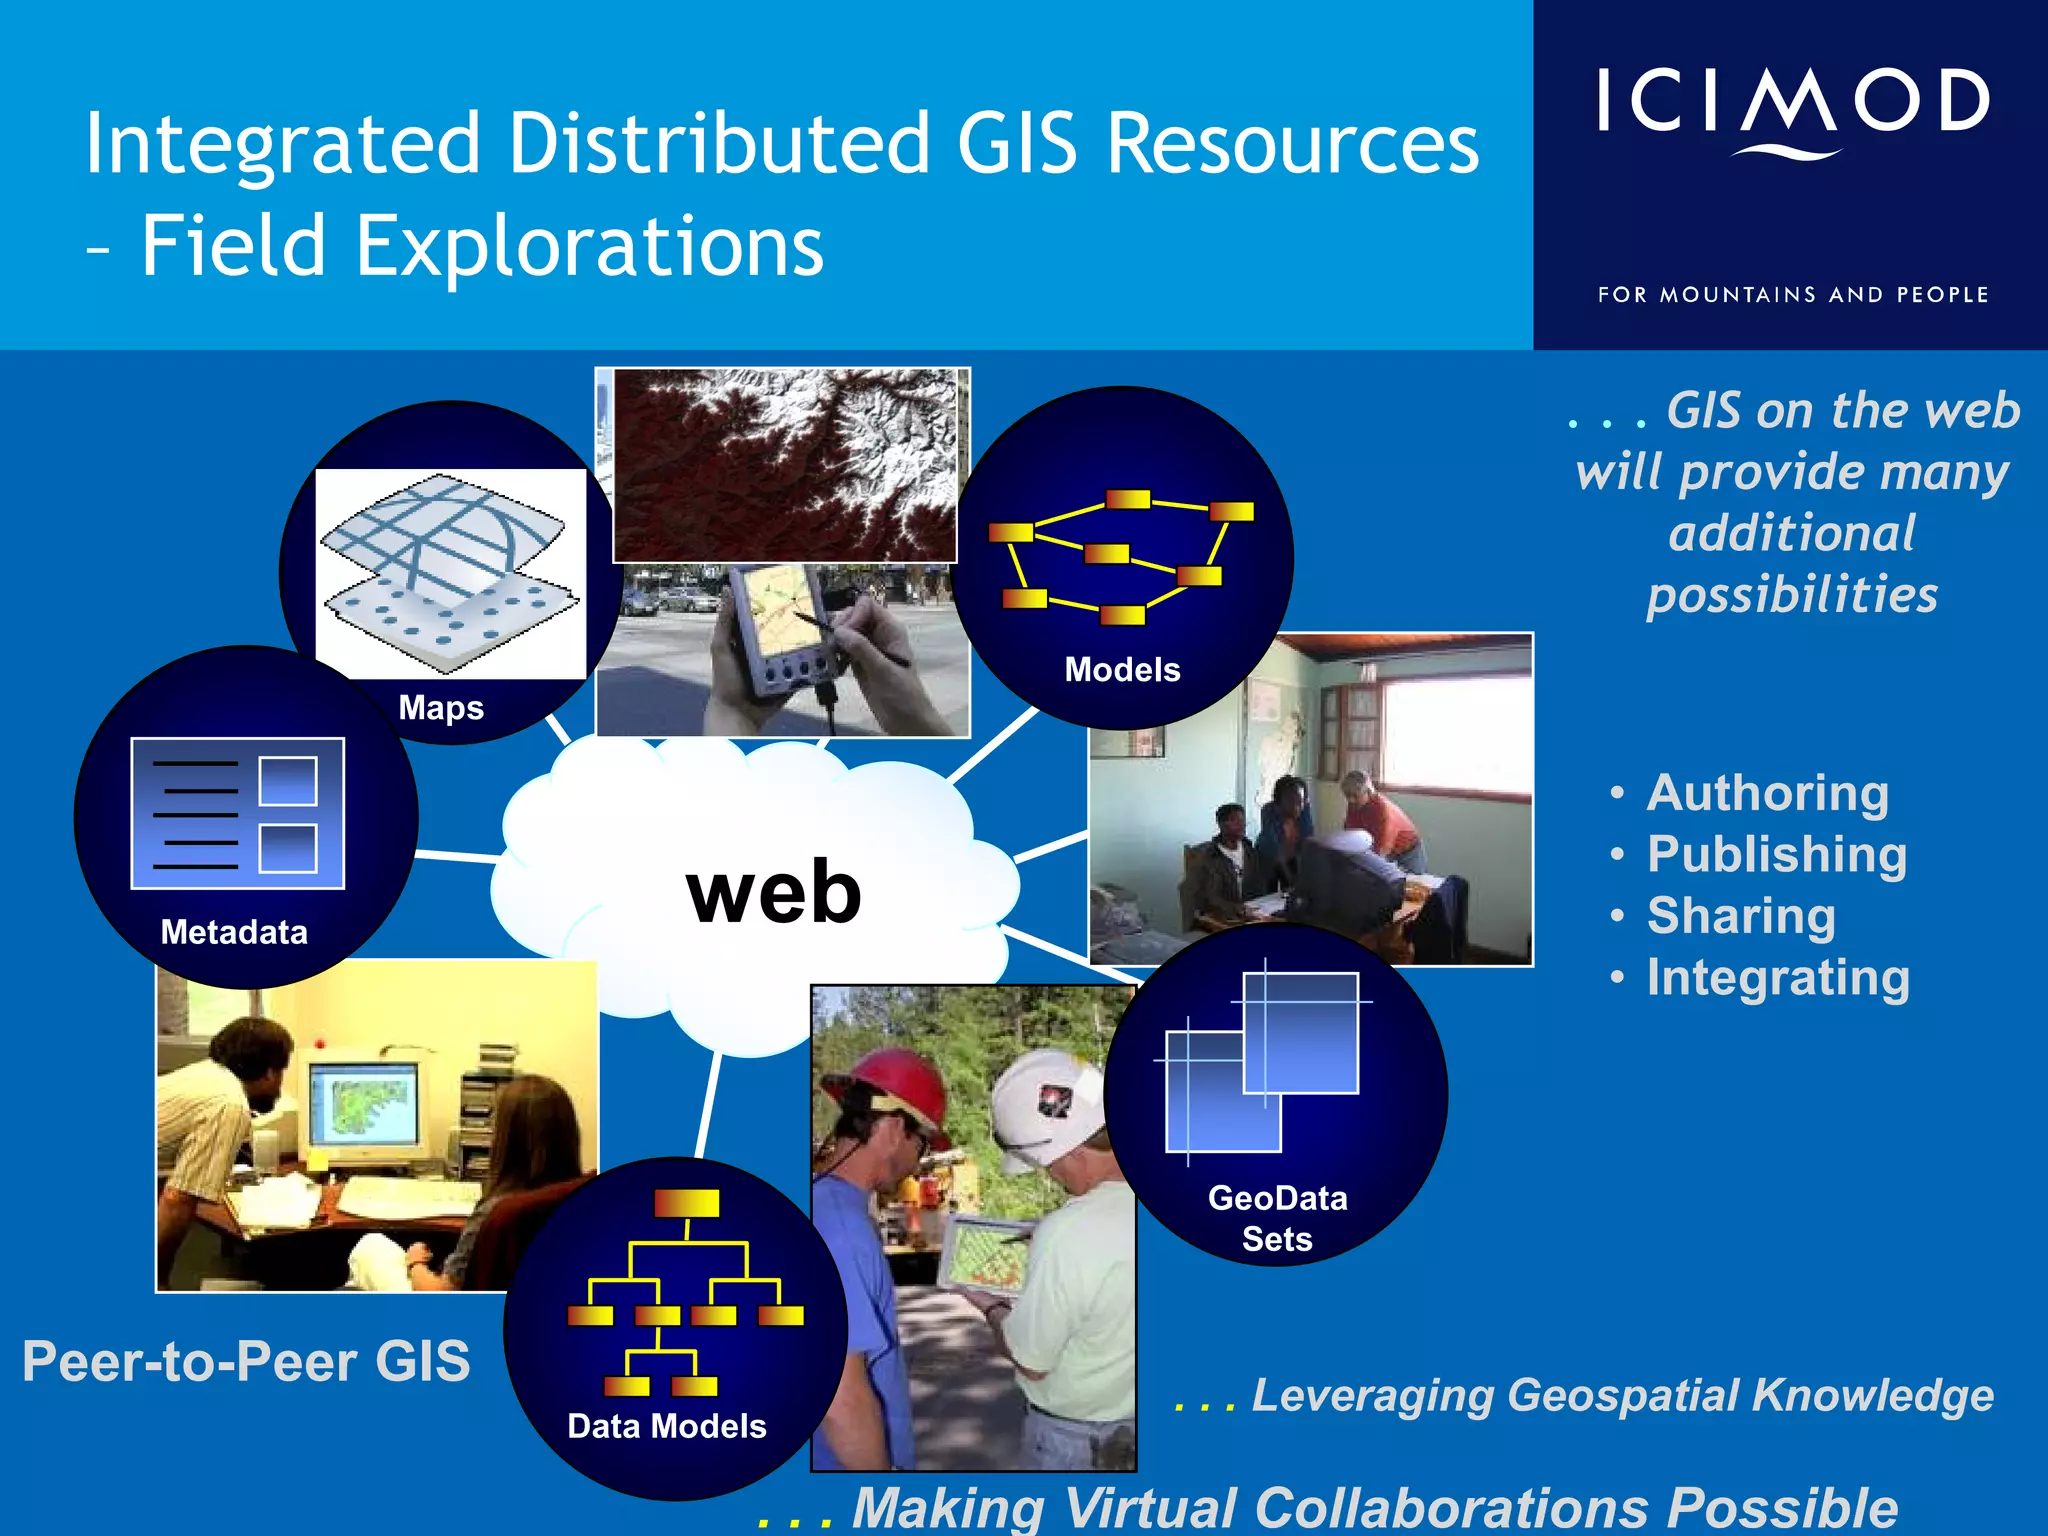
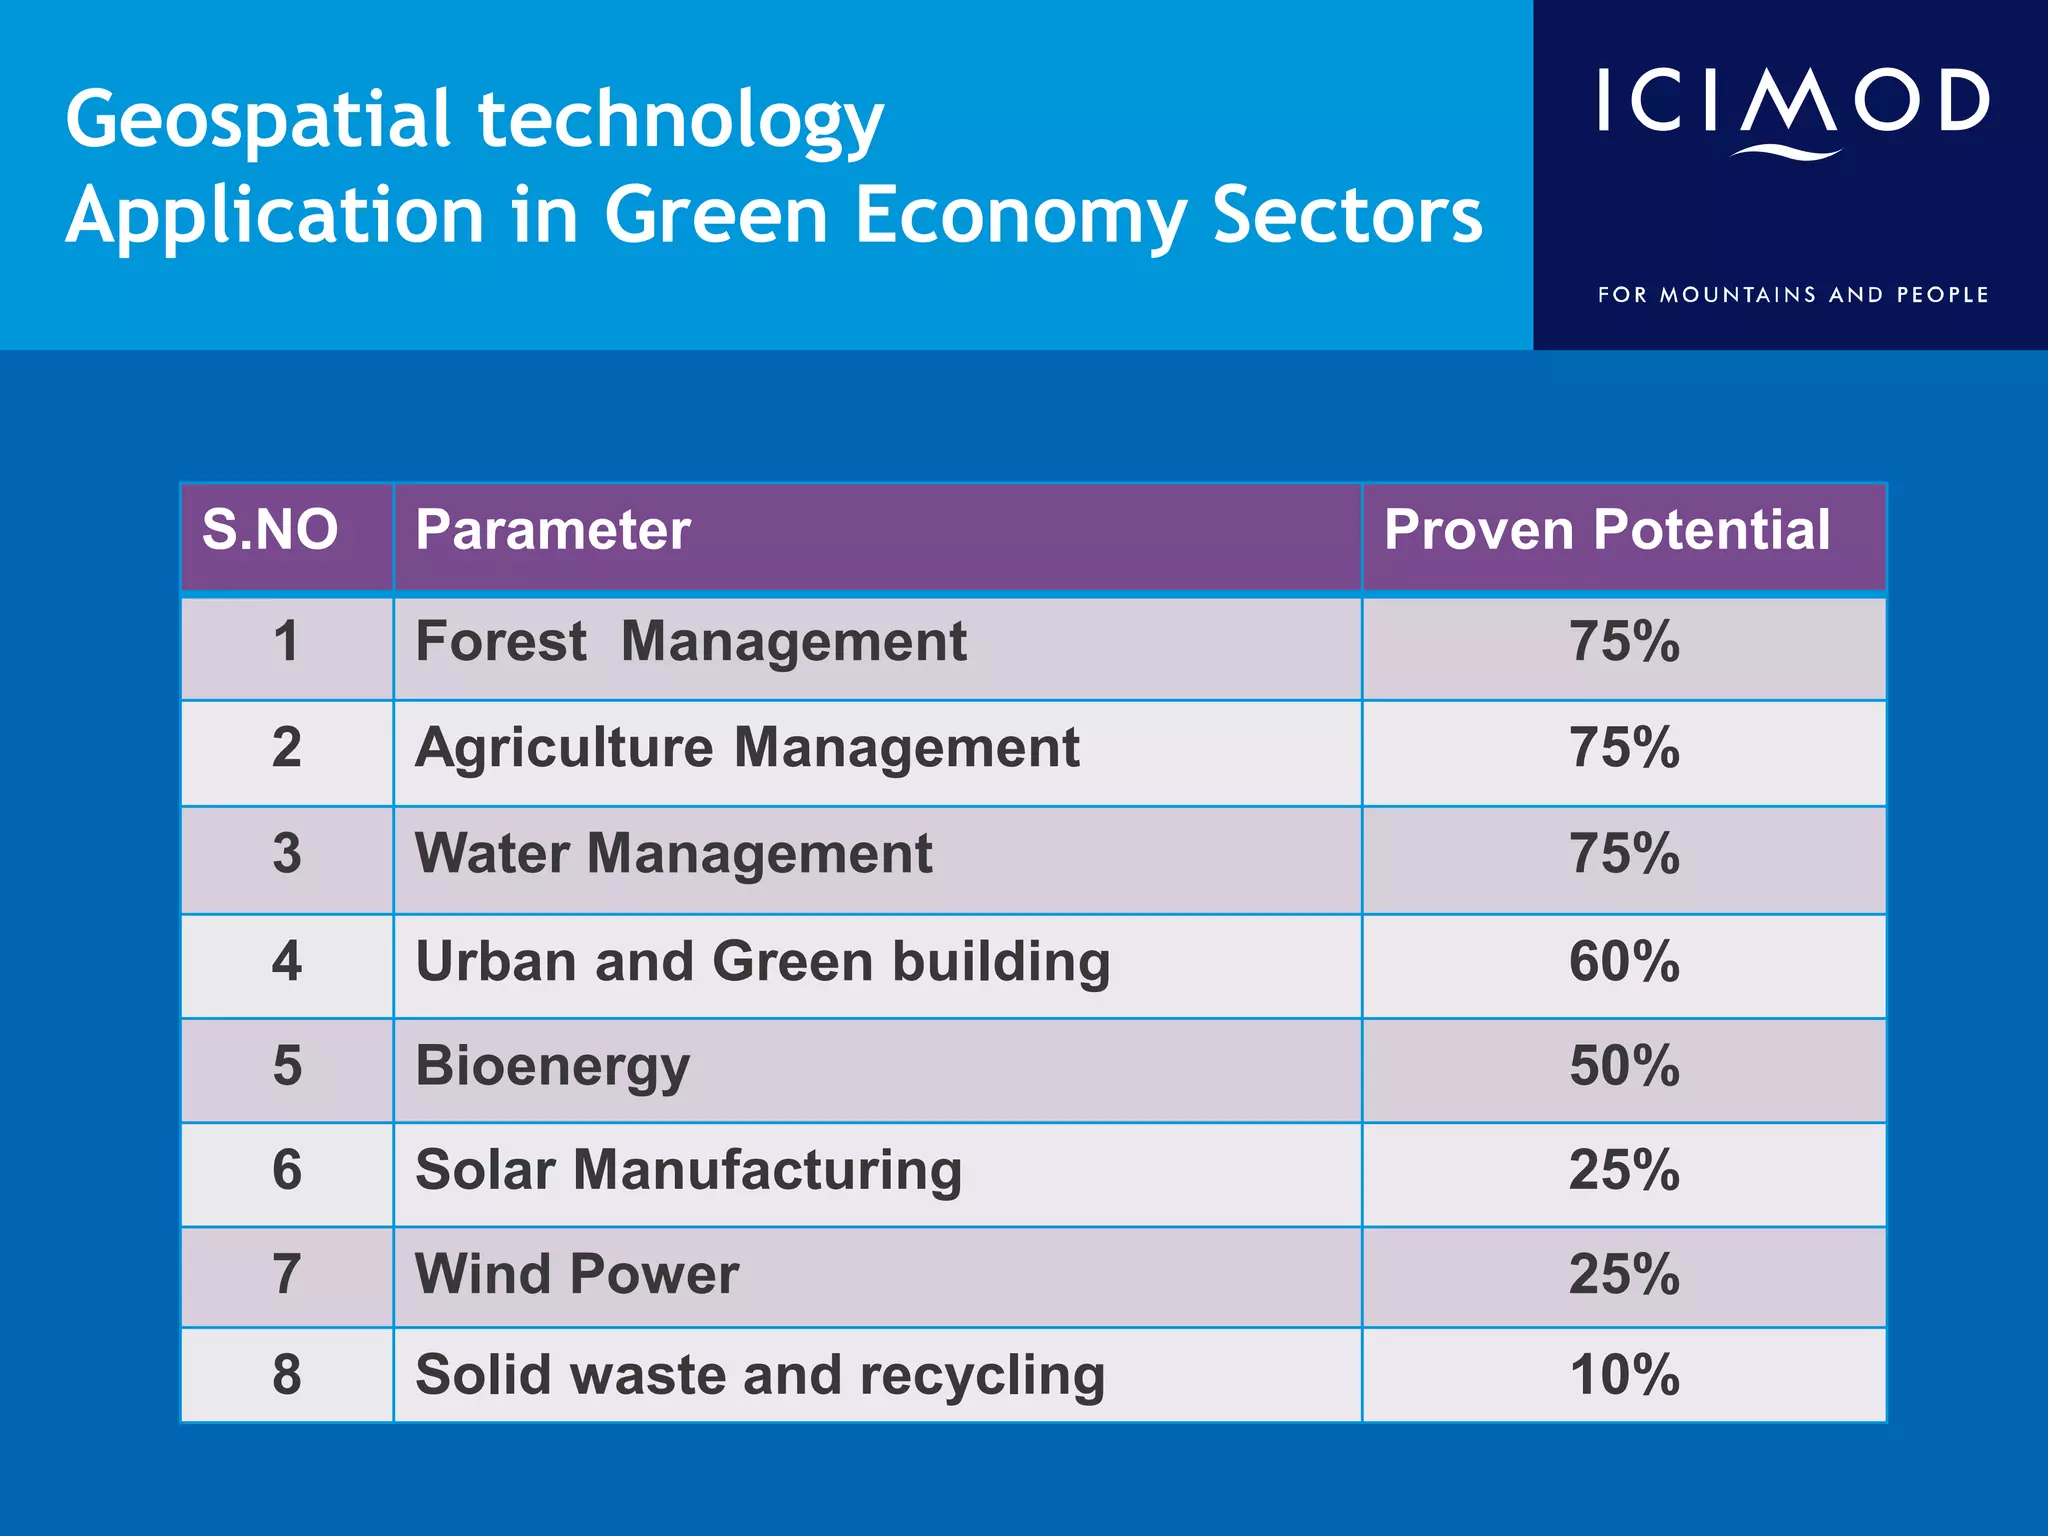

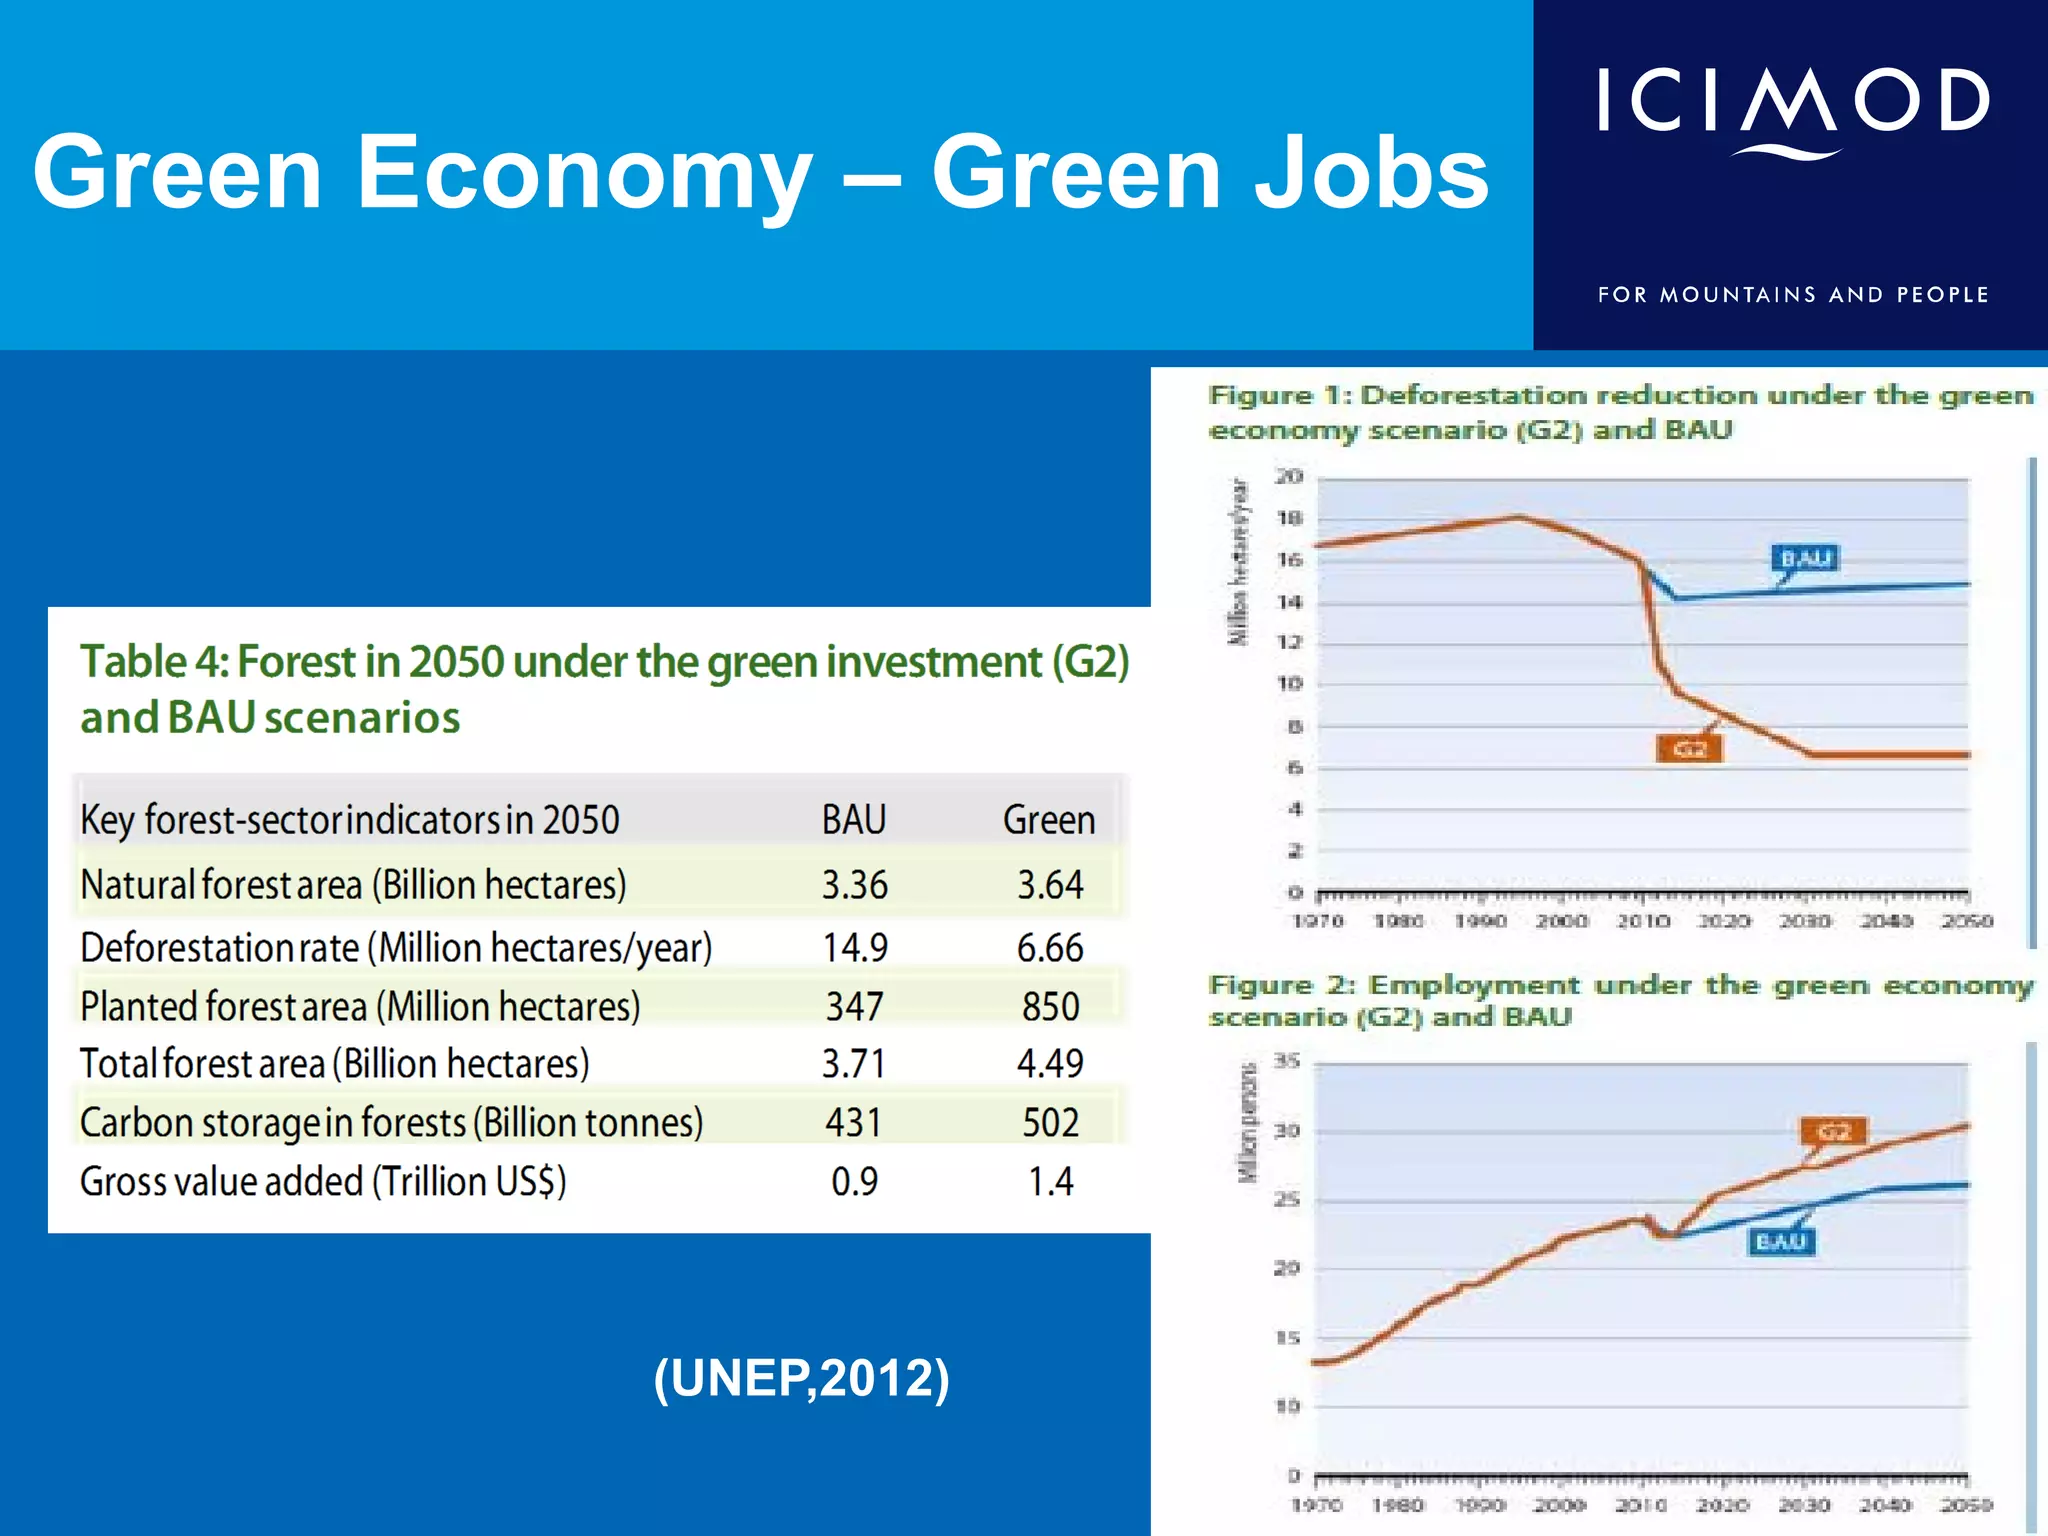


This document discusses the applications of geospatial systems and their importance in supporting green economic development. Geospatial technologies can be used to monitor biodiversity, assess natural resource use, and measure ecological footprints across various spatial and temporal scales. The convergence of remote sensing, GIS, modeling, and other geospatial tools allows issues to be analyzed and addressed in an integrated manner from local to global levels. Geospatial systems can locate resources, identify land use patterns, monitor environmental conditions over time, and assess impacts to support sustainable resource management and linkages between development and conservation.


![Vibe Coding vs. Spec-Driven Development [Free Meetup]](https://cdn.slidesharecdn.com/ss_thumbnails/vibecodingvsspecdrivendevelopment-251209105622-43f455e7-thumbnail.jpg?width=640&height=640&fit=bounds)


