Download to read offline

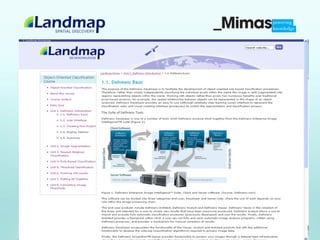


Landmap provides geospatial datasets and resources for education. It aims to increase awareness of geospatial data and provide learning materials structured into courses, units, and topics. The learning zone covers topics from basic to advanced levels and includes software, data, theory, and workflows. It has a technological framework based on Joomla and a pedagogical framework following a six-part educational model. Future plans include making some resources openly available and developing new content areas and engagement with researchers.