Downloaded 592 times


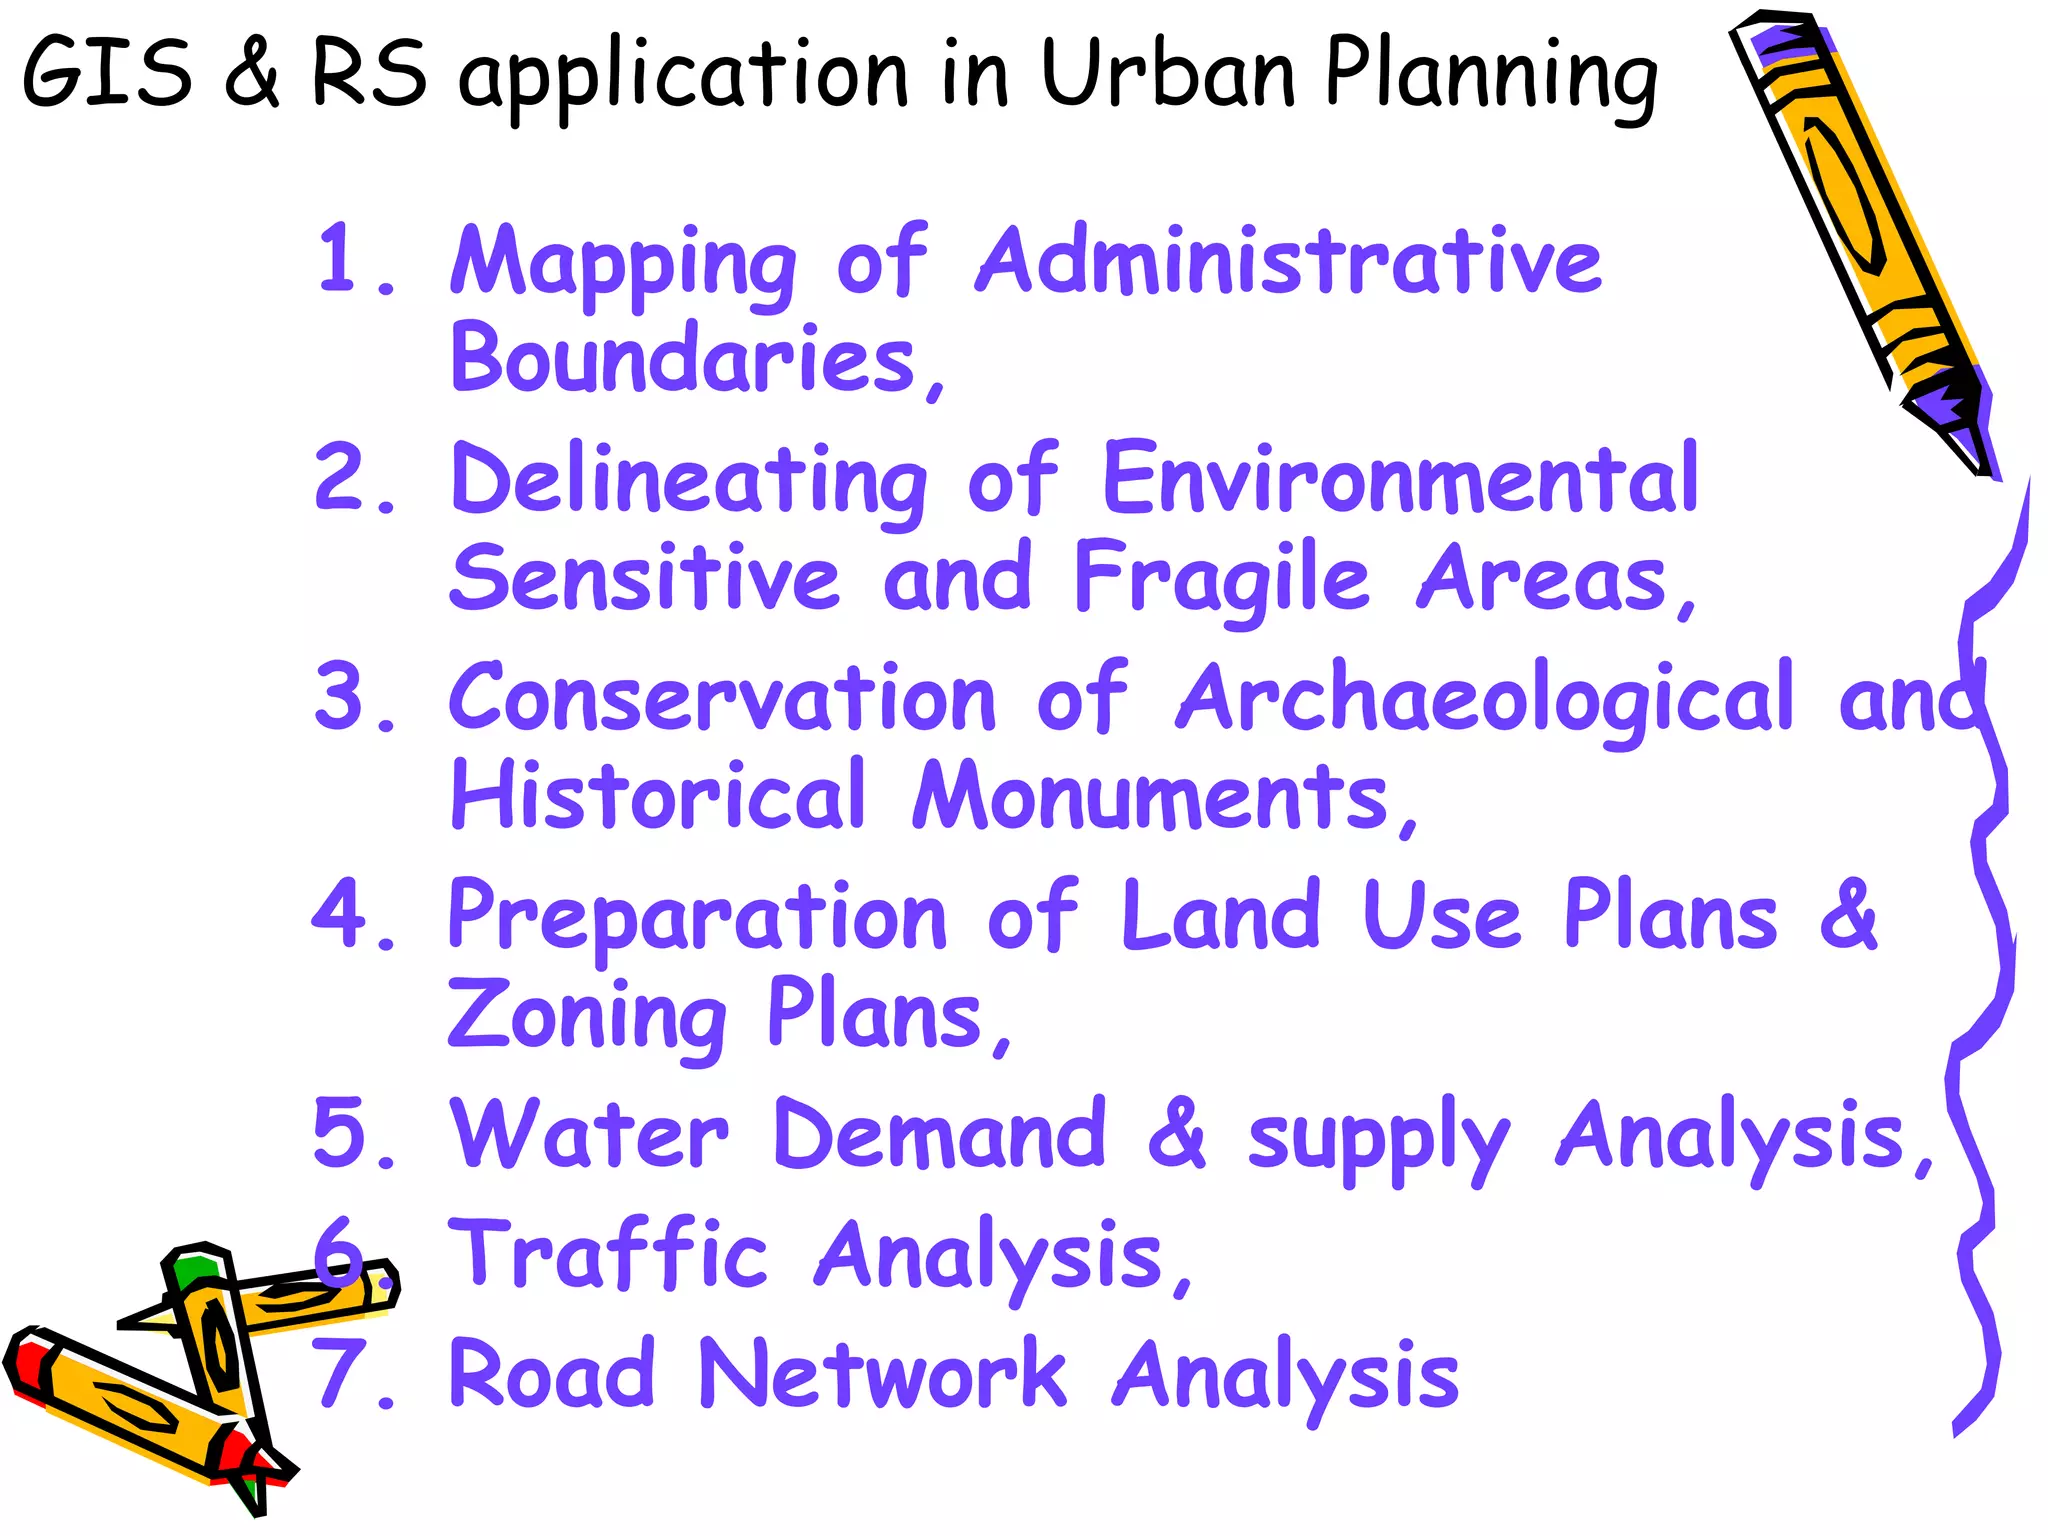


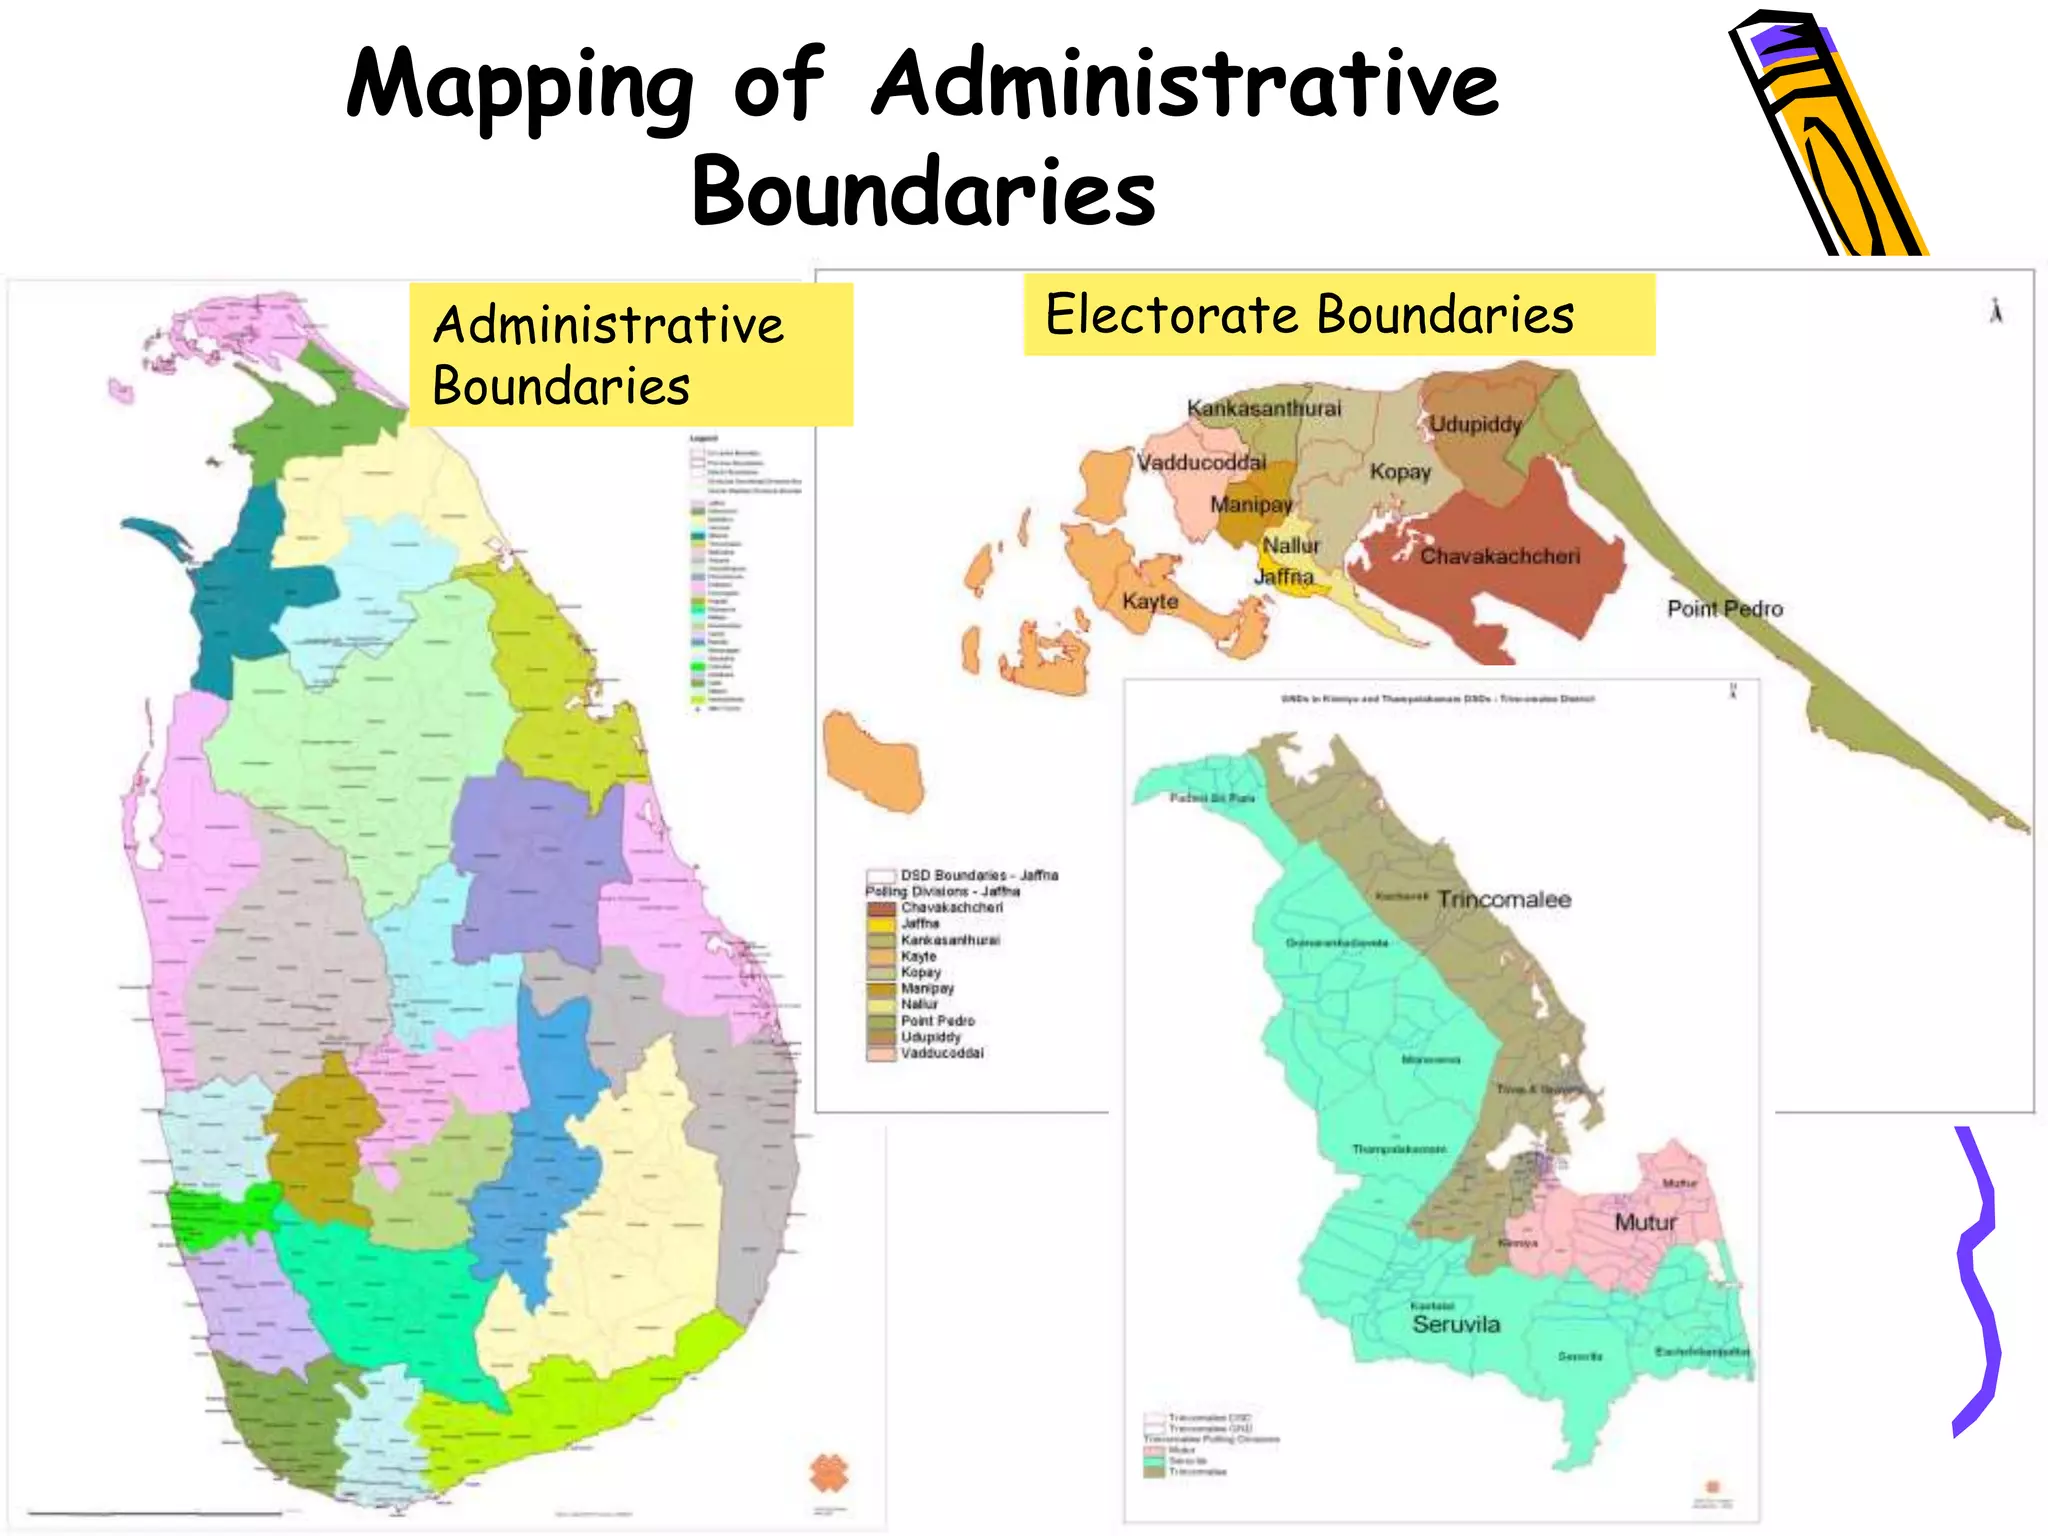


GIS can help improve the urban planning process in 3 key ways: 1) GIS creates a centralized database to store and organize all spatial and attribute data for a city, making it easier to access, analyze, and use for decision making. 2) Satellite images and GIS tools allow planners to rapidly map land use changes, identify areas for future development, and update infrastructure like roads over time. 3) GIS provides analysis capabilities like overlaying maps and proximity analysis that help planners experiment with development alternatives and make more rational, data-driven decisions.