Download to read offline
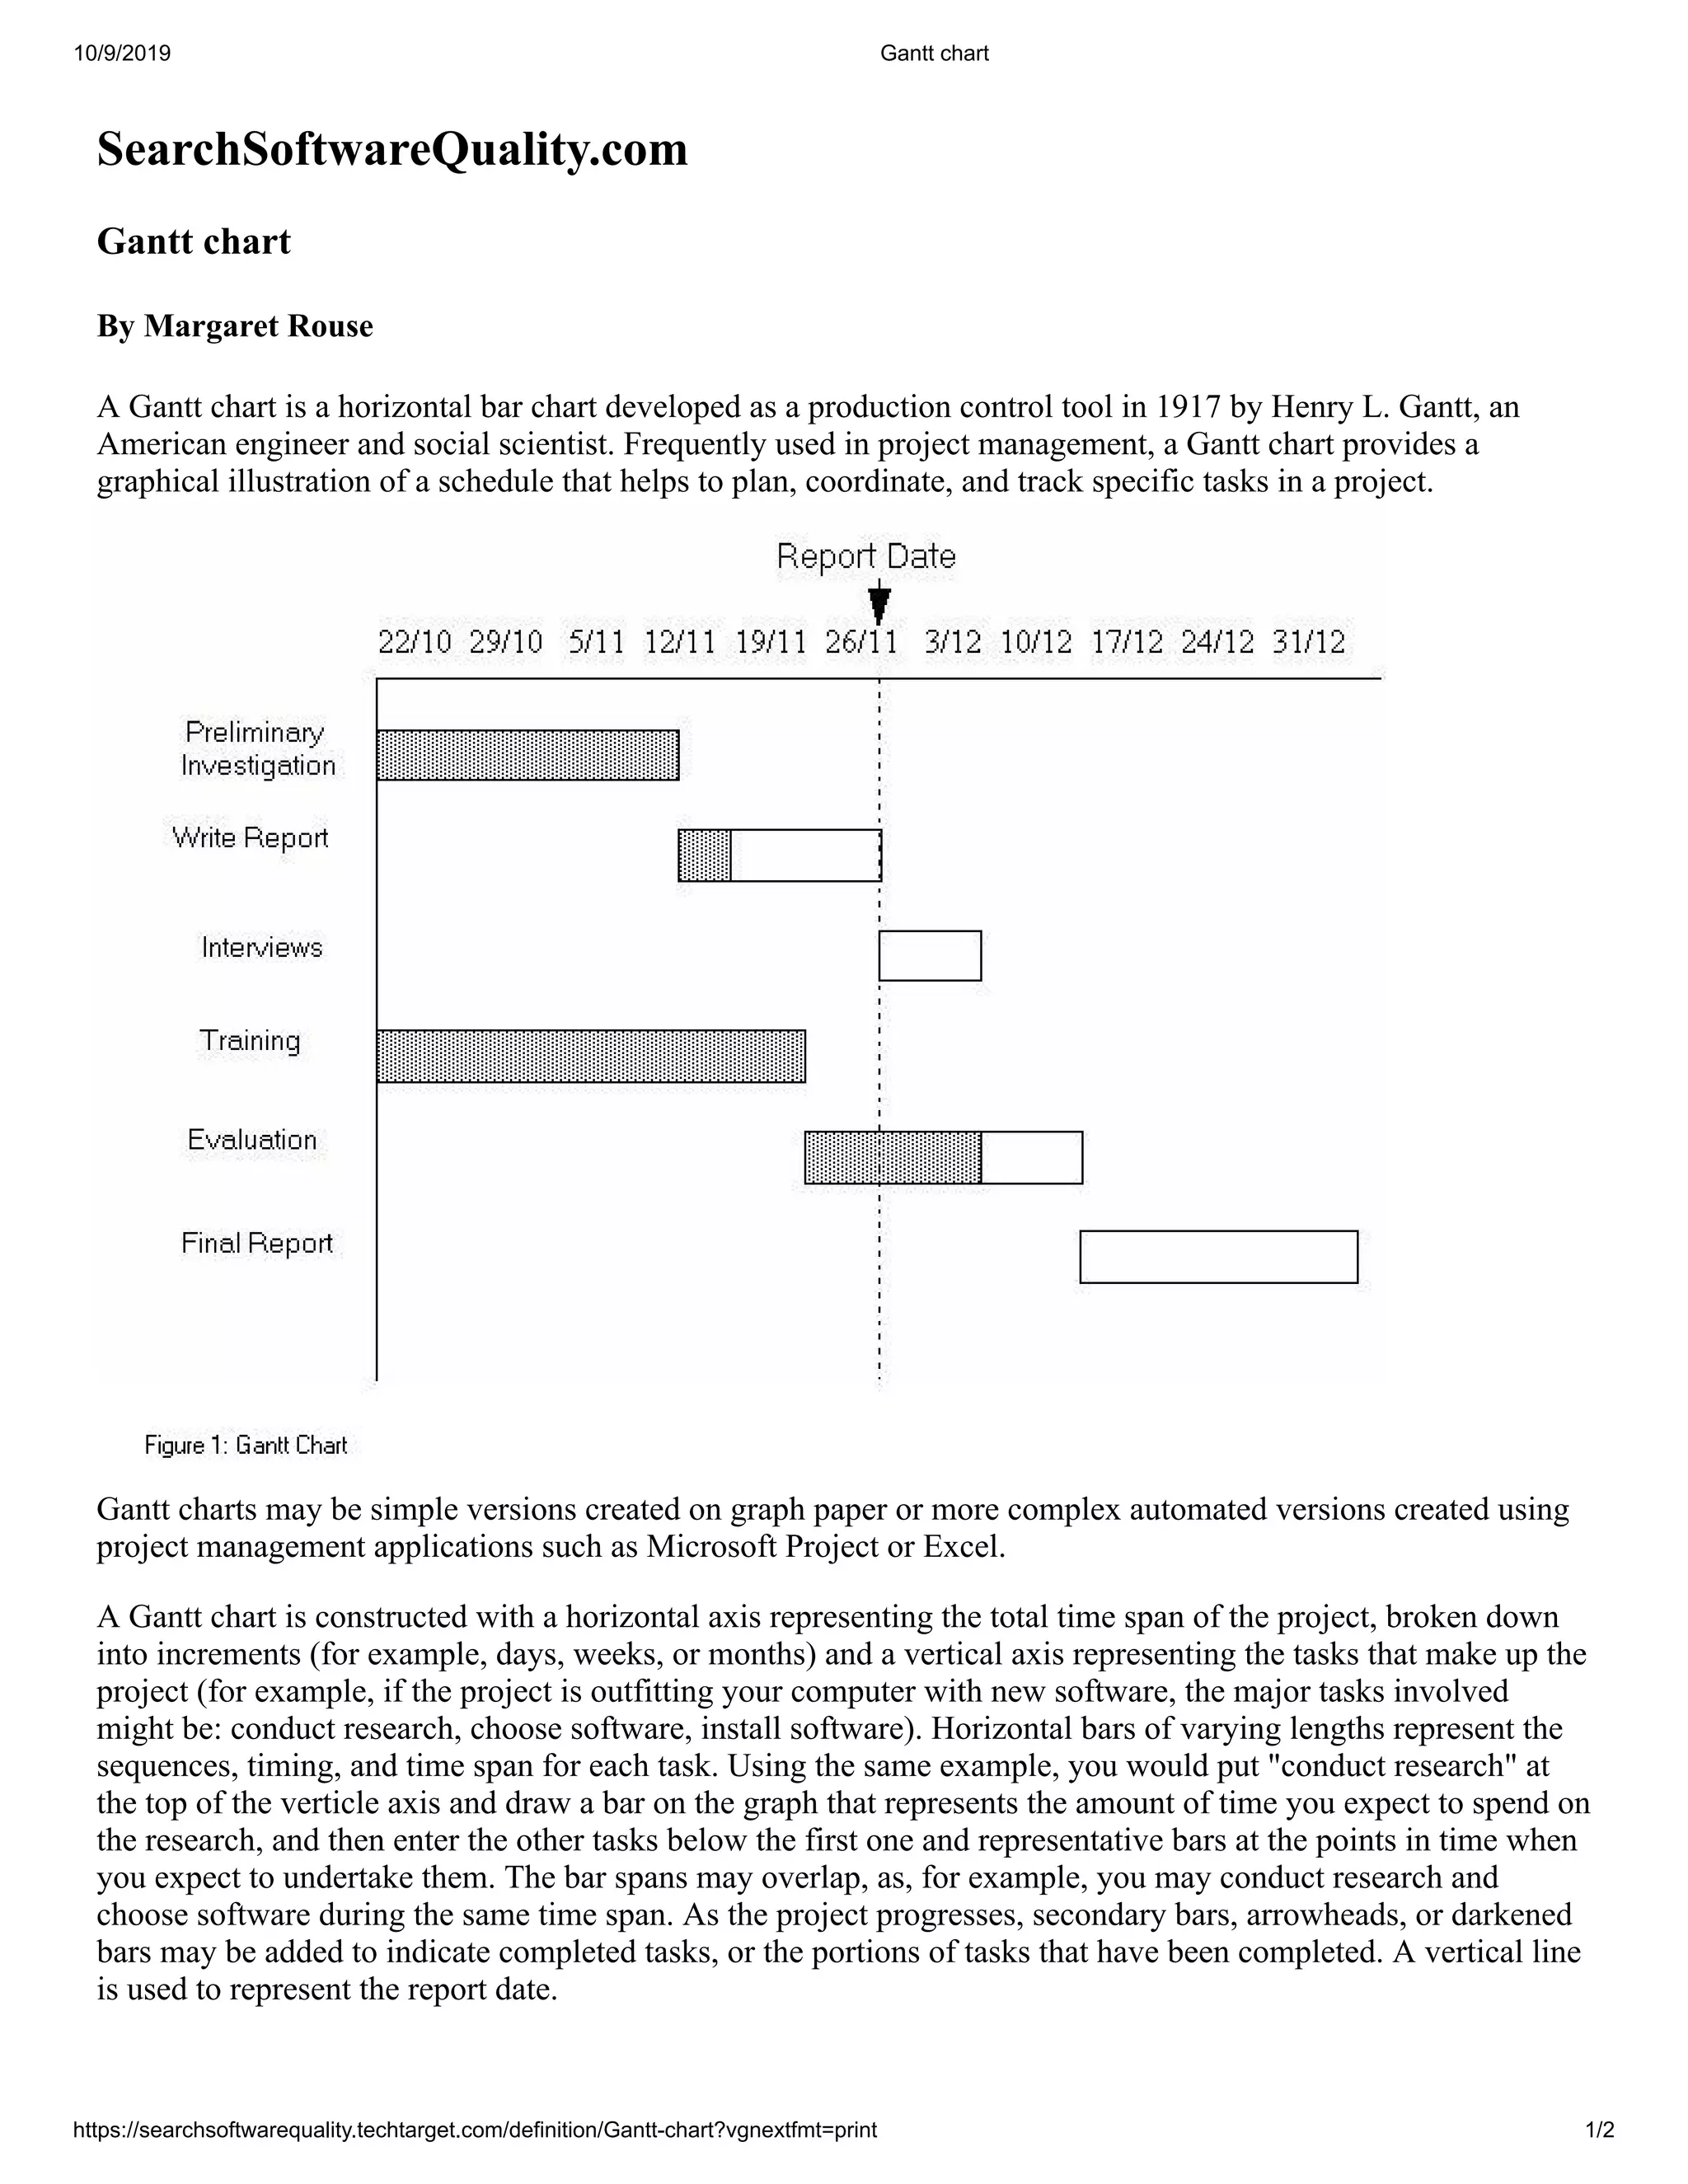


A Gantt chart is a horizontal bar chart developed in 1917 by Henry Gantt to help plan, coordinate, and track tasks in a project. It uses a horizontal axis for the timeline and a vertical axis for tasks. Bars of varying lengths represent the timing and duration of each task. Gantt charts provide a graphical illustration of a project schedule but do not show task dependencies. More complex automated versions created in software can store additional task details and notes to offer more flexibility in tracking project status over time.