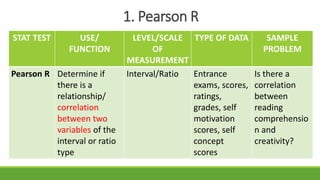
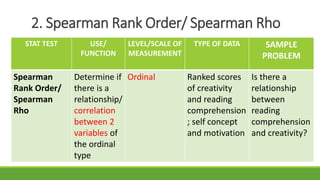
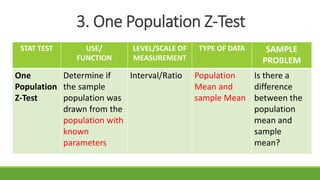
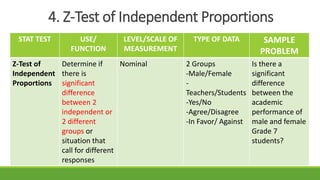
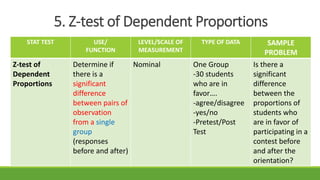
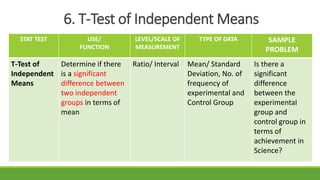
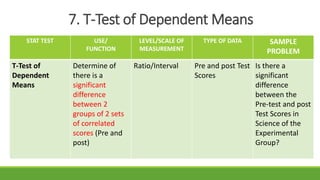
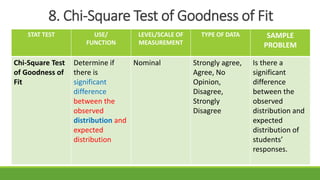
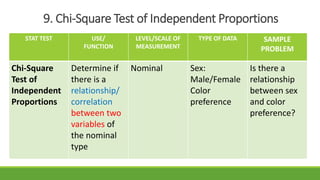
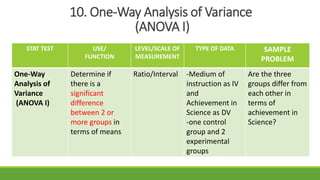
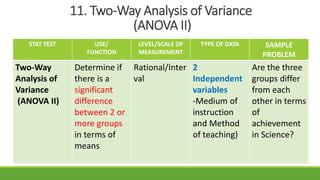
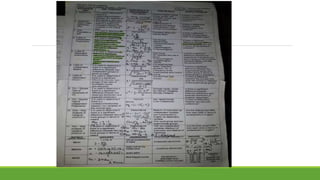
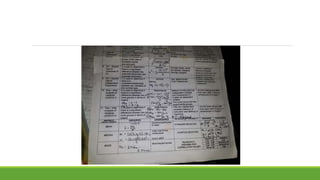
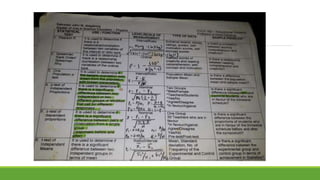
Statistical Test
USE/FUNCTION; LEVEL OF
MEASUREMENT; TYPE OF DATA;
SAMPLE PROBLEM
1. Pearson R
STAT TEST USE/
FUNCTION
LEVEL/SCALE
OF
MEASUREMENT
TYPE OF DATA SAMPLE
PROBLEM
Pearson R Determine if
there is a
relationship/
correlation
between two
variables of the
interval or ratio
type
Interval/Ratio Entrance
exams, scores,
ratings,
grades, self
motivation
scores, self
concept
scores
Is there a
correlation
between
reading
comprehensio
n and
creativity?
2. Spearman Rank Order/ Spearman Rho
STAT TEST USE/
FUNCTION
LEVEL/SCALE OF
MEASUREMENT
TYPE OF DATA SAMPLE
PROBLEM
Spearman
Rank Order/
Spearman
Rho
Determine if
there is a
relationship/
correlation
between 2
variables of
the ordinal
type
Ordinal Ranked scores
of creativity
and reading
comprehension
; self concept
and motivation
Is there a
relationship
between
reading
comprehension
and creativity?
3. One Population Z-Test
STAT TEST USE/
FUNCTION
LEVEL/SCALE OF
MEASUREMENT
TYPE OF DATA SAMPLE
PROBLEM
One
Population
Z-Test
Determine if
the sample
population was
drawn from the
population with
known
parameters
Interval/Ratio Population
Mean and
sample Mean
Is there a
difference
between the
population
mean and
sample
mean?
4. Z-Test of Independent Proportions
STAT TEST USE/
FUNCTION
LEVEL/SCALE OF
MEASUREMENT
TYPE OF DATA SAMPLE
PROBLEM
Z-Test of
Independent
Proportions
Determine if
there is
significant
difference
between 2
independent or
2 different
groups or
situation that
call for different
responses
Nominal 2 Groups
-Male/Female
-
Teachers/Students
-Yes/No
-Agree/Disagree
-In Favor/ Against
Is there a
significant
difference
between the
academic
performance of
male and female
Grade 7
students?
5. Z-test of Dependent Proportions
STAT TEST USE/
FUNCTION
LEVEL/SCALE OF
MEASUREMENT
TYPE OF DATA SAMPLE
PROBLEM
Z-test of
Dependent
Proportions
Determine if
there is a
significant
difference
between pairs of
observation
from a single
group
(responses
before and after)
Nominal One Group
-30 students
who are in
favor….
-agree/disagree
-yes/no
-Pretest/Post
Test
Is there a
significant
difference
between the
proportions of
students who
are in favor of
participating in a
contest before
and after the
orientation?
6. T-Test of Independent Means
STAT TEST USE/
FUNCTION
LEVEL/SCALE OF
MEASUREMENT
TYPE OF DATA SAMPLE
PROBLEM
T-Test of
Independent
Means
Determine if there
is a significant
difference between
two independent
groups in terms of
mean
Ratio/ Interval Mean/ Standard
Deviation, No. of
frequency of
experimental and
Control Group
Is there a
significant
difference
between the
experimental
group and
control group in
terms of
achievement in
Science?
7. T-Test of Dependent Means
STAT TEST USE/
FUNCTION
LEVEL/SCALE OF
MEASUREMENT
TYPE OF DATA SAMPLE
PROBLEM
T-Test of
Dependent
Means
Determine of
there is a
significant
difference
between 2
groups of 2 sets
of correlated
scores (Pre and
post)
Ratio/Interval Pre and post Test
Scores
Is there a
significant
difference
between the
Pre-test and post
Test Scores in
Science of the
Experimental
Group?
8. Chi-Square Test of Goodness of Fit
STAT TEST USE/
FUNCTION
LEVEL/SCALE OF
MEASUREMENT
TYPE OF DATA SAMPLE
PROBLEM
Chi-Square Test
of Goodness of
Fit
Determine if
there is
significant
difference
between the
observed
distribution and
expected
distribution
Nominal Strongly agree,
Agree, No
Opinion,
Disagree,
Strongly
Disagree
Is there a
significant
difference
between the
observed
distribution and
expected
distribution of
students’
responses.
9. Chi-Square Test of Independent Proportions
STAT TEST USE/
FUNCTION
LEVEL/SCALE OF
MEASUREMENT
TYPE OF DATA SAMPLE
PROBLEM
Chi-Square
Test of
Independent
Proportions
Determine if
there is a
relationship/
correlation
between two
variables of
the nominal
type
Nominal Sex:
Male/Female
Color
preference
Is there a
relationship
between sex
and color
preference?
10. One-Way Analysis of Variance
(ANOVA I)
STAT TEST USE/
FUNCTION
LEVEL/SCALE OF
MEASUREMENT
TYPE OF DATA SAMPLE
PROBLEM
One-Way
Analysis of
Variance
(ANOVA I)
Determine if
there is a
significant
difference
between 2 or
more groups in
terms of means
Ratio/Interval -Medium of
instruction as IV
and
Achievement in
Science as DV
-one control
group and 2
experimental
groups
Are the three
groups differ from
each other in
terms of
achievement in
Science?
11. Two-Way Analysis of Variance
(ANOVA II)
STAT TEST USE/
FUNCTION
LEVEL/SCALE OF
MEASUREMENT
TYPE OF DATA SAMPLE
PROBLEM
Two-Way
Analysis of
Variance
(ANOVA II)
Determine if
there is a
significant
difference
between 2 or
more groups
in terms of
means
Rational/Inter
val
2
Independent
variables
-Medium of
instruction
and Method
of teaching)
Are the three
groups differ
from each
other in terms
of
achievement
in Science?
Statistical test discuss 5

Statistical test discuss 5

  • 1.
    Statistical Test USE/FUNCTION; LEVELOF MEASUREMENT; TYPE OF DATA; SAMPLE PROBLEM
  • 2.
    1. Pearson R STATTEST USE/ FUNCTION LEVEL/SCALE OF MEASUREMENT TYPE OF DATA SAMPLE PROBLEM Pearson R Determine if there is a relationship/ correlation between two variables of the interval or ratio type Interval/Ratio Entrance exams, scores, ratings, grades, self motivation scores, self concept scores Is there a correlation between reading comprehensio n and creativity?
  • 3.
    2. Spearman RankOrder/ Spearman Rho STAT TEST USE/ FUNCTION LEVEL/SCALE OF MEASUREMENT TYPE OF DATA SAMPLE PROBLEM Spearman Rank Order/ Spearman Rho Determine if there is a relationship/ correlation between 2 variables of the ordinal type Ordinal Ranked scores of creativity and reading comprehension ; self concept and motivation Is there a relationship between reading comprehension and creativity?
  • 4.
    3. One PopulationZ-Test STAT TEST USE/ FUNCTION LEVEL/SCALE OF MEASUREMENT TYPE OF DATA SAMPLE PROBLEM One Population Z-Test Determine if the sample population was drawn from the population with known parameters Interval/Ratio Population Mean and sample Mean Is there a difference between the population mean and sample mean?
  • 5.
    4. Z-Test ofIndependent Proportions STAT TEST USE/ FUNCTION LEVEL/SCALE OF MEASUREMENT TYPE OF DATA SAMPLE PROBLEM Z-Test of Independent Proportions Determine if there is significant difference between 2 independent or 2 different groups or situation that call for different responses Nominal 2 Groups -Male/Female - Teachers/Students -Yes/No -Agree/Disagree -In Favor/ Against Is there a significant difference between the academic performance of male and female Grade 7 students?
  • 6.
    5. Z-test ofDependent Proportions STAT TEST USE/ FUNCTION LEVEL/SCALE OF MEASUREMENT TYPE OF DATA SAMPLE PROBLEM Z-test of Dependent Proportions Determine if there is a significant difference between pairs of observation from a single group (responses before and after) Nominal One Group -30 students who are in favor…. -agree/disagree -yes/no -Pretest/Post Test Is there a significant difference between the proportions of students who are in favor of participating in a contest before and after the orientation?
  • 7.
    6. T-Test ofIndependent Means STAT TEST USE/ FUNCTION LEVEL/SCALE OF MEASUREMENT TYPE OF DATA SAMPLE PROBLEM T-Test of Independent Means Determine if there is a significant difference between two independent groups in terms of mean Ratio/ Interval Mean/ Standard Deviation, No. of frequency of experimental and Control Group Is there a significant difference between the experimental group and control group in terms of achievement in Science?
  • 8.
    7. T-Test ofDependent Means STAT TEST USE/ FUNCTION LEVEL/SCALE OF MEASUREMENT TYPE OF DATA SAMPLE PROBLEM T-Test of Dependent Means Determine of there is a significant difference between 2 groups of 2 sets of correlated scores (Pre and post) Ratio/Interval Pre and post Test Scores Is there a significant difference between the Pre-test and post Test Scores in Science of the Experimental Group?
  • 9.
    8. Chi-Square Testof Goodness of Fit STAT TEST USE/ FUNCTION LEVEL/SCALE OF MEASUREMENT TYPE OF DATA SAMPLE PROBLEM Chi-Square Test of Goodness of Fit Determine if there is significant difference between the observed distribution and expected distribution Nominal Strongly agree, Agree, No Opinion, Disagree, Strongly Disagree Is there a significant difference between the observed distribution and expected distribution of students’ responses.
  • 10.
    9. Chi-Square Testof Independent Proportions STAT TEST USE/ FUNCTION LEVEL/SCALE OF MEASUREMENT TYPE OF DATA SAMPLE PROBLEM Chi-Square Test of Independent Proportions Determine if there is a relationship/ correlation between two variables of the nominal type Nominal Sex: Male/Female Color preference Is there a relationship between sex and color preference?
  • 11.
    10. One-Way Analysisof Variance (ANOVA I) STAT TEST USE/ FUNCTION LEVEL/SCALE OF MEASUREMENT TYPE OF DATA SAMPLE PROBLEM One-Way Analysis of Variance (ANOVA I) Determine if there is a significant difference between 2 or more groups in terms of means Ratio/Interval -Medium of instruction as IV and Achievement in Science as DV -one control group and 2 experimental groups Are the three groups differ from each other in terms of achievement in Science?
  • 12.
    11. Two-Way Analysisof Variance (ANOVA II) STAT TEST USE/ FUNCTION LEVEL/SCALE OF MEASUREMENT TYPE OF DATA SAMPLE PROBLEM Two-Way Analysis of Variance (ANOVA II) Determine if there is a significant difference between 2 or more groups in terms of means Rational/Inter val 2 Independent variables -Medium of instruction and Method of teaching) Are the three groups differ from each other in terms of achievement in Science?