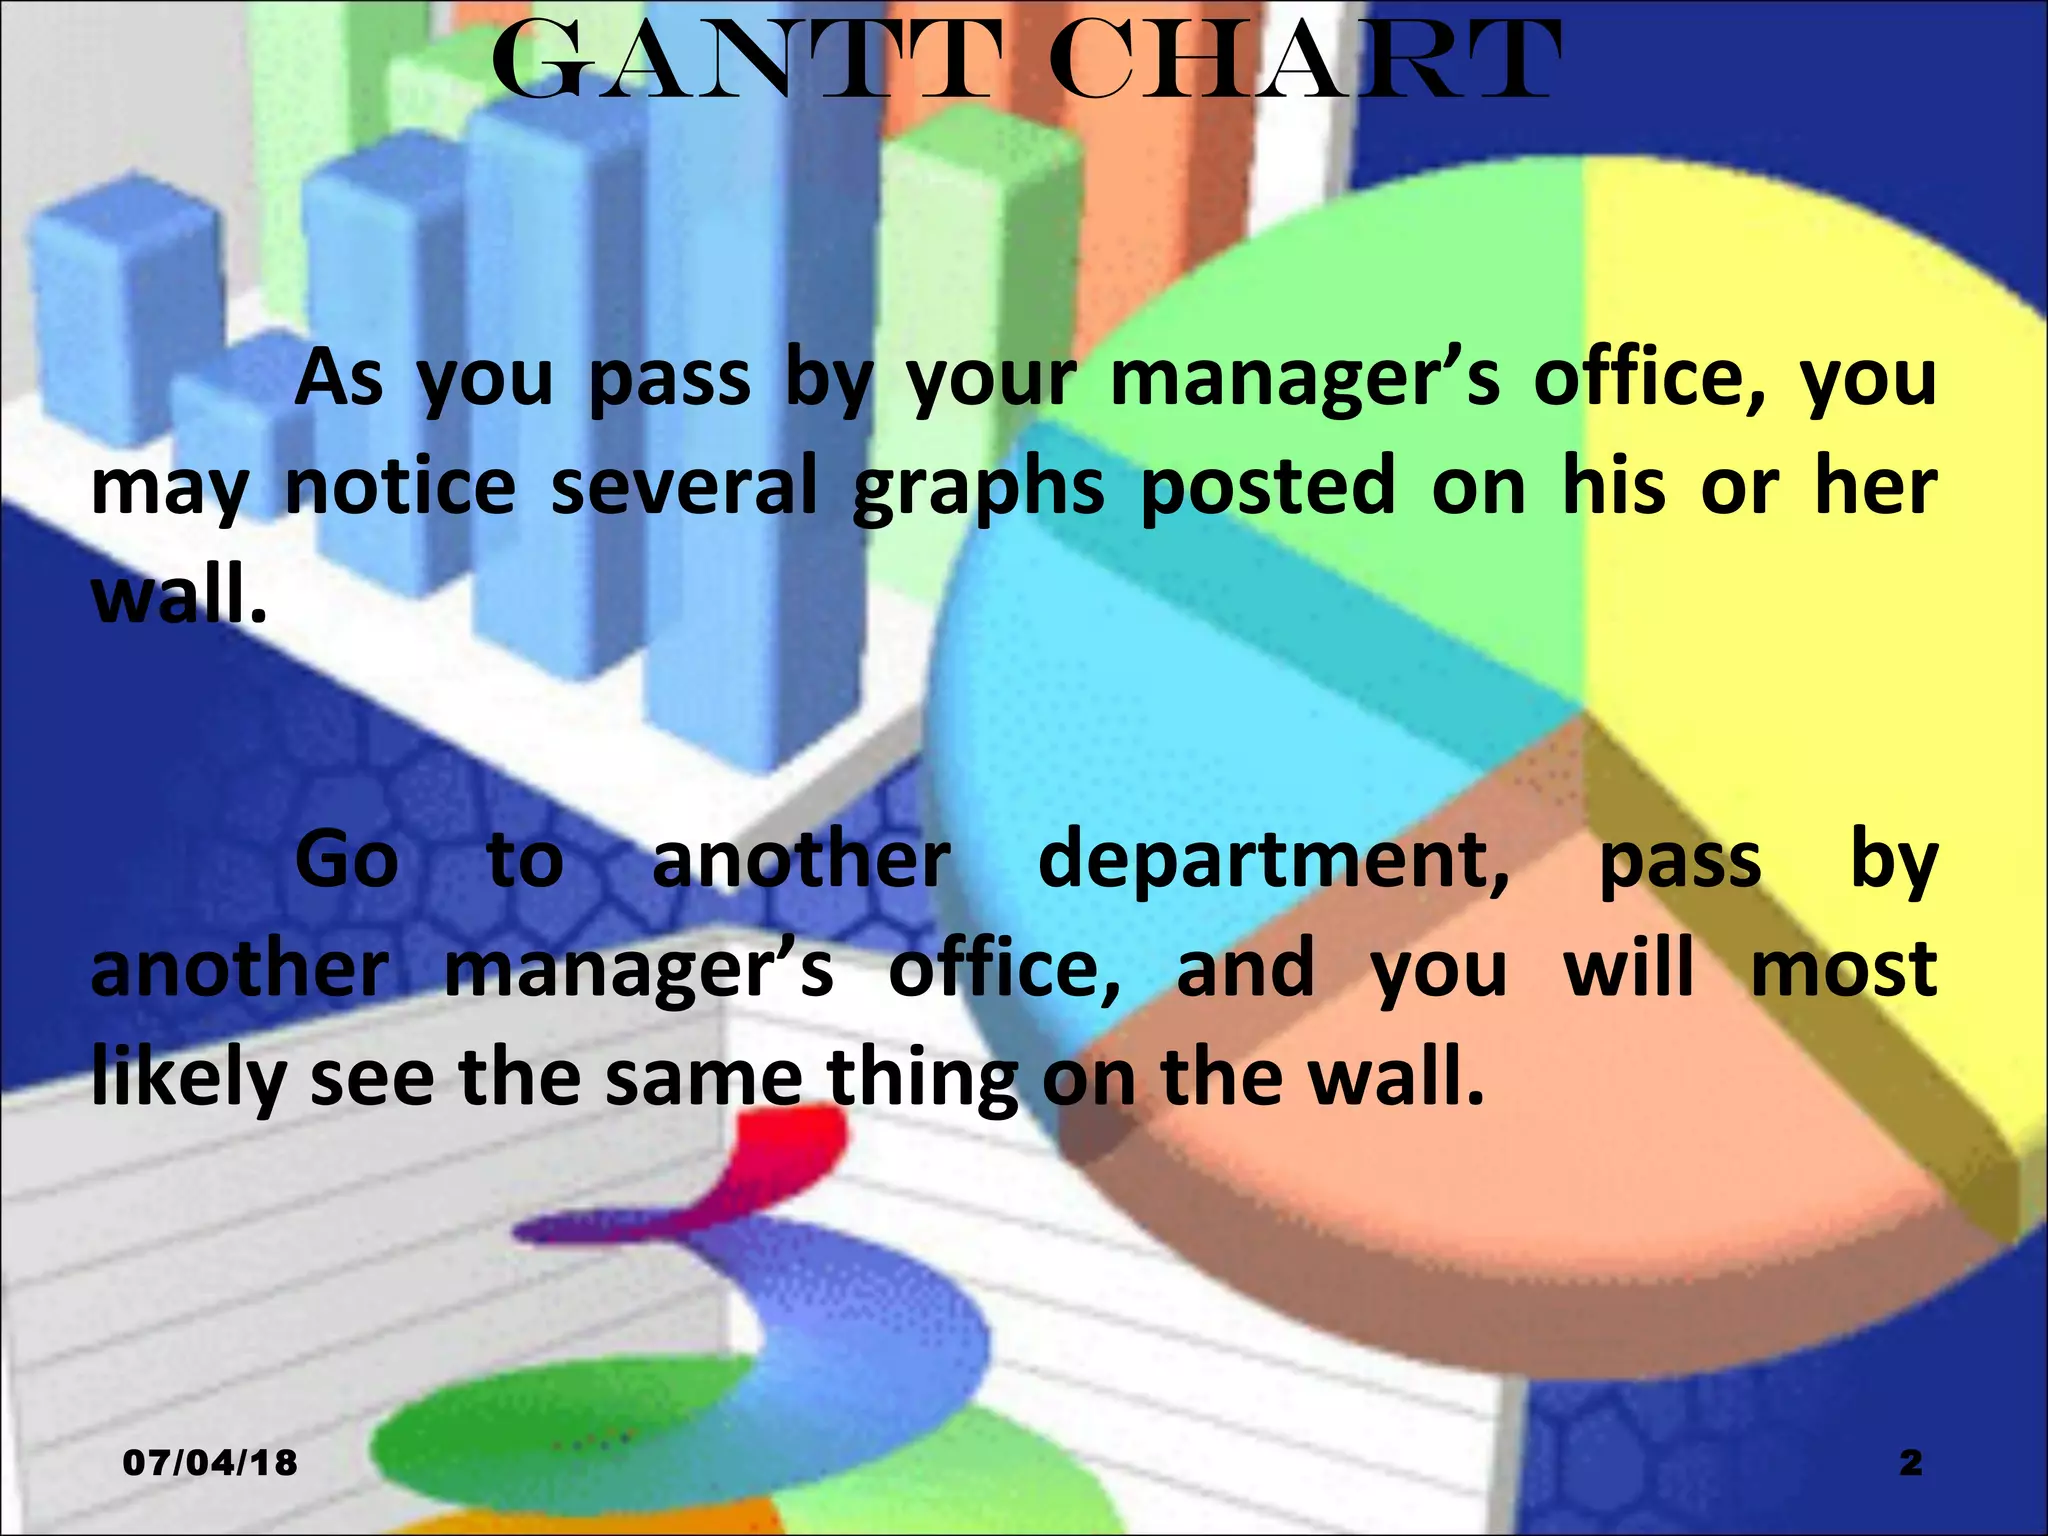
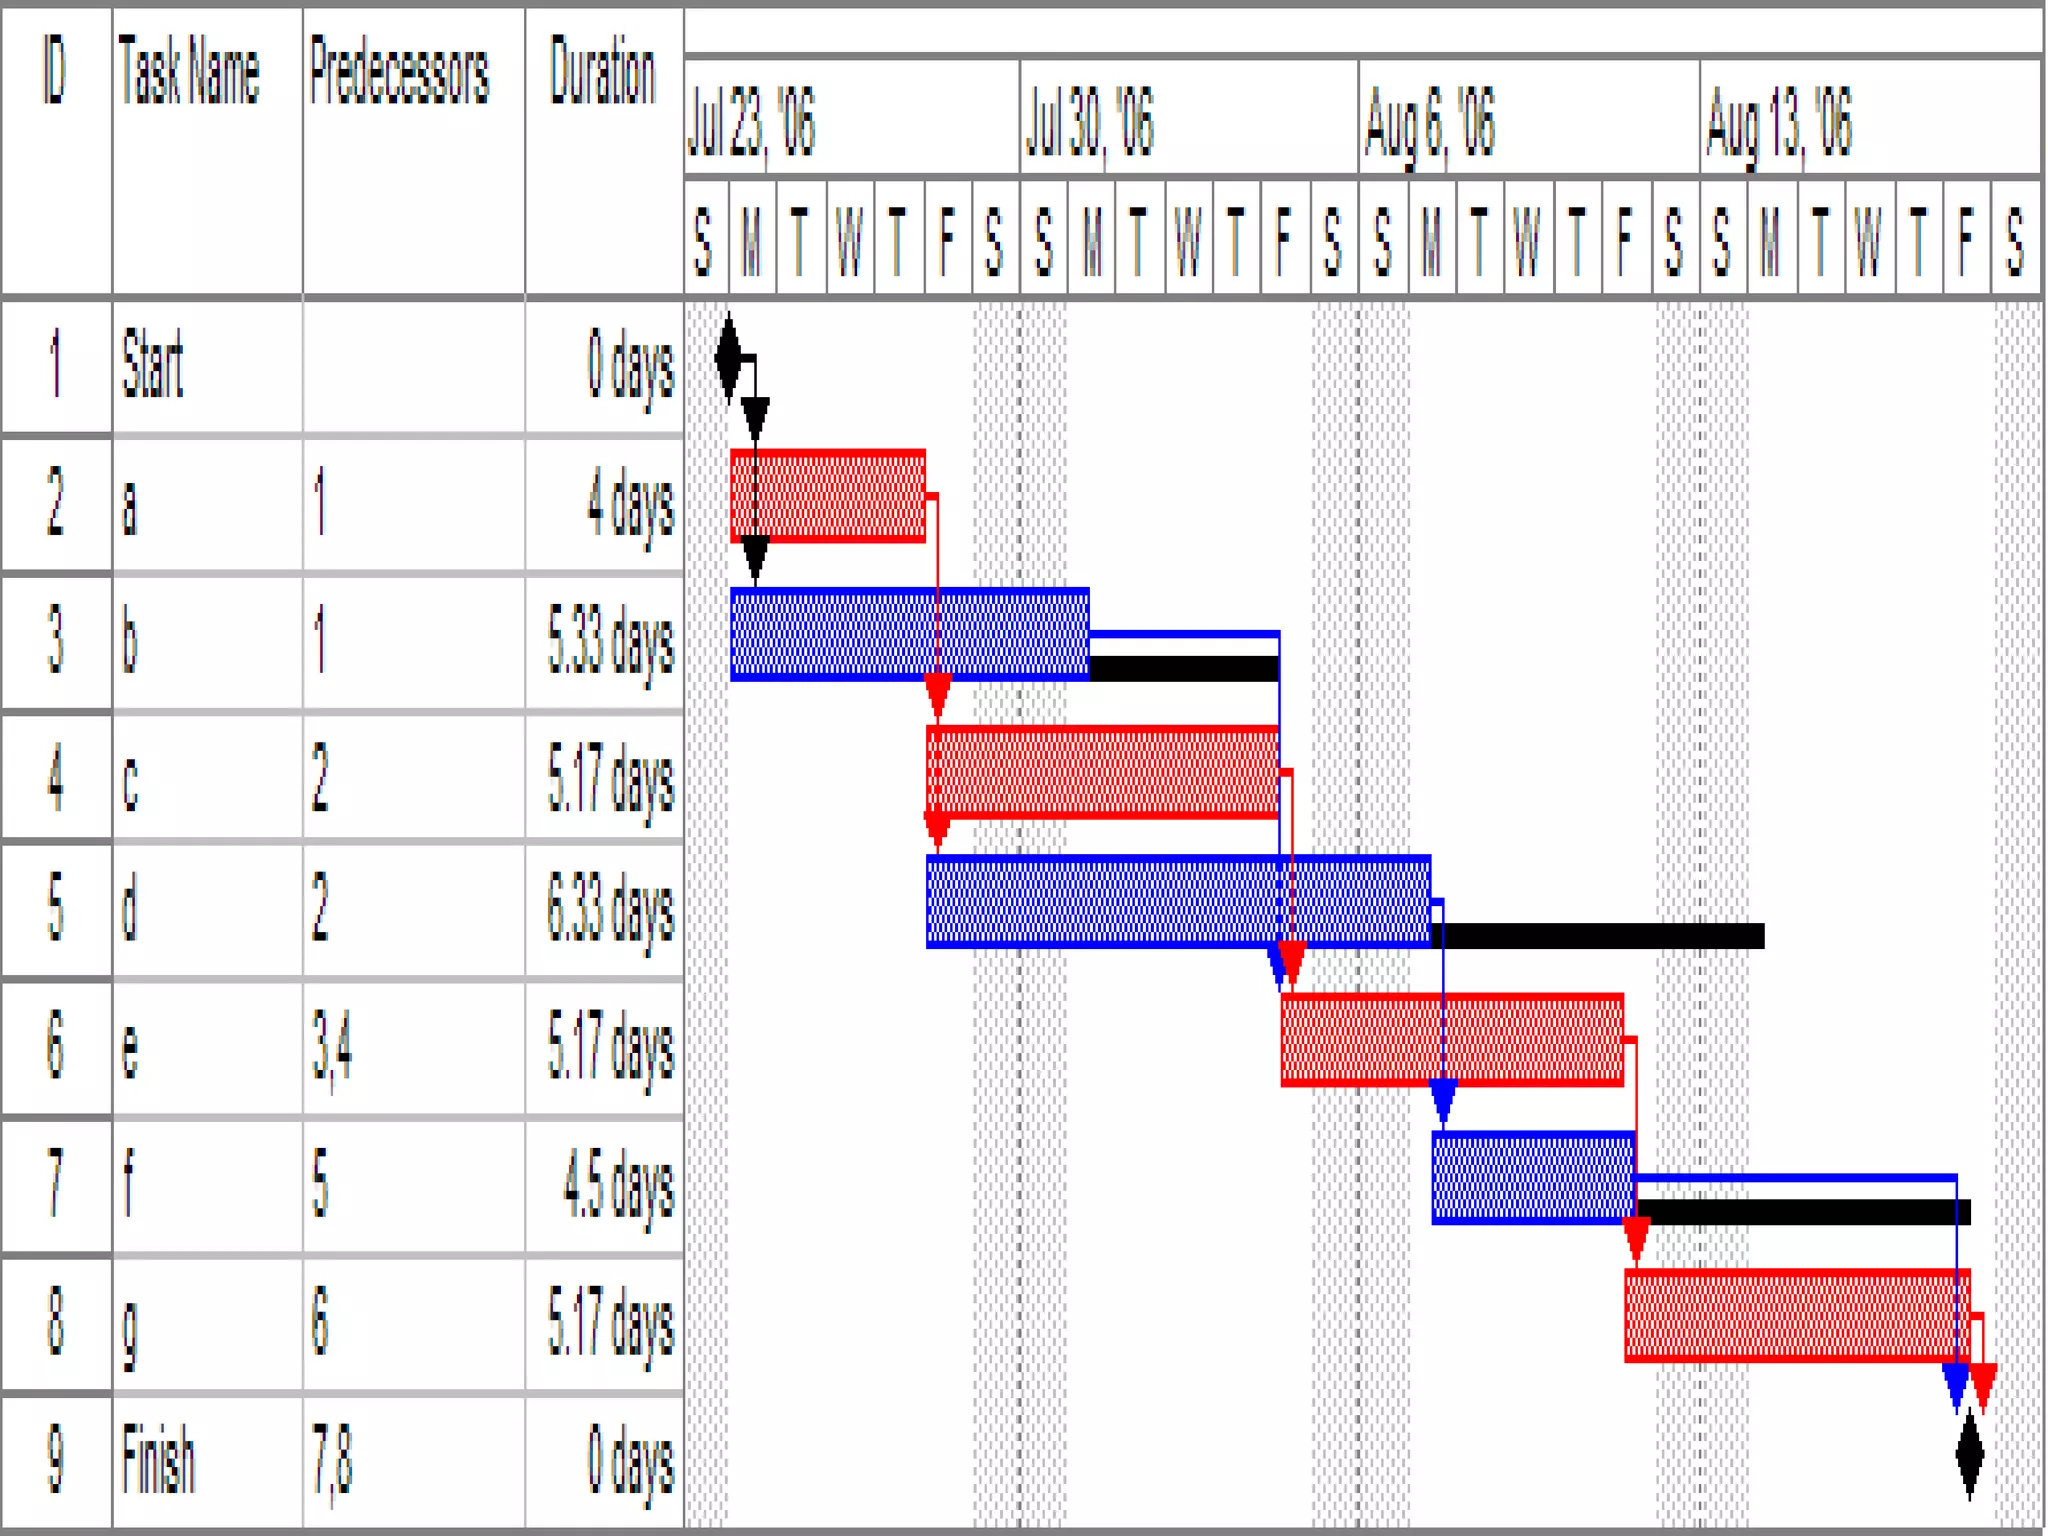
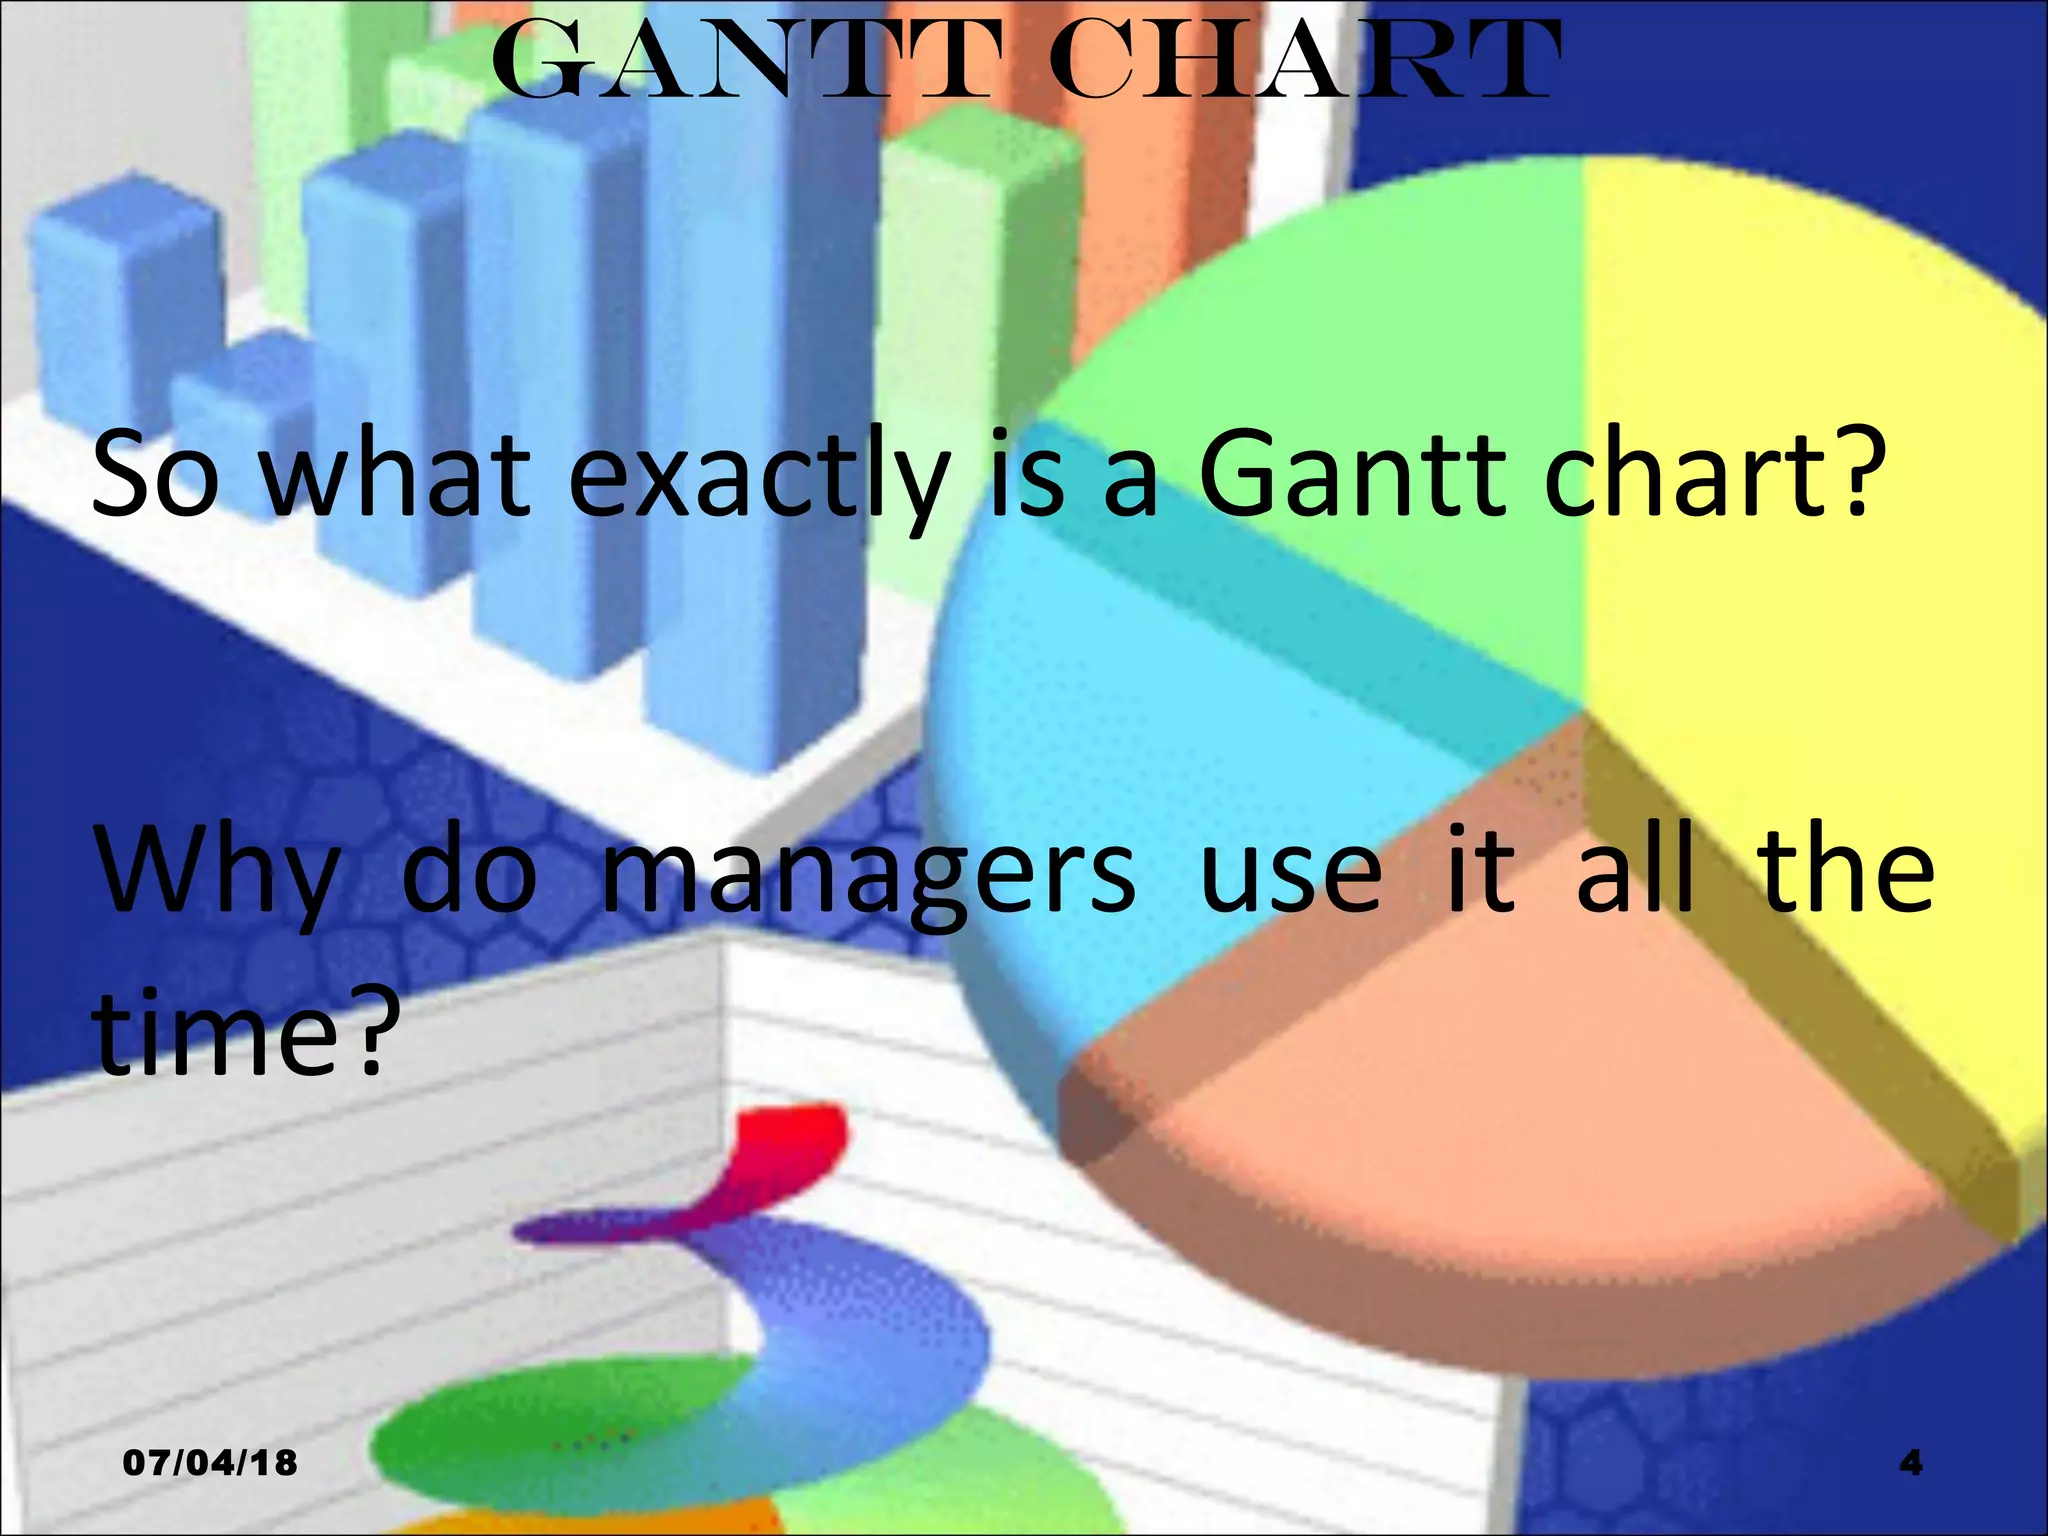
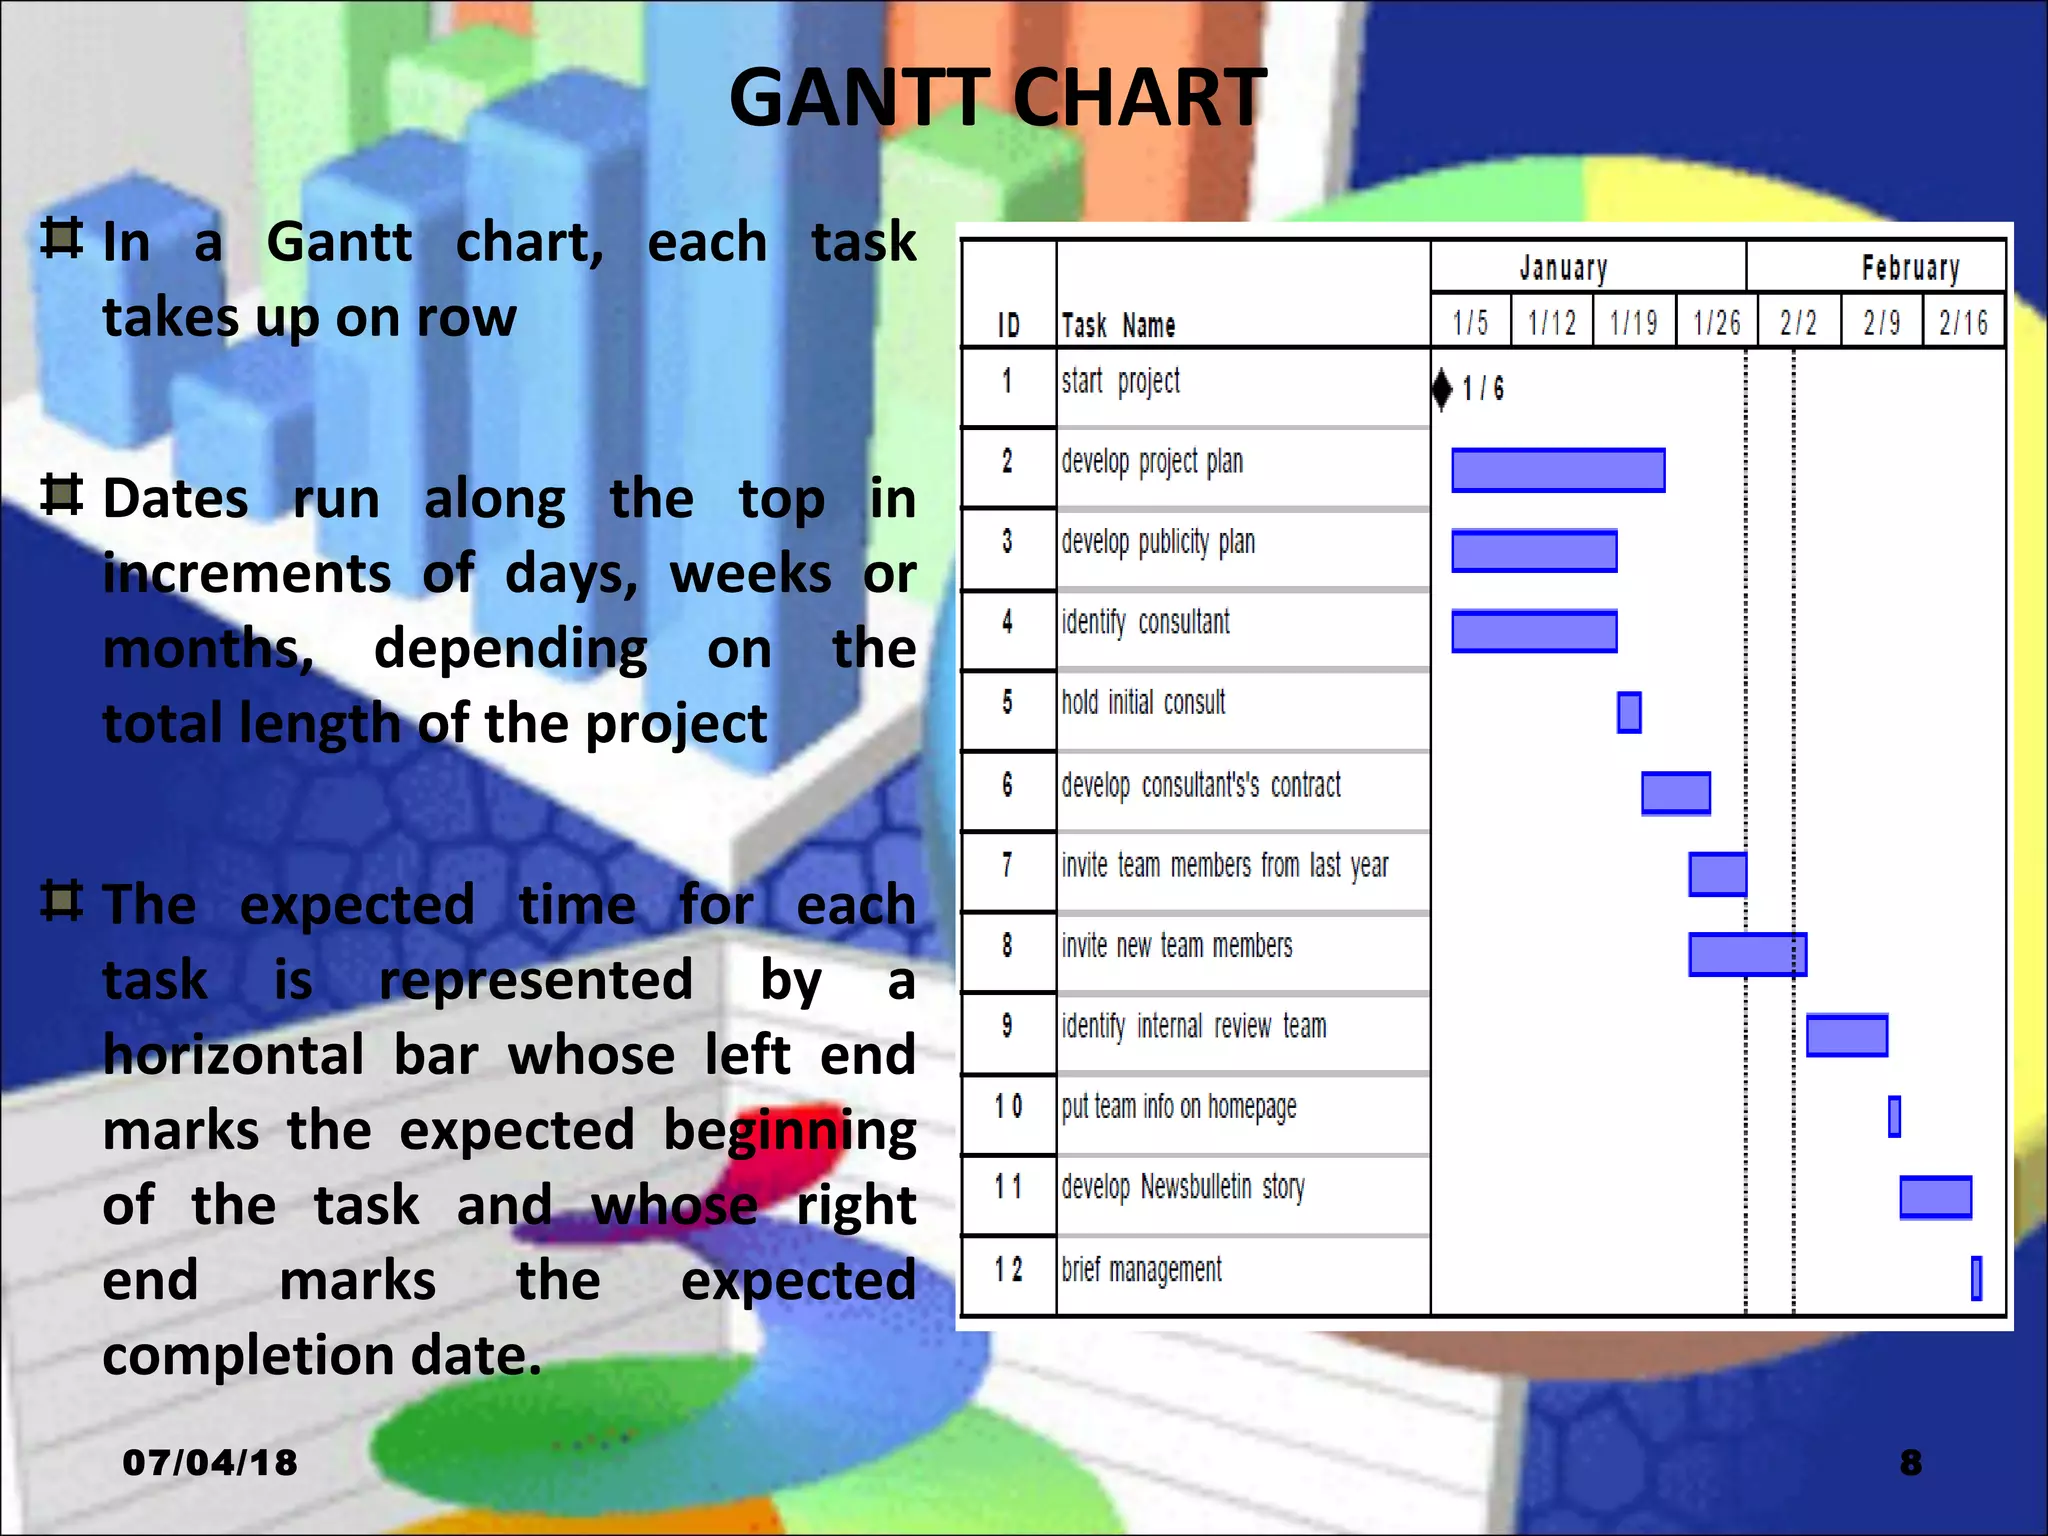
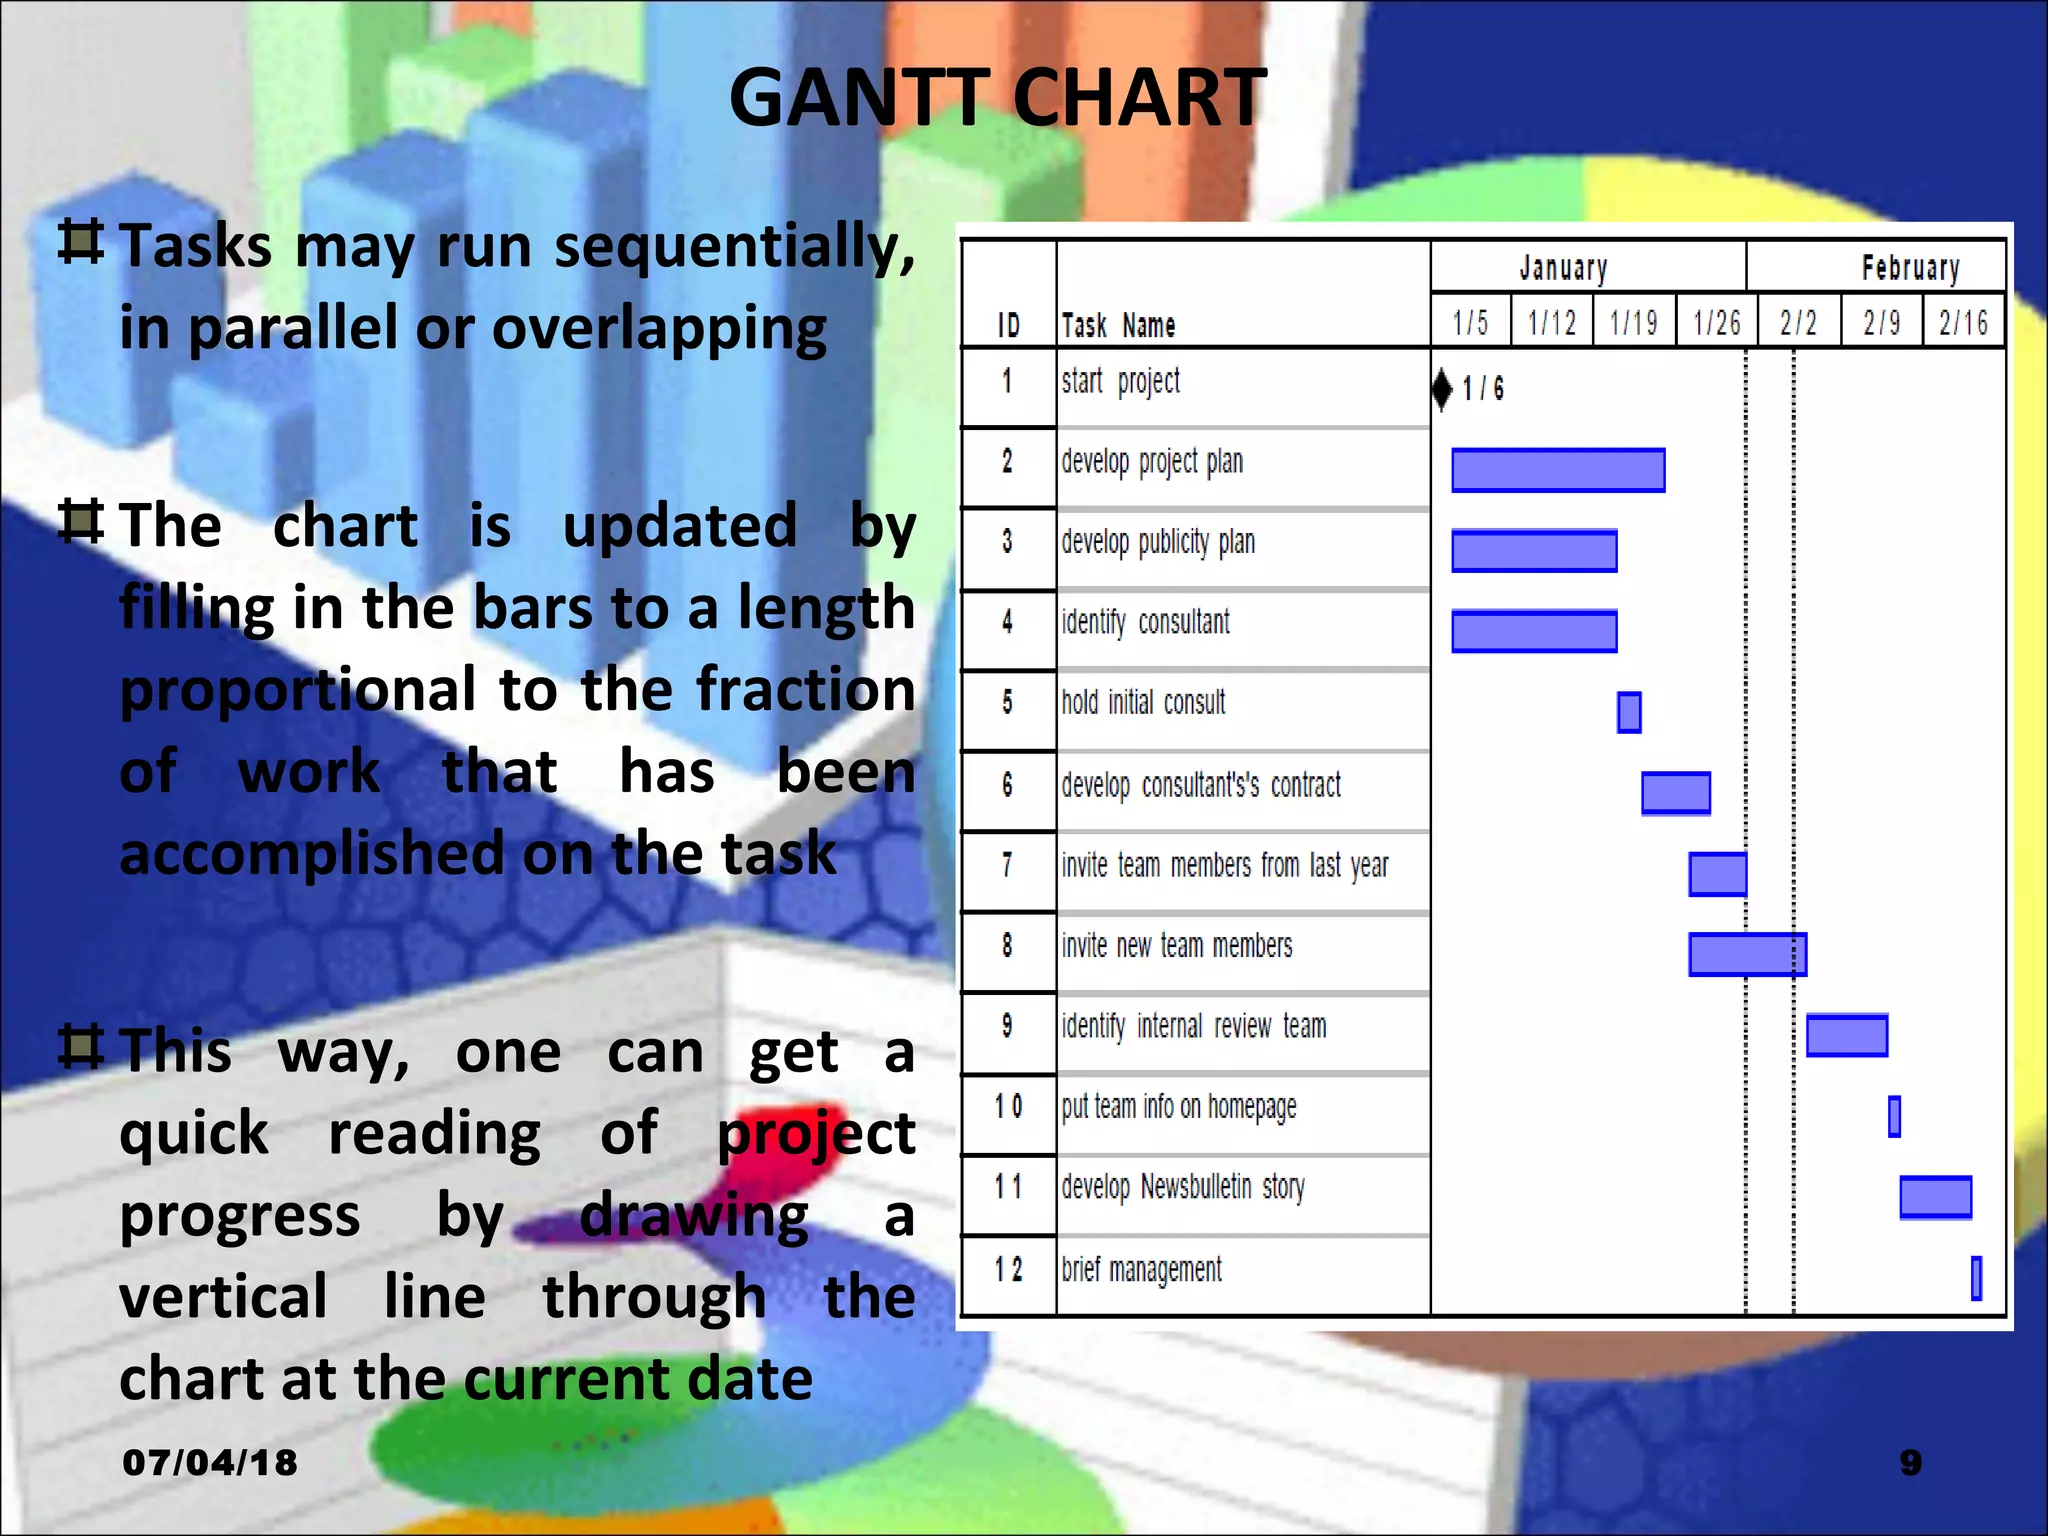
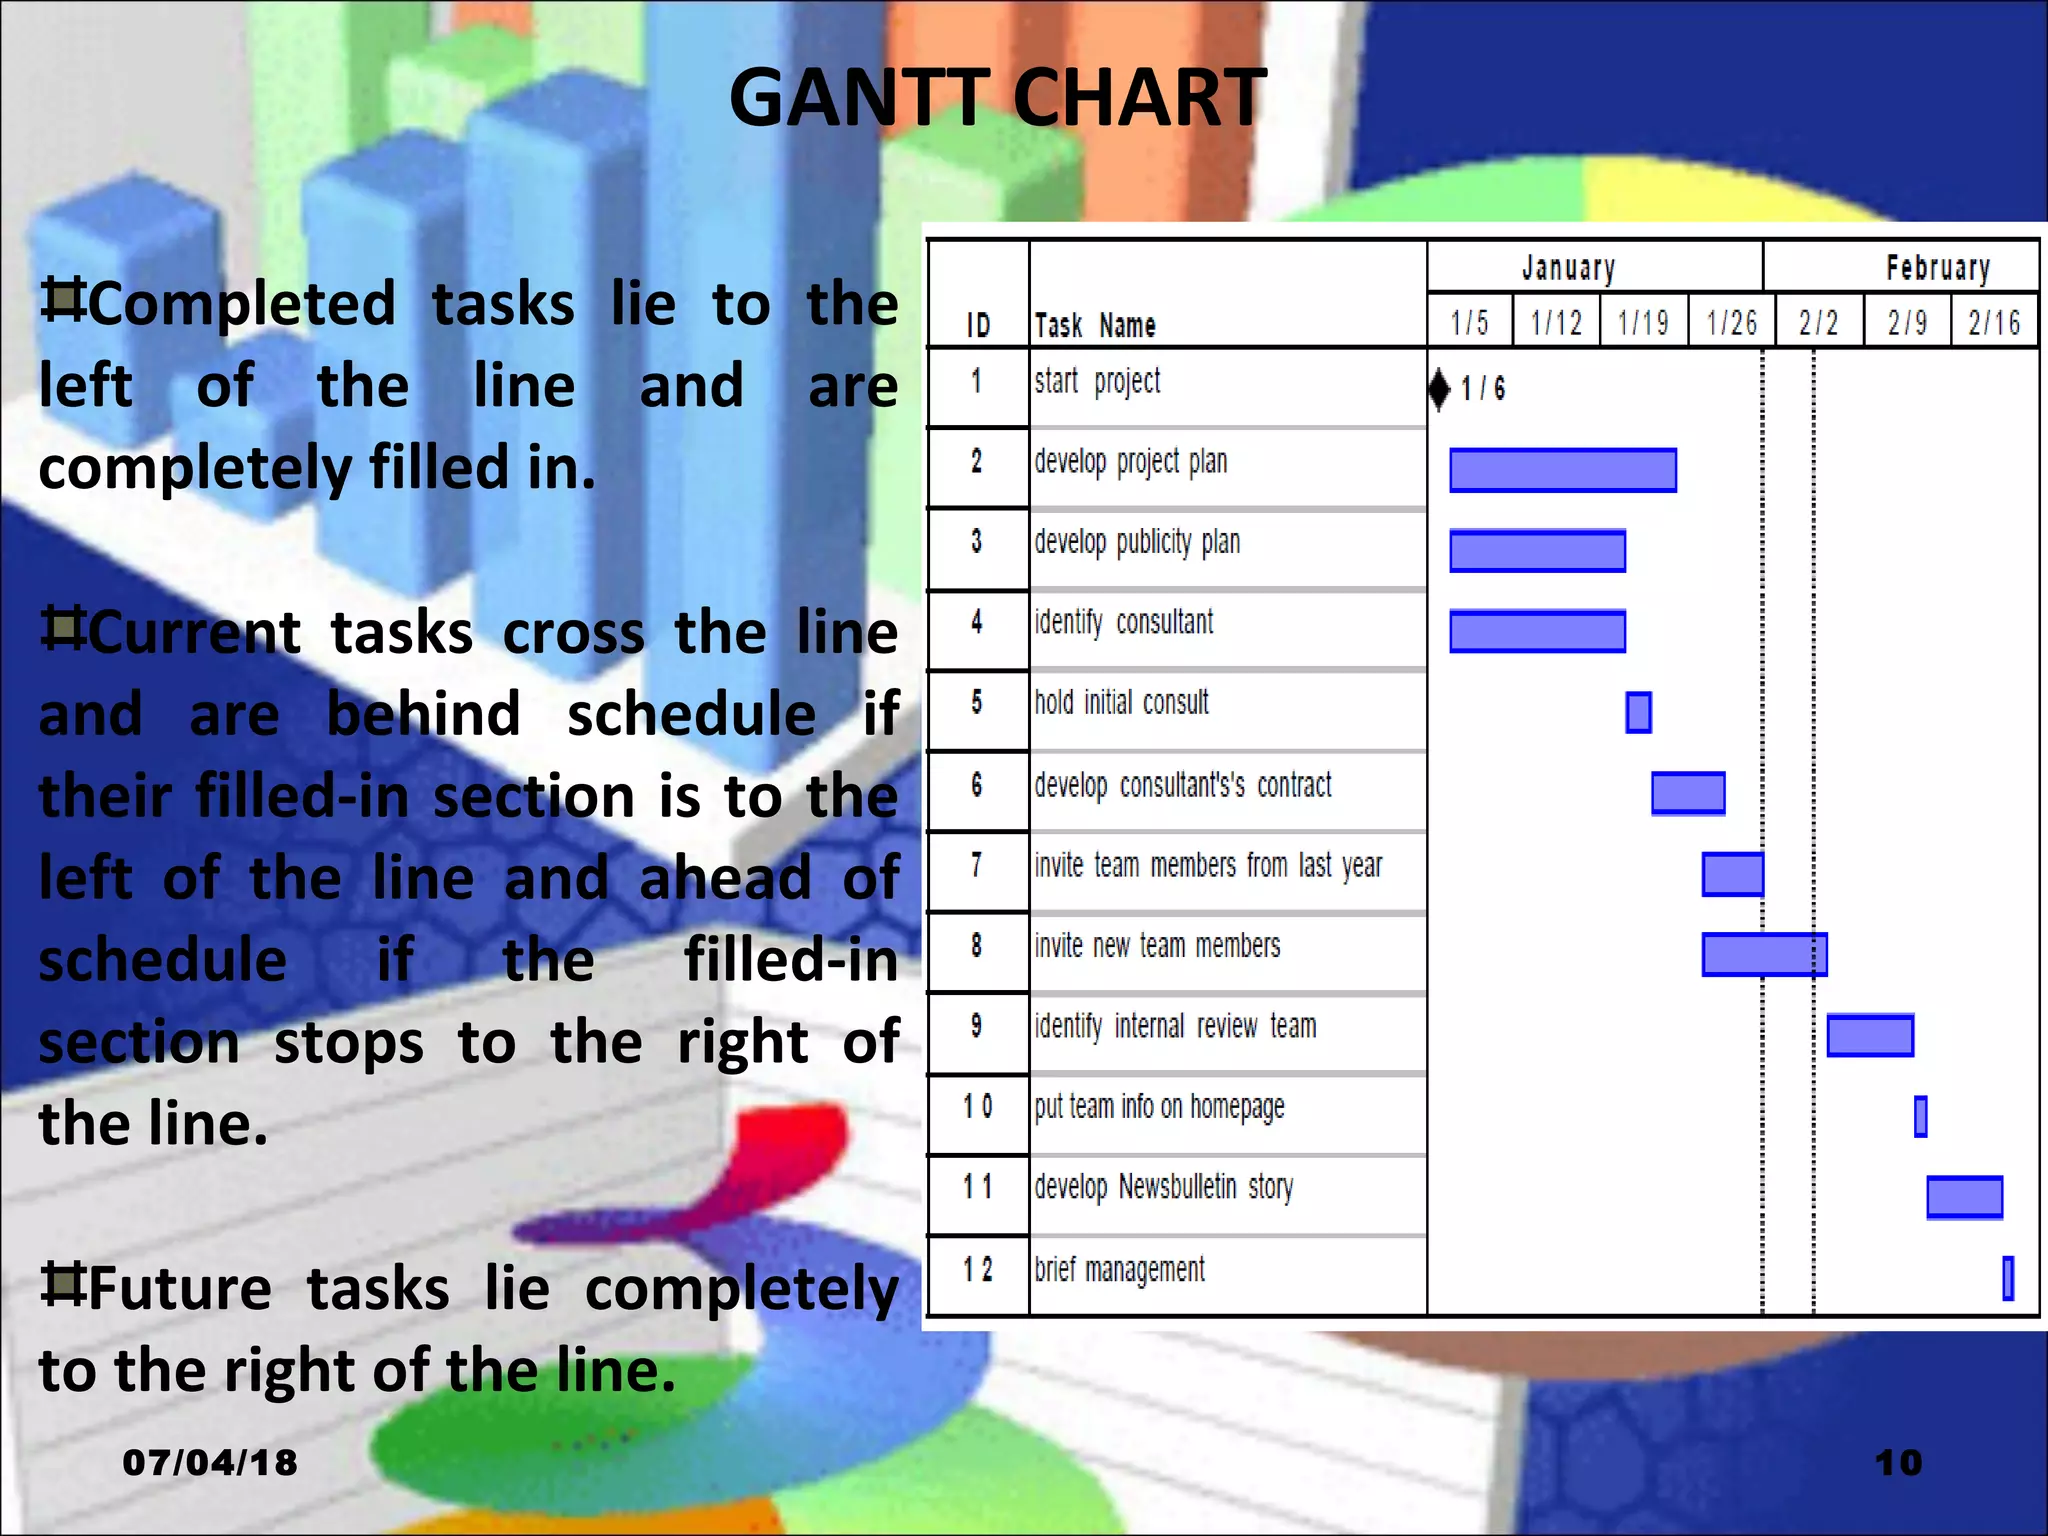
SlideShare a Scribd company logo
GANTT CHART
Manpreet kaur
MSc (N) 2nd
Year
07/04/18 1
GANTT CHART
As you pass by your manager’s office, you
may notice several graphs posted on his or her
wall.
Go to another department, pass by
another manager’s office, and you will most
likely see the same thing on the wall.
07/04/18 2
GANTT CHART
07/04/18 3
GANTT CHART
So what exactly is a Gantt chart?
Why do managers use it all the
time?
07/04/18 4
GANTT CHART
INTRODUCTION
The first known tool of this type was reportedly developed in
1896 by Karol Adamiecki, who called it a harmonogram.
The chart is named after Henry Laurence Gantt, who designed
his chart around the years 1910–1915
With the advent of the internet and increased collaboration
over networks at the end of the 1990s, Gantt charts became a
common feature
07/04/18 5
GANTT CHART
DEFINITION
A Gantt chart is a graphic representation of a project’s schedule,
showing the sequence of tasks, which tasks can be performed
simultaneously, and the most critical tasks to monitor.
A Gantt chart is a bar chart that shows the tasks of a project, when
each must take place and how long each will take. As the project
progresses, bars are shaded to show which tasks have been completed.
A Gantt chart is a type of bar chart that illustrates a project schedule.
Gantt charts illustrate the start and finish dates of the terminal
elements and summary elements of a project.
07/04/18 6
GANTT CHART
When to Use Gantt Charts
Gantt chart provides a graphical illustration of a schedule that helps to plan,
coordinate, and track specific tasks in a project.
•When scheduling and monitoring tasks within a project.
•When communicating plans or status of a project.
•When the steps of the project or process, their sequence and their
duration are known.
•When it’s not necessary to show which tasks depend on completion of
previous tasks
•Gantt charts are most useful for planning and tracking entire projects
or for scheduling and tracking the implementation phase of a planning
or improvement effort.
07/04/18 7
GANTT CHART
In a Gantt chart, each task
takes up on row
Dates run along the top in
increments of days, weeks or
months, depending on the
total length of the project
The expected time for each
task is represented by a
horizontal bar whose left end
marks the expected beginning
of the task and whose right
end marks the expected
completion date.
07/04/18 8
GANTT CHART
Tasks may run sequentially,
in parallel or overlapping
The chart is updated by
filling in the bars to a length
proportional to the fraction
of work that has been
accomplished on the task
This way, one can get a
quick reading of project
progress by drawing a
vertical line through the
chart at the current date
07/04/18 9
GANTT CHART
Completed tasks lie to the
left of the line and are
completely filled in.
Current tasks cross the line
and are behind schedule if
their filled-in section is to the
left of the line and ahead of
schedule if the filled-in
section stops to the right of
the line.
Future tasks lie completely
to the right of the line.
07/04/18 10
GANTT CHART
HOW TO CONSTRUCT
GANTT CHART ??
07/04/18 11
GANTT CHART
CONSTRUCTION
1.Identify tasks
2.Draw a horizontal time axis along the top or bottom of a
page. Mark it off in an appropriate scale for the length of
the tasks (days or weeks).
3.Down the left side of the page, write each task and
milestone of the project in order.
07/04/18 12
GANTT CHART- construction
For activities that occur over a period of time (such as
developing a plan or holding a series of interviews), draw a bar
that spans the appropriate times on the timeline:
Align the left end of the bar with the time the activity begins,
and align the right end with the time the activity concludes.
Draw just the outlines of the bars and diamonds; don’t fill them
in.
4.Check that every task of the project is on the chart.
07/04/18 13
GANTT CHART
Using the Chart
•As events and activities take place, fill in the diamonds and bars
to show completion.
•For tasks in progress, estimate how far along you are and fill in
that much of the bar.
•Place a vertical marker to show where you are on the timeline.
•If the chart is posted on the wall, for example, an easy way to
show the current time is with a heavy dark string hung vertically
across the chart with two thumbtacks.
07/04/18 14
GANTT CHART
ADVANTAGES
1.Clarity
2.2. Communication
3.Motivation
4.Coordination
5.Creativity
6.Time Management
07/04/18 15
GANTT CHART
DISADVANTAGES
• Although a Gantt chart is useful and valuable for small projects
that fit on a single sheet or screen, they can become quite
unwieldy for projects with more than about 30 activities
• Larger Gantt charts may not be suitable for most computer
displays
• Some projects are often considerably more complex than can
be communicated effectively with a Gantt chart
• Gantt charts do not represent the size of a project or the
relative size of work elements, therefore the magnitude of a
behind-schedule condition is easily miscommunicated
07/04/18 16

More Related Content

What's hot

Program Evaluation and Review Technique (PERT)
Program Evaluation and Review Technique (PERT)Program Evaluation and Review Technique (PERT)
Program Evaluation and Review Technique (PERT)
Abhishek Pachisia
 
09 gantt charts
09 gantt charts09 gantt charts
09 gantt charts
mike
 

What's hot (20)

Pert
PertPert
Pert
 
Programme evaluation & review technique (pert)
Programme evaluation & review technique (pert)Programme evaluation & review technique (pert)
Programme evaluation & review technique (pert)
 
Programme evaluation and review technique &Gantt Chart
Programme evaluation and review technique &Gantt ChartProgramme evaluation and review technique &Gantt Chart
Programme evaluation and review technique &Gantt Chart
 
Ghant chart
Ghant chartGhant chart
Ghant chart
 
Pert and gantt chart
Pert and gantt chartPert and gantt chart
Pert and gantt chart
 
CPM/PERT and Gantt charts
CPM/PERT and Gantt chartsCPM/PERT and Gantt charts
CPM/PERT and Gantt charts
 
Gantt chart
Gantt chartGantt chart
Gantt chart
 
Critical Path Method (CPM) & Network Analysis
Critical Path Method (CPM) & Network AnalysisCritical Path Method (CPM) & Network Analysis
Critical Path Method (CPM) & Network Analysis
 
PERT MBO GANTT CHART
PERT MBO GANTT CHARTPERT MBO GANTT CHART
PERT MBO GANTT CHART
 
Program Evaluation and Review Technique (PERT)
Program Evaluation and Review Technique (PERT)Program Evaluation and Review Technique (PERT)
Program Evaluation and Review Technique (PERT)
 
Critical path method
Critical path methodCritical path method
Critical path method
 
PERT (Program evaluation review technique)
PERT (Program evaluation review technique) PERT (Program evaluation review technique)
PERT (Program evaluation review technique)
 
Program Evaluation and Review Technique
Program Evaluation and Review TechniqueProgram Evaluation and Review Technique
Program Evaluation and Review Technique
 
Programme evaluation review technique
Programme evaluation review techniqueProgramme evaluation review technique
Programme evaluation review technique
 
Seminar on pert
Seminar on pertSeminar on pert
Seminar on pert
 
Pert & Cpm
Pert & CpmPert & Cpm
Pert & Cpm
 
Cpm (critical path method)
Cpm (critical path method)Cpm (critical path method)
Cpm (critical path method)
 
09 gantt charts
09 gantt charts09 gantt charts
09 gantt charts
 
Lecture5---Gantt Chart
Lecture5---Gantt ChartLecture5---Gantt Chart
Lecture5---Gantt Chart
 
Project management Pert & cpm
Project management Pert & cpm Project management Pert & cpm
Project management Pert & cpm
 

Similar to Gantt chart

Similar to Gantt chart (20)

Gantt Chart Description
Gantt Chart DescriptionGantt Chart Description
Gantt Chart Description
 
Gannt Chart Class Presentation pptx
Gannt  Chart  Class  Presentation   pptxGannt  Chart  Class  Presentation   pptx
Gannt Chart Class Presentation pptx
 
WBS Gantt chart and project management for Jira users
WBS Gantt chart and project management for Jira usersWBS Gantt chart and project management for Jira users
WBS Gantt chart and project management for Jira users
 
#@123ganttchart-240304175359-d9a26905.pptx
#@123ganttchart-240304175359-d9a26905.pptx#@123ganttchart-240304175359-d9a26905.pptx
#@123ganttchart-240304175359-d9a26905.pptx
 
An Introduction to Gantt Charts
An Introduction to Gantt Charts An Introduction to Gantt Charts
An Introduction to Gantt Charts
 
Gantt charts
Gantt chartsGantt charts
Gantt charts
 
Gantt Charts and PERT# Charts: Different But Not So Different
Gantt Charts and PERT# Charts: Different But Not So DifferentGantt Charts and PERT# Charts: Different But Not So Different
Gantt Charts and PERT# Charts: Different But Not So Different
 
What is a Gantt chart
What is a Gantt chartWhat is a Gantt chart
What is a Gantt chart
 
Gantt chart information gantt chart and history.pptx
Gantt chart information gantt chart and history.pptxGantt chart information gantt chart and history.pptx
Gantt chart information gantt chart and history.pptx
 
gantt chart & pert in Software engineering.pptx
gantt chart & pert in Software engineering.pptxgantt chart & pert in Software engineering.pptx
gantt chart & pert in Software engineering.pptx
 
Gantt chart discuss 2
Gantt chart discuss 2Gantt chart discuss 2
Gantt chart discuss 2
 
Events Planning - Midterm 2 quiz.docx
Events Planning - Midterm 2 quiz.docxEvents Planning - Midterm 2 quiz.docx
Events Planning - Midterm 2 quiz.docx
 
project management -04.ppt
project management -04.pptproject management -04.ppt
project management -04.ppt
 
Are Gantt charts your worst nightmares well, not anymore!
Are Gantt charts your worst nightmares well, not anymore!Are Gantt charts your worst nightmares well, not anymore!
Are Gantt charts your worst nightmares well, not anymore!
 
GANTT CHART nursing Management for Msc nursing
GANTT CHART nursing Management for Msc nursingGANTT CHART nursing Management for Msc nursing
GANTT CHART nursing Management for Msc nursing
 
Lab 2 create a gantt chart and pert chart using ms project
Lab 2 create a gantt chart and pert chart using ms projectLab 2 create a gantt chart and pert chart using ms project
Lab 2 create a gantt chart and pert chart using ms project
 
Gantt chart PPT, POOJA GODIYAL
Gantt chart PPT, POOJA GODIYALGantt chart PPT, POOJA GODIYAL
Gantt chart PPT, POOJA GODIYAL
 
Brief tutorial on gantt charts
Brief tutorial on gantt chartsBrief tutorial on gantt charts
Brief tutorial on gantt charts
 
GANTT CHART.pptx
GANTT CHART.pptxGANTT CHART.pptx
GANTT CHART.pptx
 
Lec 12 gantt chart
Lec 12 gantt chartLec 12 gantt chart
Lec 12 gantt chart
 

Recently uploaded

Recently uploaded (9)

Travis Hills of Minnesota Leads Livestock Water and Energy in Sustainable Inn...
Travis Hills of Minnesota Leads Livestock Water and Energy in Sustainable Inn...Travis Hills of Minnesota Leads Livestock Water and Energy in Sustainable Inn...
Travis Hills of Minnesota Leads Livestock Water and Energy in Sustainable Inn...
 
Risk Management in Banks - Overview (May 2024)
Risk Management in Banks - Overview (May 2024)Risk Management in Banks - Overview (May 2024)
Risk Management in Banks - Overview (May 2024)
 
ANIn Delhi Feb 2022 | Design the Future with Technology Disruption by N Kisho...
ANIn Delhi Feb 2022 | Design the Future with Technology Disruption by N Kisho...ANIn Delhi Feb 2022 | Design the Future with Technology Disruption by N Kisho...
ANIn Delhi Feb 2022 | Design the Future with Technology Disruption by N Kisho...
 
TCS AI for Business Study – Key Findings
TCS AI for Business Study – Key FindingsTCS AI for Business Study – Key Findings
TCS AI for Business Study – Key Findings
 
Flexi time, Flexi work, QWL and Role Effectiveness
Flexi time, Flexi  work, QWL and  Role EffectivenessFlexi time, Flexi  work, QWL and  Role Effectiveness
Flexi time, Flexi work, QWL and Role Effectiveness
 
Create the recognition your teams deserve.pptx
Create the recognition your teams deserve.pptxCreate the recognition your teams deserve.pptx
Create the recognition your teams deserve.pptx
 
Project Management Professional (PMP)® from PMI
Project Management Professional (PMP)® from PMIProject Management Professional (PMP)® from PMI
Project Management Professional (PMP)® from PMI
 
Founder-Game Director Workshop (Session 1)
Founder-Game Director  Workshop (Session 1)Founder-Game Director  Workshop (Session 1)
Founder-Game Director Workshop (Session 1)
 
Oprah Winfrey: A Leader in Media, Philanthropy, and Empowerment | CIO Women M...
Oprah Winfrey: A Leader in Media, Philanthropy, and Empowerment | CIO Women M...Oprah Winfrey: A Leader in Media, Philanthropy, and Empowerment | CIO Women M...
Oprah Winfrey: A Leader in Media, Philanthropy, and Empowerment | CIO Women M...
 

Gantt chart

  • 1. GANTT CHART Manpreet kaur MSc (N) 2nd Year 07/04/18 1
  • 2. GANTT CHART As you pass by your manager’s office, you may notice several graphs posted on his or her wall. Go to another department, pass by another manager’s office, and you will most likely see the same thing on the wall. 07/04/18 2
  • 4. GANTT CHART So what exactly is a Gantt chart? Why do managers use it all the time? 07/04/18 4
  • 5. GANTT CHART INTRODUCTION The first known tool of this type was reportedly developed in 1896 by Karol Adamiecki, who called it a harmonogram. The chart is named after Henry Laurence Gantt, who designed his chart around the years 1910–1915 With the advent of the internet and increased collaboration over networks at the end of the 1990s, Gantt charts became a common feature 07/04/18 5
  • 6. GANTT CHART DEFINITION A Gantt chart is a graphic representation of a project’s schedule, showing the sequence of tasks, which tasks can be performed simultaneously, and the most critical tasks to monitor. A Gantt chart is a bar chart that shows the tasks of a project, when each must take place and how long each will take. As the project progresses, bars are shaded to show which tasks have been completed. A Gantt chart is a type of bar chart that illustrates a project schedule. Gantt charts illustrate the start and finish dates of the terminal elements and summary elements of a project. 07/04/18 6
  • 7. GANTT CHART When to Use Gantt Charts Gantt chart provides a graphical illustration of a schedule that helps to plan, coordinate, and track specific tasks in a project. •When scheduling and monitoring tasks within a project. •When communicating plans or status of a project. •When the steps of the project or process, their sequence and their duration are known. •When it’s not necessary to show which tasks depend on completion of previous tasks •Gantt charts are most useful for planning and tracking entire projects or for scheduling and tracking the implementation phase of a planning or improvement effort. 07/04/18 7
  • 8. GANTT CHART In a Gantt chart, each task takes up on row Dates run along the top in increments of days, weeks or months, depending on the total length of the project The expected time for each task is represented by a horizontal bar whose left end marks the expected beginning of the task and whose right end marks the expected completion date. 07/04/18 8
  • 9. GANTT CHART Tasks may run sequentially, in parallel or overlapping The chart is updated by filling in the bars to a length proportional to the fraction of work that has been accomplished on the task This way, one can get a quick reading of project progress by drawing a vertical line through the chart at the current date 07/04/18 9
  • 10. GANTT CHART Completed tasks lie to the left of the line and are completely filled in. Current tasks cross the line and are behind schedule if their filled-in section is to the left of the line and ahead of schedule if the filled-in section stops to the right of the line. Future tasks lie completely to the right of the line. 07/04/18 10
  • 11. GANTT CHART HOW TO CONSTRUCT GANTT CHART ?? 07/04/18 11
  • 12. GANTT CHART CONSTRUCTION 1.Identify tasks 2.Draw a horizontal time axis along the top or bottom of a page. Mark it off in an appropriate scale for the length of the tasks (days or weeks). 3.Down the left side of the page, write each task and milestone of the project in order. 07/04/18 12
  • 13. GANTT CHART- construction For activities that occur over a period of time (such as developing a plan or holding a series of interviews), draw a bar that spans the appropriate times on the timeline: Align the left end of the bar with the time the activity begins, and align the right end with the time the activity concludes. Draw just the outlines of the bars and diamonds; don’t fill them in. 4.Check that every task of the project is on the chart. 07/04/18 13
  • 14. GANTT CHART Using the Chart •As events and activities take place, fill in the diamonds and bars to show completion. •For tasks in progress, estimate how far along you are and fill in that much of the bar. •Place a vertical marker to show where you are on the timeline. •If the chart is posted on the wall, for example, an easy way to show the current time is with a heavy dark string hung vertically across the chart with two thumbtacks. 07/04/18 14
  • 16. GANTT CHART DISADVANTAGES • Although a Gantt chart is useful and valuable for small projects that fit on a single sheet or screen, they can become quite unwieldy for projects with more than about 30 activities • Larger Gantt charts may not be suitable for most computer displays • Some projects are often considerably more complex than can be communicated effectively with a Gantt chart • Gantt charts do not represent the size of a project or the relative size of work elements, therefore the magnitude of a behind-schedule condition is easily miscommunicated 07/04/18 16