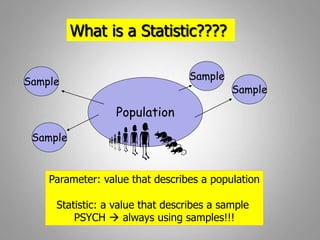
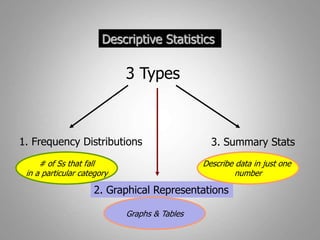
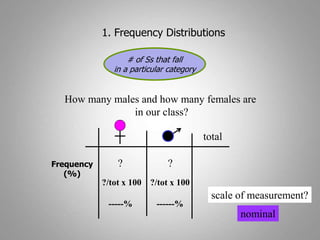
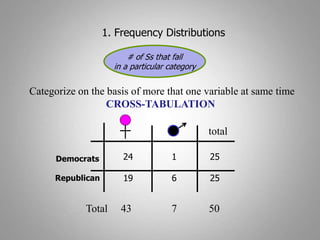
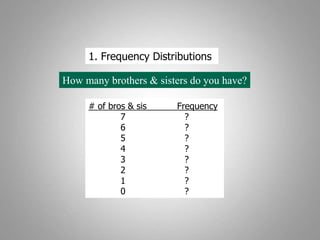
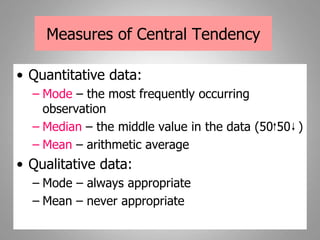
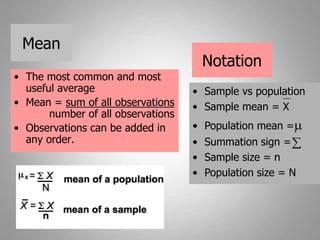
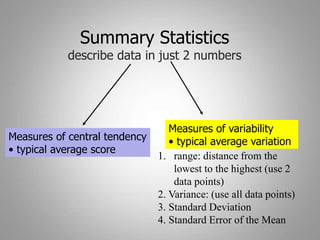
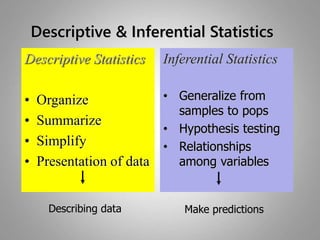
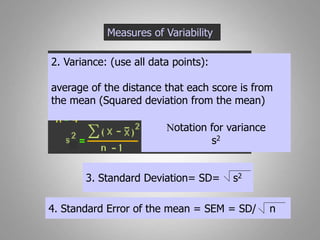
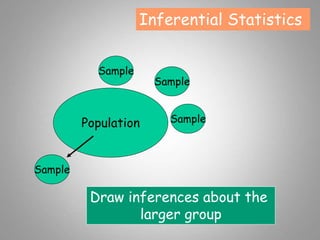
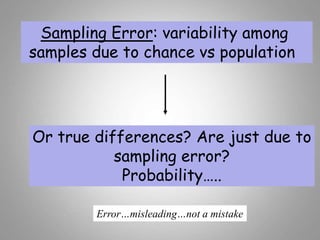
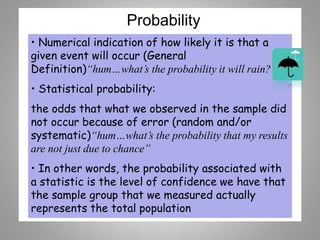
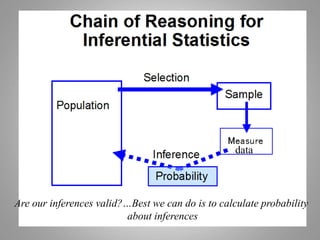
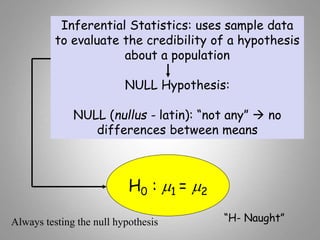
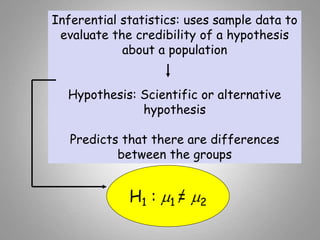
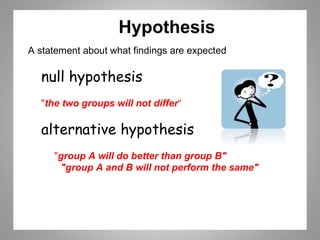
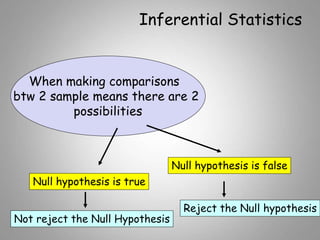
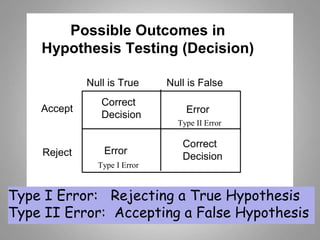
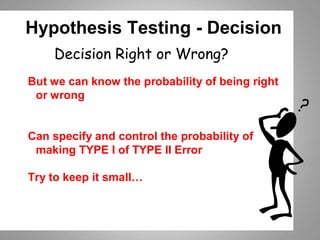
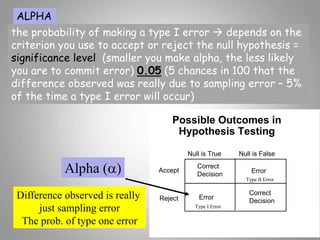
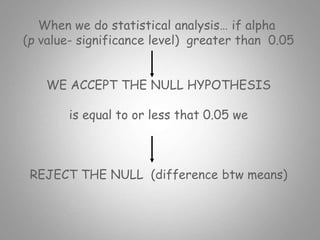
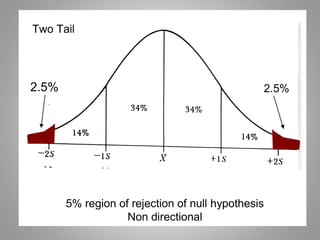
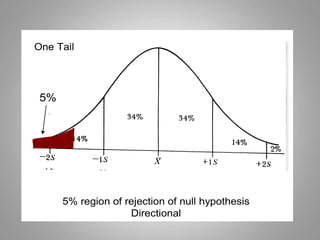
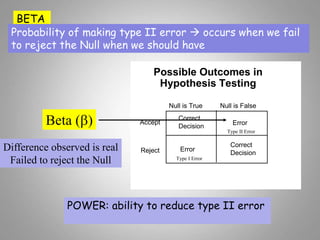
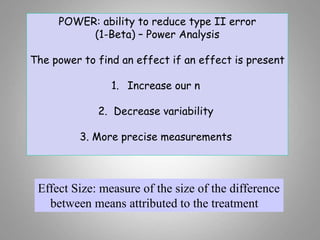
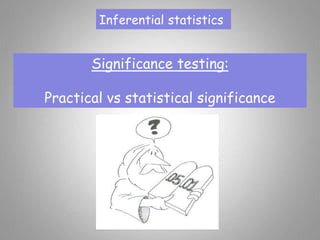
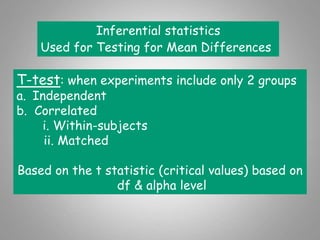
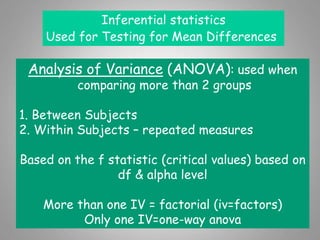
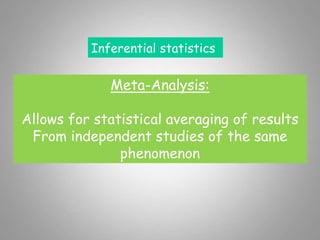
SlideShare a Scribd company logo
1 of 42
Lecture 5: Chapter 5
Statistical Analysis of Data
…yes the “S” word
What is a Statistic????
Population
Sample
Sample
Sample
Sample
Parameter: value that describes a population
Statistic: a value that describes a sample
PSYCH  always using samples!!!
Descriptive & Inferential Statistics
Descriptive Statistics
• Organize
• Summarize
• Simplify
• Presentation of data
Inferential Statistics
• Generalize from
samples to pops
• Hypothesis testing
• Relationships
among variables
Describing data Make predictions
Descriptive Statistics
3 Types
1. Frequency Distributions 3. Summary Stats
2. Graphical Representations
# of Ss that fall
in a particular category
Describe data in just one
number
Graphs & Tables
1. Frequency Distributions
# of Ss that fall
in a particular category
How many males and how many females are
in our class?
Frequency
(%)
? ?
?/tot x 100 ?/tot x 100
-----% ------%
total
scale of measurement?
nominal
1. Frequency Distributions
# of Ss that fall
in a particular category
Categorize on the basis of more that one variable at same time
CROSS-TABULATION
Democrats
Republican
total
24 1 25
19 6 25
Total 43 7 50
1. Frequency Distributions
How many brothers & sisters do you have?
# of bros & sis Frequency
7 ?
6 ?
5 ?
4 ?
3 ?
2 ?
1 ?
0 ?
2. Graphical Representations
Graphs & Tables
Bar graph (ratio data - quantitative)
Histogram of the categorical variables
2. Graphical Representations
Polygon - Line Graph
2. Graphical Representations
Graphs & Tables
How many brothers & sisters do you have?
Lets plot class data: HISTOGRAM
# of bros & sis Frequency
7 ?
6 ?
5 ?
4 ?
3 ?
2 ?
1 ?
0 ?
Altman, D. G et al. BMJ 1995;310:298
Central Limit Theorem: the larger the sample size, the closer a distribution
will approximate the normal distribution or
A distribution of scores taken at random from any distribution will tend to
form a normal curve
jagged
smooth
2.5% 2.5%
5% region of rejection of null hypothesis
Non directional
Two Tail
body temperature, shoe sizes, diameters of trees,
Wt, height etc…
IQ
68%
95%
13.5%
13.5%
Normal Distribution:
half the scores above
mean…half below
(symmetrical)
Summary Statistics
describe data in just 2 numbers
Measures of central tendency
• typical average score
Measures of variability
• typical average variation
Measures of Central Tendency
• Quantitative data:
– Mode – the most frequently occurring
observation
– Median – the middle value in the data (50 50 )
– Mean – arithmetic average
• Qualitative data:
– Mode – always appropriate
– Mean – never appropriate
Mean
• The most common and most
useful average
• Mean = sum of all observations
number of all observations
• Observations can be added in
any order.
• Sample vs population
• Sample mean = X
• Population mean =m
• Summation sign =
• Sample size = n
• Population size = N
Notation

Special Property of the Mean
Balance Point
• The sum of all observations expressed as
positive and negative deviations from the
mean always equals zero!!!!
– The mean is the single point of equilibrium
(balance) in a data set
• The mean is affected by all values in the data
set
– If you change a single value, the mean changes.
The mean is the single point of equilibrium (balance) in a data set
SEE FOR YOURSELF!!! Lets do the Math
Summary Statistics
describe data in just 2 numbers
Measures of central tendency
• typical average score
Measures of variability
• typical average variation
1. range: distance from the
lowest to the highest (use 2
data points)
2. Variance: (use all data points)
3. Standard Deviation
4. Standard Error of the Mean
Descriptive & Inferential Statistics
Descriptive Statistics
• Organize
• Summarize
• Simplify
• Presentation of data
Inferential Statistics
• Generalize from
samples to pops
• Hypothesis testing
• Relationships
among variables
Describing data Make predictions
Measures of Variability
2. Variance: (use all data points):
average of the distance that each score is from
the mean (Squared deviation from the mean)
Notation for variance
s2
3. Standard Deviation= SD= s2
4. Standard Error of the mean = SEM = SD/ n
Inferential Statistics
Population
Sample
Draw inferences about the
larger group
Sample
Sample
Sample
Sampling Error: variability among
samples due to chance vs population
Or true differences? Are just due to
sampling error?
Probability…..
Error…misleading…not a mistake
Probability
• Numerical indication of how likely it is that a
given event will occur (General
Definition)“hum…what’s the probability it will rain?”
• Statistical probability:
the odds that what we observed in the sample did
not occur because of error (random and/or
systematic)“hum…what’s the probability that my results
are not just due to chance”
• In other words, the probability associated with
a statistic is the level of confidence we have that
the sample group that we measured actually
represents the total population
data
Are our inferences valid?…Best we can do is to calculate probability
about inferences
Inferential Statistics: uses sample data
to evaluate the credibility of a hypothesis
about a population
NULL Hypothesis:
NULL (nullus - latin): “not any”  no
differences between means
H0 : m1 = m2
“H- Naught”Always testing the null hypothesis
Inferential statistics: uses sample data to
evaluate the credibility of a hypothesis
about a population
Hypothesis: Scientific or alternative
hypothesis
Predicts that there are differences
between the groups
H1 : m1 = m2
Hypothesis
A statement about what findings are expected
null hypothesis
"the two groups will not differ“
alternative hypothesis
"group A will do better than group B"
"group A and B will not perform the same"
Inferential Statistics
When making comparisons
btw 2 sample means there are 2
possibilities
Null hypothesis is true
Null hypothesis is false
Not reject the Null Hypothesis
Reject the Null hypothesis
Possible Outcomes in
Hypothesis Testing (Decision)
Null is True Null is False
Accept
Reject
Correct
Decision
Correct
Decision
Error
Error
Type I Error
Type II Error
Type I Error: Rejecting a True Hypothesis
Type II Error: Accepting a False Hypothesis
Hypothesis Testing - Decision
Decision Right or Wrong?
But we can know the probability of being right
or wrong
Can specify and control the probability of
making TYPE I of TYPE II Error
Try to keep it small…
ALPHA
the probability of making a type I error  depends on the
criterion you use to accept or reject the null hypothesis =
significance level (smaller you make alpha, the less likely
you are to commit error) 0.05 (5 chances in 100 that the
difference observed was really due to sampling error – 5%
of the time a type I error will occur)
Possible Outcomes in
Hypothesis Testing
Null is True Null is False
Accept
Reject
Correct
Decision
Correct
Decision
Error
Error
Type I Error
Type II Error
Alpha (a)
Difference observed is really
just sampling error
The prob. of type one error
When we do statistical analysis… if alpha
(p value- significance level) greater than 0.05
WE ACCEPT THE NULL HYPOTHESIS
is equal to or less that 0.05 we
REJECT THE NULL (difference btw means)
2.5% 2.5%
5% region of rejection of null hypothesis
Non directional
Two Tail
5%
5% region of rejection of null hypothesis
Directional
One Tail
BETA
Probability of making type II error  occurs when we fail
to reject the Null when we should have
Possible Outcomes in
Hypothesis Testing
Null is True Null is False
Accept
Reject
Correct
Decision
Correct
Decision
Error
Error
Type I Error
Type II Error
Beta (b)
Difference observed is real
Failed to reject the Null
POWER: ability to reduce type II error
(1-Beta) – Power Analysis
The power to find an effect if an effect is present
1. Increase our n
2. Decrease variability
3. More precise measurements
Effect Size: measure of the size of the difference
between means attributed to the treatment
Inferential statistics
Significance testing:
Practical vs statistical significance
Inferential statistics
Used for Testing for Mean Differences
T-test: when experiments include only 2 groups
a. Independent
b. Correlated
i. Within-subjects
ii. Matched
Based on the t statistic (critical values) based on
df & alpha level
Inferential statistics
Used for Testing for Mean Differences
Analysis of Variance (ANOVA): used when
comparing more than 2 groups
1. Between Subjects
2. Within Subjects – repeated measures
Based on the f statistic (critical values) based on
df & alpha level
More than one IV = factorial (iv=factors)
Only one IV=one-way anova
Inferential statistics
Meta-Analysis:
Allows for statistical averaging of results
From independent studies of the same
phenomenon

More Related Content

What's hot

MEASURES OF CENTRAL TENDENCY AND MEASURES OF DISPERSION
MEASURES OF CENTRAL TENDENCY AND  MEASURES OF DISPERSION MEASURES OF CENTRAL TENDENCY AND  MEASURES OF DISPERSION
MEASURES OF CENTRAL TENDENCY AND MEASURES OF DISPERSION Tanya Singla
 
introduction to biostat, standard deviation and variance
introduction to biostat, standard deviation and varianceintroduction to biostat, standard deviation and variance
introduction to biostat, standard deviation and varianceamol askar
 
Descriptive Analysis in Statistics
Descriptive Analysis in StatisticsDescriptive Analysis in Statistics
Descriptive Analysis in StatisticsAzmi Mohd Tamil
 
Measures of Central Tendency and Dispersion
Measures of Central Tendency and DispersionMeasures of Central Tendency and Dispersion
Measures of Central Tendency and DispersionPharmacy Universe
 
Measures of dispersion
Measures of dispersionMeasures of dispersion
Measures of dispersionSanoj Fernando
 
QT1 - 03 - Measures of Central Tendency
QT1 - 03 - Measures of Central TendencyQT1 - 03 - Measures of Central Tendency
QT1 - 03 - Measures of Central TendencyPrithwis Mukerjee
 
Descriptive statistics
Descriptive statisticsDescriptive statistics
Descriptive statisticsBurak Mızrak
 
Mba i qt unit-2.1_measures of variations
Mba i qt unit-2.1_measures of variationsMba i qt unit-2.1_measures of variations
Mba i qt unit-2.1_measures of variationsRai University
 
Numerical measures stat ppt @ bec doms
Numerical measures stat ppt @ bec domsNumerical measures stat ppt @ bec doms
Numerical measures stat ppt @ bec domsBabasab Patil
 
Measure of dispersion part II ( Standard Deviation, variance, coefficient of ...
Measure of dispersion part II ( Standard Deviation, variance, coefficient of ...Measure of dispersion part II ( Standard Deviation, variance, coefficient of ...
Measure of dispersion part II ( Standard Deviation, variance, coefficient of ...Shakehand with Life
 
descriptive data analysis
 descriptive data analysis descriptive data analysis
descriptive data analysisgnanasarita1
 
Measures of central tendency dispersion
Measures of central tendency dispersionMeasures of central tendency dispersion
Measures of central tendency dispersionAbhinav yadav
 
Stat3 central tendency & dispersion
Stat3 central tendency & dispersionStat3 central tendency & dispersion
Stat3 central tendency & dispersionForensic Pathology
 
Descriptive statistics
Descriptive statisticsDescriptive statistics
Descriptive statisticsAbhinav yadav
 
Frequency Measures for Healthcare Professioanls
Frequency Measures for Healthcare ProfessioanlsFrequency Measures for Healthcare Professioanls
Frequency Measures for Healthcare Professioanlsalberpaules
 

What's hot (20)

MEASURES OF CENTRAL TENDENCY AND MEASURES OF DISPERSION
MEASURES OF CENTRAL TENDENCY AND  MEASURES OF DISPERSION MEASURES OF CENTRAL TENDENCY AND  MEASURES OF DISPERSION
MEASURES OF CENTRAL TENDENCY AND MEASURES OF DISPERSION
 
introduction to biostat, standard deviation and variance
introduction to biostat, standard deviation and varianceintroduction to biostat, standard deviation and variance
introduction to biostat, standard deviation and variance
 
Measures of Dispersion (Variability)
Measures of Dispersion (Variability)Measures of Dispersion (Variability)
Measures of Dispersion (Variability)
 
Central tendency and Measure of Dispersion
Central tendency and Measure of DispersionCentral tendency and Measure of Dispersion
Central tendency and Measure of Dispersion
 
Descriptive Analysis in Statistics
Descriptive Analysis in StatisticsDescriptive Analysis in Statistics
Descriptive Analysis in Statistics
 
Measures of Central Tendency and Dispersion
Measures of Central Tendency and DispersionMeasures of Central Tendency and Dispersion
Measures of Central Tendency and Dispersion
 
Measures of dispersion
Measures of dispersionMeasures of dispersion
Measures of dispersion
 
3.1 Measures of center
3.1 Measures of center3.1 Measures of center
3.1 Measures of center
 
QT1 - 03 - Measures of Central Tendency
QT1 - 03 - Measures of Central TendencyQT1 - 03 - Measures of Central Tendency
QT1 - 03 - Measures of Central Tendency
 
Descriptive statistics
Descriptive statisticsDescriptive statistics
Descriptive statistics
 
Mba i qt unit-2.1_measures of variations
Mba i qt unit-2.1_measures of variationsMba i qt unit-2.1_measures of variations
Mba i qt unit-2.1_measures of variations
 
Numerical measures stat ppt @ bec doms
Numerical measures stat ppt @ bec domsNumerical measures stat ppt @ bec doms
Numerical measures stat ppt @ bec doms
 
Measure of dispersion part II ( Standard Deviation, variance, coefficient of ...
Measure of dispersion part II ( Standard Deviation, variance, coefficient of ...Measure of dispersion part II ( Standard Deviation, variance, coefficient of ...
Measure of dispersion part II ( Standard Deviation, variance, coefficient of ...
 
descriptive data analysis
 descriptive data analysis descriptive data analysis
descriptive data analysis
 
Measures of central tendency dispersion
Measures of central tendency dispersionMeasures of central tendency dispersion
Measures of central tendency dispersion
 
Measure of Dispersion in statistics
Measure of Dispersion in statisticsMeasure of Dispersion in statistics
Measure of Dispersion in statistics
 
Stat3 central tendency & dispersion
Stat3 central tendency & dispersionStat3 central tendency & dispersion
Stat3 central tendency & dispersion
 
Descriptive statistics
Descriptive statisticsDescriptive statistics
Descriptive statistics
 
Measures of central tendency and dispersion
Measures of central tendency and dispersionMeasures of central tendency and dispersion
Measures of central tendency and dispersion
 
Frequency Measures for Healthcare Professioanls
Frequency Measures for Healthcare ProfessioanlsFrequency Measures for Healthcare Professioanls
Frequency Measures for Healthcare Professioanls
 

Similar to Ds vs Is discuss 3.1 (20)

Inferential Statistics
Inferential StatisticsInferential Statistics
Inferential Statistics
 
Review & Hypothesis Testing
Review & Hypothesis TestingReview & Hypothesis Testing
Review & Hypothesis Testing
 
Basic statistics
Basic statisticsBasic statistics
Basic statistics
 
Introductory Statistics
Introductory StatisticsIntroductory Statistics
Introductory Statistics
 
312320.pptx
312320.pptx312320.pptx
312320.pptx
 
ders 5 hypothesis testing.pptx
ders 5 hypothesis testing.pptxders 5 hypothesis testing.pptx
ders 5 hypothesis testing.pptx
 
statistics
statisticsstatistics
statistics
 
Epidemiology Chapter 5.pptx
Epidemiology Chapter 5.pptxEpidemiology Chapter 5.pptx
Epidemiology Chapter 5.pptx
 
T test
T test T test
T test
 
Stat topics
Stat topicsStat topics
Stat topics
 
Chapter_9.pptx
Chapter_9.pptxChapter_9.pptx
Chapter_9.pptx
 
1. complete stats notes
1. complete stats notes1. complete stats notes
1. complete stats notes
 
Parametric tests seminar
Parametric tests seminarParametric tests seminar
Parametric tests seminar
 
Inferential statistics hand out (2)
Inferential statistics hand out (2)Inferential statistics hand out (2)
Inferential statistics hand out (2)
 
Freq distribution
Freq distributionFreq distribution
Freq distribution
 
Soni_Biostatistics.ppt
Soni_Biostatistics.pptSoni_Biostatistics.ppt
Soni_Biostatistics.ppt
 
Hypothesis Testing
Hypothesis TestingHypothesis Testing
Hypothesis Testing
 
Test of significance in Statistics
Test of significance in StatisticsTest of significance in Statistics
Test of significance in Statistics
 
Basics of biostatistic
Basics of biostatisticBasics of biostatistic
Basics of biostatistic
 
Analyzing quantitative data
Analyzing quantitative dataAnalyzing quantitative data
Analyzing quantitative data
 

More from Makati Science High School

Types of graphs and charts and their uses with examples and pics
Types of graphs and charts and their uses  with examples and picsTypes of graphs and charts and their uses  with examples and pics
Types of graphs and charts and their uses with examples and picsMakati Science High School
 

More from Makati Science High School (20)

Writing a Scientific Paper
Writing a Scientific PaperWriting a Scientific Paper
Writing a Scientific Paper
 
Research Paper Rubrics 2020
Research Paper Rubrics 2020Research Paper Rubrics 2020
Research Paper Rubrics 2020
 
Statistical test discuss 5
Statistical test discuss 5Statistical test discuss 5
Statistical test discuss 5
 
Measures of variation discuss 2.1
Measures of variation discuss  2.1Measures of variation discuss  2.1
Measures of variation discuss 2.1
 
Materials and methods discuss
Materials and methods  discussMaterials and methods  discuss
Materials and methods discuss
 
Inferential stat tests samples discuss 4
Inferential stat tests samples discuss 4Inferential stat tests samples discuss 4
Inferential stat tests samples discuss 4
 
Descriptive inferential-discuss 1
Descriptive  inferential-discuss 1Descriptive  inferential-discuss 1
Descriptive inferential-discuss 1
 
Central tendency m,m,m 1.2
Central tendency m,m,m 1.2Central tendency m,m,m 1.2
Central tendency m,m,m 1.2
 
Central tendency discuss 2
Central tendency  discuss 2Central tendency  discuss 2
Central tendency discuss 2
 
Types of graphs and charts and their uses with examples and pics
Types of graphs and charts and their uses  with examples and picsTypes of graphs and charts and their uses  with examples and pics
Types of graphs and charts and their uses with examples and pics
 
Levels of measurement discuss
Levels of measurement   discussLevels of measurement   discuss
Levels of measurement discuss
 
Gantt chart discuss 3
Gantt chart discuss 3Gantt chart discuss 3
Gantt chart discuss 3
 
Gantt chart discuss 2
Gantt chart discuss 2Gantt chart discuss 2
Gantt chart discuss 2
 
Gantt chart discuss 1
Gantt chart discuss 1Gantt chart discuss 1
Gantt chart discuss 1
 
Research Designs -9 experimental Designs
Research Designs -9 experimental DesignsResearch Designs -9 experimental Designs
Research Designs -9 experimental Designs
 
Research designs Pt 1
Research designs Pt 1Research designs Pt 1
Research designs Pt 1
 
Identifying variables
Identifying variablesIdentifying variables
Identifying variables
 
Kinds and classifications of research
Kinds and classifications of researchKinds and classifications of research
Kinds and classifications of research
 
Research Ethical Issues
Research Ethical IssuesResearch Ethical Issues
Research Ethical Issues
 
BSR I Course Outline 2019-2020
BSR I Course Outline 2019-2020BSR I Course Outline 2019-2020
BSR I Course Outline 2019-2020
 

Recently uploaded

Kisan Call Centre - To harness potential of ICT in Agriculture by answer farm...
Kisan Call Centre - To harness potential of ICT in Agriculture by answer farm...Kisan Call Centre - To harness potential of ICT in Agriculture by answer farm...
Kisan Call Centre - To harness potential of ICT in Agriculture by answer farm...Krashi Coaching
 
CARE OF CHILD IN INCUBATOR..........pptx
CARE OF CHILD IN INCUBATOR..........pptxCARE OF CHILD IN INCUBATOR..........pptx
CARE OF CHILD IN INCUBATOR..........pptxGaneshChakor2
 
Organic Name Reactions for the students and aspirants of Chemistry12th.pptx
Organic Name Reactions  for the students and aspirants of Chemistry12th.pptxOrganic Name Reactions  for the students and aspirants of Chemistry12th.pptx
Organic Name Reactions for the students and aspirants of Chemistry12th.pptxVS Mahajan Coaching Centre
 
URLs and Routing in the Odoo 17 Website App
URLs and Routing in the Odoo 17 Website AppURLs and Routing in the Odoo 17 Website App
URLs and Routing in the Odoo 17 Website AppCeline George
 
POINT- BIOCHEMISTRY SEM 2 ENZYMES UNIT 5.pptx
POINT- BIOCHEMISTRY SEM 2 ENZYMES UNIT 5.pptxPOINT- BIOCHEMISTRY SEM 2 ENZYMES UNIT 5.pptx
POINT- BIOCHEMISTRY SEM 2 ENZYMES UNIT 5.pptxSayali Powar
 
Grant Readiness 101 TechSoup and Remy Consulting
Grant Readiness 101 TechSoup and Remy ConsultingGrant Readiness 101 TechSoup and Remy Consulting
Grant Readiness 101 TechSoup and Remy ConsultingTechSoup
 
18-04-UA_REPORT_MEDIALITERAСY_INDEX-DM_23-1-final-eng.pdf
18-04-UA_REPORT_MEDIALITERAСY_INDEX-DM_23-1-final-eng.pdf18-04-UA_REPORT_MEDIALITERAСY_INDEX-DM_23-1-final-eng.pdf
18-04-UA_REPORT_MEDIALITERAСY_INDEX-DM_23-1-final-eng.pdfssuser54595a
 
Accessible design: Minimum effort, maximum impact
Accessible design: Minimum effort, maximum impactAccessible design: Minimum effort, maximum impact
Accessible design: Minimum effort, maximum impactdawncurless
 
BASLIQ CURRENT LOOKBOOK LOOKBOOK(1) (1).pdf
BASLIQ CURRENT LOOKBOOK  LOOKBOOK(1) (1).pdfBASLIQ CURRENT LOOKBOOK  LOOKBOOK(1) (1).pdf
BASLIQ CURRENT LOOKBOOK LOOKBOOK(1) (1).pdfSoniaTolstoy
 
Employee wellbeing at the workplace.pptx
Employee wellbeing at the workplace.pptxEmployee wellbeing at the workplace.pptx
Employee wellbeing at the workplace.pptxNirmalaLoungPoorunde1
 
Concept of Vouching. B.Com(Hons) /B.Compdf
Concept of Vouching. B.Com(Hons) /B.CompdfConcept of Vouching. B.Com(Hons) /B.Compdf
Concept of Vouching. B.Com(Hons) /B.CompdfUmakantAnnand
 
Contemporary philippine arts from the regions_PPT_Module_12 [Autosaved] (1).pptx
Contemporary philippine arts from the regions_PPT_Module_12 [Autosaved] (1).pptxContemporary philippine arts from the regions_PPT_Module_12 [Autosaved] (1).pptx
Contemporary philippine arts from the regions_PPT_Module_12 [Autosaved] (1).pptxRoyAbrique
 
_Math 4-Q4 Week 5.pptx Steps in Collecting Data
_Math 4-Q4 Week 5.pptx Steps in Collecting Data_Math 4-Q4 Week 5.pptx Steps in Collecting Data
_Math 4-Q4 Week 5.pptx Steps in Collecting DataJhengPantaleon
 
Solving Puzzles Benefits Everyone (English).pptx
Solving Puzzles Benefits Everyone (English).pptxSolving Puzzles Benefits Everyone (English).pptx
Solving Puzzles Benefits Everyone (English).pptxOH TEIK BIN
 
Mastering the Unannounced Regulatory Inspection
Mastering the Unannounced Regulatory InspectionMastering the Unannounced Regulatory Inspection
Mastering the Unannounced Regulatory InspectionSafetyChain Software
 
microwave assisted reaction. General introduction
microwave assisted reaction. General introductionmicrowave assisted reaction. General introduction
microwave assisted reaction. General introductionMaksud Ahmed
 
“Oh GOSH! Reflecting on Hackteria's Collaborative Practices in a Global Do-It...
“Oh GOSH! Reflecting on Hackteria's Collaborative Practices in a Global Do-It...“Oh GOSH! Reflecting on Hackteria's Collaborative Practices in a Global Do-It...
“Oh GOSH! Reflecting on Hackteria's Collaborative Practices in a Global Do-It...Marc Dusseiller Dusjagr
 
Micromeritics - Fundamental and Derived Properties of Powders
Micromeritics - Fundamental and Derived Properties of PowdersMicromeritics - Fundamental and Derived Properties of Powders
Micromeritics - Fundamental and Derived Properties of PowdersChitralekhaTherkar
 
Incoming and Outgoing Shipments in 1 STEP Using Odoo 17
Incoming and Outgoing Shipments in 1 STEP Using Odoo 17Incoming and Outgoing Shipments in 1 STEP Using Odoo 17
Incoming and Outgoing Shipments in 1 STEP Using Odoo 17Celine George
 

Recently uploaded (20)

Kisan Call Centre - To harness potential of ICT in Agriculture by answer farm...
Kisan Call Centre - To harness potential of ICT in Agriculture by answer farm...Kisan Call Centre - To harness potential of ICT in Agriculture by answer farm...
Kisan Call Centre - To harness potential of ICT in Agriculture by answer farm...
 
CARE OF CHILD IN INCUBATOR..........pptx
CARE OF CHILD IN INCUBATOR..........pptxCARE OF CHILD IN INCUBATOR..........pptx
CARE OF CHILD IN INCUBATOR..........pptx
 
Organic Name Reactions for the students and aspirants of Chemistry12th.pptx
Organic Name Reactions  for the students and aspirants of Chemistry12th.pptxOrganic Name Reactions  for the students and aspirants of Chemistry12th.pptx
Organic Name Reactions for the students and aspirants of Chemistry12th.pptx
 
URLs and Routing in the Odoo 17 Website App
URLs and Routing in the Odoo 17 Website AppURLs and Routing in the Odoo 17 Website App
URLs and Routing in the Odoo 17 Website App
 
POINT- BIOCHEMISTRY SEM 2 ENZYMES UNIT 5.pptx
POINT- BIOCHEMISTRY SEM 2 ENZYMES UNIT 5.pptxPOINT- BIOCHEMISTRY SEM 2 ENZYMES UNIT 5.pptx
POINT- BIOCHEMISTRY SEM 2 ENZYMES UNIT 5.pptx
 
Grant Readiness 101 TechSoup and Remy Consulting
Grant Readiness 101 TechSoup and Remy ConsultingGrant Readiness 101 TechSoup and Remy Consulting
Grant Readiness 101 TechSoup and Remy Consulting
 
18-04-UA_REPORT_MEDIALITERAСY_INDEX-DM_23-1-final-eng.pdf
18-04-UA_REPORT_MEDIALITERAСY_INDEX-DM_23-1-final-eng.pdf18-04-UA_REPORT_MEDIALITERAСY_INDEX-DM_23-1-final-eng.pdf
18-04-UA_REPORT_MEDIALITERAСY_INDEX-DM_23-1-final-eng.pdf
 
Accessible design: Minimum effort, maximum impact
Accessible design: Minimum effort, maximum impactAccessible design: Minimum effort, maximum impact
Accessible design: Minimum effort, maximum impact
 
BASLIQ CURRENT LOOKBOOK LOOKBOOK(1) (1).pdf
BASLIQ CURRENT LOOKBOOK  LOOKBOOK(1) (1).pdfBASLIQ CURRENT LOOKBOOK  LOOKBOOK(1) (1).pdf
BASLIQ CURRENT LOOKBOOK LOOKBOOK(1) (1).pdf
 
Employee wellbeing at the workplace.pptx
Employee wellbeing at the workplace.pptxEmployee wellbeing at the workplace.pptx
Employee wellbeing at the workplace.pptx
 
Concept of Vouching. B.Com(Hons) /B.Compdf
Concept of Vouching. B.Com(Hons) /B.CompdfConcept of Vouching. B.Com(Hons) /B.Compdf
Concept of Vouching. B.Com(Hons) /B.Compdf
 
Contemporary philippine arts from the regions_PPT_Module_12 [Autosaved] (1).pptx
Contemporary philippine arts from the regions_PPT_Module_12 [Autosaved] (1).pptxContemporary philippine arts from the regions_PPT_Module_12 [Autosaved] (1).pptx
Contemporary philippine arts from the regions_PPT_Module_12 [Autosaved] (1).pptx
 
_Math 4-Q4 Week 5.pptx Steps in Collecting Data
_Math 4-Q4 Week 5.pptx Steps in Collecting Data_Math 4-Q4 Week 5.pptx Steps in Collecting Data
_Math 4-Q4 Week 5.pptx Steps in Collecting Data
 
Solving Puzzles Benefits Everyone (English).pptx
Solving Puzzles Benefits Everyone (English).pptxSolving Puzzles Benefits Everyone (English).pptx
Solving Puzzles Benefits Everyone (English).pptx
 
Mastering the Unannounced Regulatory Inspection
Mastering the Unannounced Regulatory InspectionMastering the Unannounced Regulatory Inspection
Mastering the Unannounced Regulatory Inspection
 
microwave assisted reaction. General introduction
microwave assisted reaction. General introductionmicrowave assisted reaction. General introduction
microwave assisted reaction. General introduction
 
“Oh GOSH! Reflecting on Hackteria's Collaborative Practices in a Global Do-It...
“Oh GOSH! Reflecting on Hackteria's Collaborative Practices in a Global Do-It...“Oh GOSH! Reflecting on Hackteria's Collaborative Practices in a Global Do-It...
“Oh GOSH! Reflecting on Hackteria's Collaborative Practices in a Global Do-It...
 
Micromeritics - Fundamental and Derived Properties of Powders
Micromeritics - Fundamental and Derived Properties of PowdersMicromeritics - Fundamental and Derived Properties of Powders
Micromeritics - Fundamental and Derived Properties of Powders
 
Incoming and Outgoing Shipments in 1 STEP Using Odoo 17
Incoming and Outgoing Shipments in 1 STEP Using Odoo 17Incoming and Outgoing Shipments in 1 STEP Using Odoo 17
Incoming and Outgoing Shipments in 1 STEP Using Odoo 17
 
Staff of Color (SOC) Retention Efforts DDSD
Staff of Color (SOC) Retention Efforts DDSDStaff of Color (SOC) Retention Efforts DDSD
Staff of Color (SOC) Retention Efforts DDSD
 

Ds vs Is discuss 3.1

  • 1. Lecture 5: Chapter 5 Statistical Analysis of Data …yes the “S” word
  • 2. What is a Statistic???? Population Sample Sample Sample Sample Parameter: value that describes a population Statistic: a value that describes a sample PSYCH  always using samples!!!
  • 3. Descriptive & Inferential Statistics Descriptive Statistics • Organize • Summarize • Simplify • Presentation of data Inferential Statistics • Generalize from samples to pops • Hypothesis testing • Relationships among variables Describing data Make predictions
  • 4. Descriptive Statistics 3 Types 1. Frequency Distributions 3. Summary Stats 2. Graphical Representations # of Ss that fall in a particular category Describe data in just one number Graphs & Tables
  • 5. 1. Frequency Distributions # of Ss that fall in a particular category How many males and how many females are in our class? Frequency (%) ? ? ?/tot x 100 ?/tot x 100 -----% ------% total scale of measurement? nominal
  • 6. 1. Frequency Distributions # of Ss that fall in a particular category Categorize on the basis of more that one variable at same time CROSS-TABULATION Democrats Republican total 24 1 25 19 6 25 Total 43 7 50
  • 7. 1. Frequency Distributions How many brothers & sisters do you have? # of bros & sis Frequency 7 ? 6 ? 5 ? 4 ? 3 ? 2 ? 1 ? 0 ?
  • 8. 2. Graphical Representations Graphs & Tables Bar graph (ratio data - quantitative)
  • 9. Histogram of the categorical variables 2. Graphical Representations
  • 10. Polygon - Line Graph 2. Graphical Representations
  • 11. 2. Graphical Representations Graphs & Tables How many brothers & sisters do you have? Lets plot class data: HISTOGRAM # of bros & sis Frequency 7 ? 6 ? 5 ? 4 ? 3 ? 2 ? 1 ? 0 ?
  • 12. Altman, D. G et al. BMJ 1995;310:298 Central Limit Theorem: the larger the sample size, the closer a distribution will approximate the normal distribution or A distribution of scores taken at random from any distribution will tend to form a normal curve jagged smooth
  • 13. 2.5% 2.5% 5% region of rejection of null hypothesis Non directional Two Tail body temperature, shoe sizes, diameters of trees, Wt, height etc… IQ 68% 95% 13.5% 13.5% Normal Distribution: half the scores above mean…half below (symmetrical)
  • 14.
  • 15. Summary Statistics describe data in just 2 numbers Measures of central tendency • typical average score Measures of variability • typical average variation
  • 16. Measures of Central Tendency • Quantitative data: – Mode – the most frequently occurring observation – Median – the middle value in the data (50 50 ) – Mean – arithmetic average • Qualitative data: – Mode – always appropriate – Mean – never appropriate
  • 17. Mean • The most common and most useful average • Mean = sum of all observations number of all observations • Observations can be added in any order. • Sample vs population • Sample mean = X • Population mean =m • Summation sign = • Sample size = n • Population size = N Notation 
  • 18. Special Property of the Mean Balance Point • The sum of all observations expressed as positive and negative deviations from the mean always equals zero!!!! – The mean is the single point of equilibrium (balance) in a data set • The mean is affected by all values in the data set – If you change a single value, the mean changes.
  • 19. The mean is the single point of equilibrium (balance) in a data set SEE FOR YOURSELF!!! Lets do the Math
  • 20. Summary Statistics describe data in just 2 numbers Measures of central tendency • typical average score Measures of variability • typical average variation 1. range: distance from the lowest to the highest (use 2 data points) 2. Variance: (use all data points) 3. Standard Deviation 4. Standard Error of the Mean
  • 21. Descriptive & Inferential Statistics Descriptive Statistics • Organize • Summarize • Simplify • Presentation of data Inferential Statistics • Generalize from samples to pops • Hypothesis testing • Relationships among variables Describing data Make predictions
  • 22. Measures of Variability 2. Variance: (use all data points): average of the distance that each score is from the mean (Squared deviation from the mean) Notation for variance s2 3. Standard Deviation= SD= s2 4. Standard Error of the mean = SEM = SD/ n
  • 23. Inferential Statistics Population Sample Draw inferences about the larger group Sample Sample Sample
  • 24. Sampling Error: variability among samples due to chance vs population Or true differences? Are just due to sampling error? Probability….. Error…misleading…not a mistake
  • 25. Probability • Numerical indication of how likely it is that a given event will occur (General Definition)“hum…what’s the probability it will rain?” • Statistical probability: the odds that what we observed in the sample did not occur because of error (random and/or systematic)“hum…what’s the probability that my results are not just due to chance” • In other words, the probability associated with a statistic is the level of confidence we have that the sample group that we measured actually represents the total population
  • 26. data Are our inferences valid?…Best we can do is to calculate probability about inferences
  • 27. Inferential Statistics: uses sample data to evaluate the credibility of a hypothesis about a population NULL Hypothesis: NULL (nullus - latin): “not any”  no differences between means H0 : m1 = m2 “H- Naught”Always testing the null hypothesis
  • 28. Inferential statistics: uses sample data to evaluate the credibility of a hypothesis about a population Hypothesis: Scientific or alternative hypothesis Predicts that there are differences between the groups H1 : m1 = m2
  • 29. Hypothesis A statement about what findings are expected null hypothesis "the two groups will not differ“ alternative hypothesis "group A will do better than group B" "group A and B will not perform the same"
  • 30. Inferential Statistics When making comparisons btw 2 sample means there are 2 possibilities Null hypothesis is true Null hypothesis is false Not reject the Null Hypothesis Reject the Null hypothesis
  • 31. Possible Outcomes in Hypothesis Testing (Decision) Null is True Null is False Accept Reject Correct Decision Correct Decision Error Error Type I Error Type II Error Type I Error: Rejecting a True Hypothesis Type II Error: Accepting a False Hypothesis
  • 32. Hypothesis Testing - Decision Decision Right or Wrong? But we can know the probability of being right or wrong Can specify and control the probability of making TYPE I of TYPE II Error Try to keep it small…
  • 33. ALPHA the probability of making a type I error  depends on the criterion you use to accept or reject the null hypothesis = significance level (smaller you make alpha, the less likely you are to commit error) 0.05 (5 chances in 100 that the difference observed was really due to sampling error – 5% of the time a type I error will occur) Possible Outcomes in Hypothesis Testing Null is True Null is False Accept Reject Correct Decision Correct Decision Error Error Type I Error Type II Error Alpha (a) Difference observed is really just sampling error The prob. of type one error
  • 34. When we do statistical analysis… if alpha (p value- significance level) greater than 0.05 WE ACCEPT THE NULL HYPOTHESIS is equal to or less that 0.05 we REJECT THE NULL (difference btw means)
  • 35. 2.5% 2.5% 5% region of rejection of null hypothesis Non directional Two Tail
  • 36. 5% 5% region of rejection of null hypothesis Directional One Tail
  • 37. BETA Probability of making type II error  occurs when we fail to reject the Null when we should have Possible Outcomes in Hypothesis Testing Null is True Null is False Accept Reject Correct Decision Correct Decision Error Error Type I Error Type II Error Beta (b) Difference observed is real Failed to reject the Null POWER: ability to reduce type II error
  • 38. POWER: ability to reduce type II error (1-Beta) – Power Analysis The power to find an effect if an effect is present 1. Increase our n 2. Decrease variability 3. More precise measurements Effect Size: measure of the size of the difference between means attributed to the treatment
  • 40. Inferential statistics Used for Testing for Mean Differences T-test: when experiments include only 2 groups a. Independent b. Correlated i. Within-subjects ii. Matched Based on the t statistic (critical values) based on df & alpha level
  • 41. Inferential statistics Used for Testing for Mean Differences Analysis of Variance (ANOVA): used when comparing more than 2 groups 1. Between Subjects 2. Within Subjects – repeated measures Based on the f statistic (critical values) based on df & alpha level More than one IV = factorial (iv=factors) Only one IV=one-way anova
  • 42. Inferential statistics Meta-Analysis: Allows for statistical averaging of results From independent studies of the same phenomenon