Download to read offline

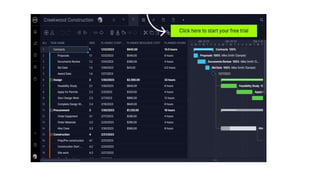
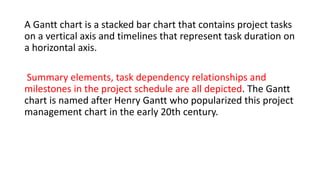
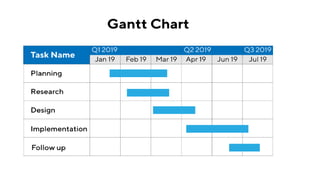
A Gantt chart is a bar chart that depicts project tasks, timelines, dependencies, and milestones. It displays the tasks, their durations, dependencies between tasks, and milestones. Named after Henry Gantt, the chart is used for project planning and scheduling by showing the start and finish dates of tasks, resources assigned, and tracking their progress over time.


![Reconstructive and cosmetic surgeries [Auto-saved].pptx](https://cdn.slidesharecdn.com/ss_thumbnails/reconstructiveandcosmeticsurgeriesauto-saved-230621074305-25a142e9-thumbnail.jpg?width=640&height=640&fit=bounds)


