Download to read offline
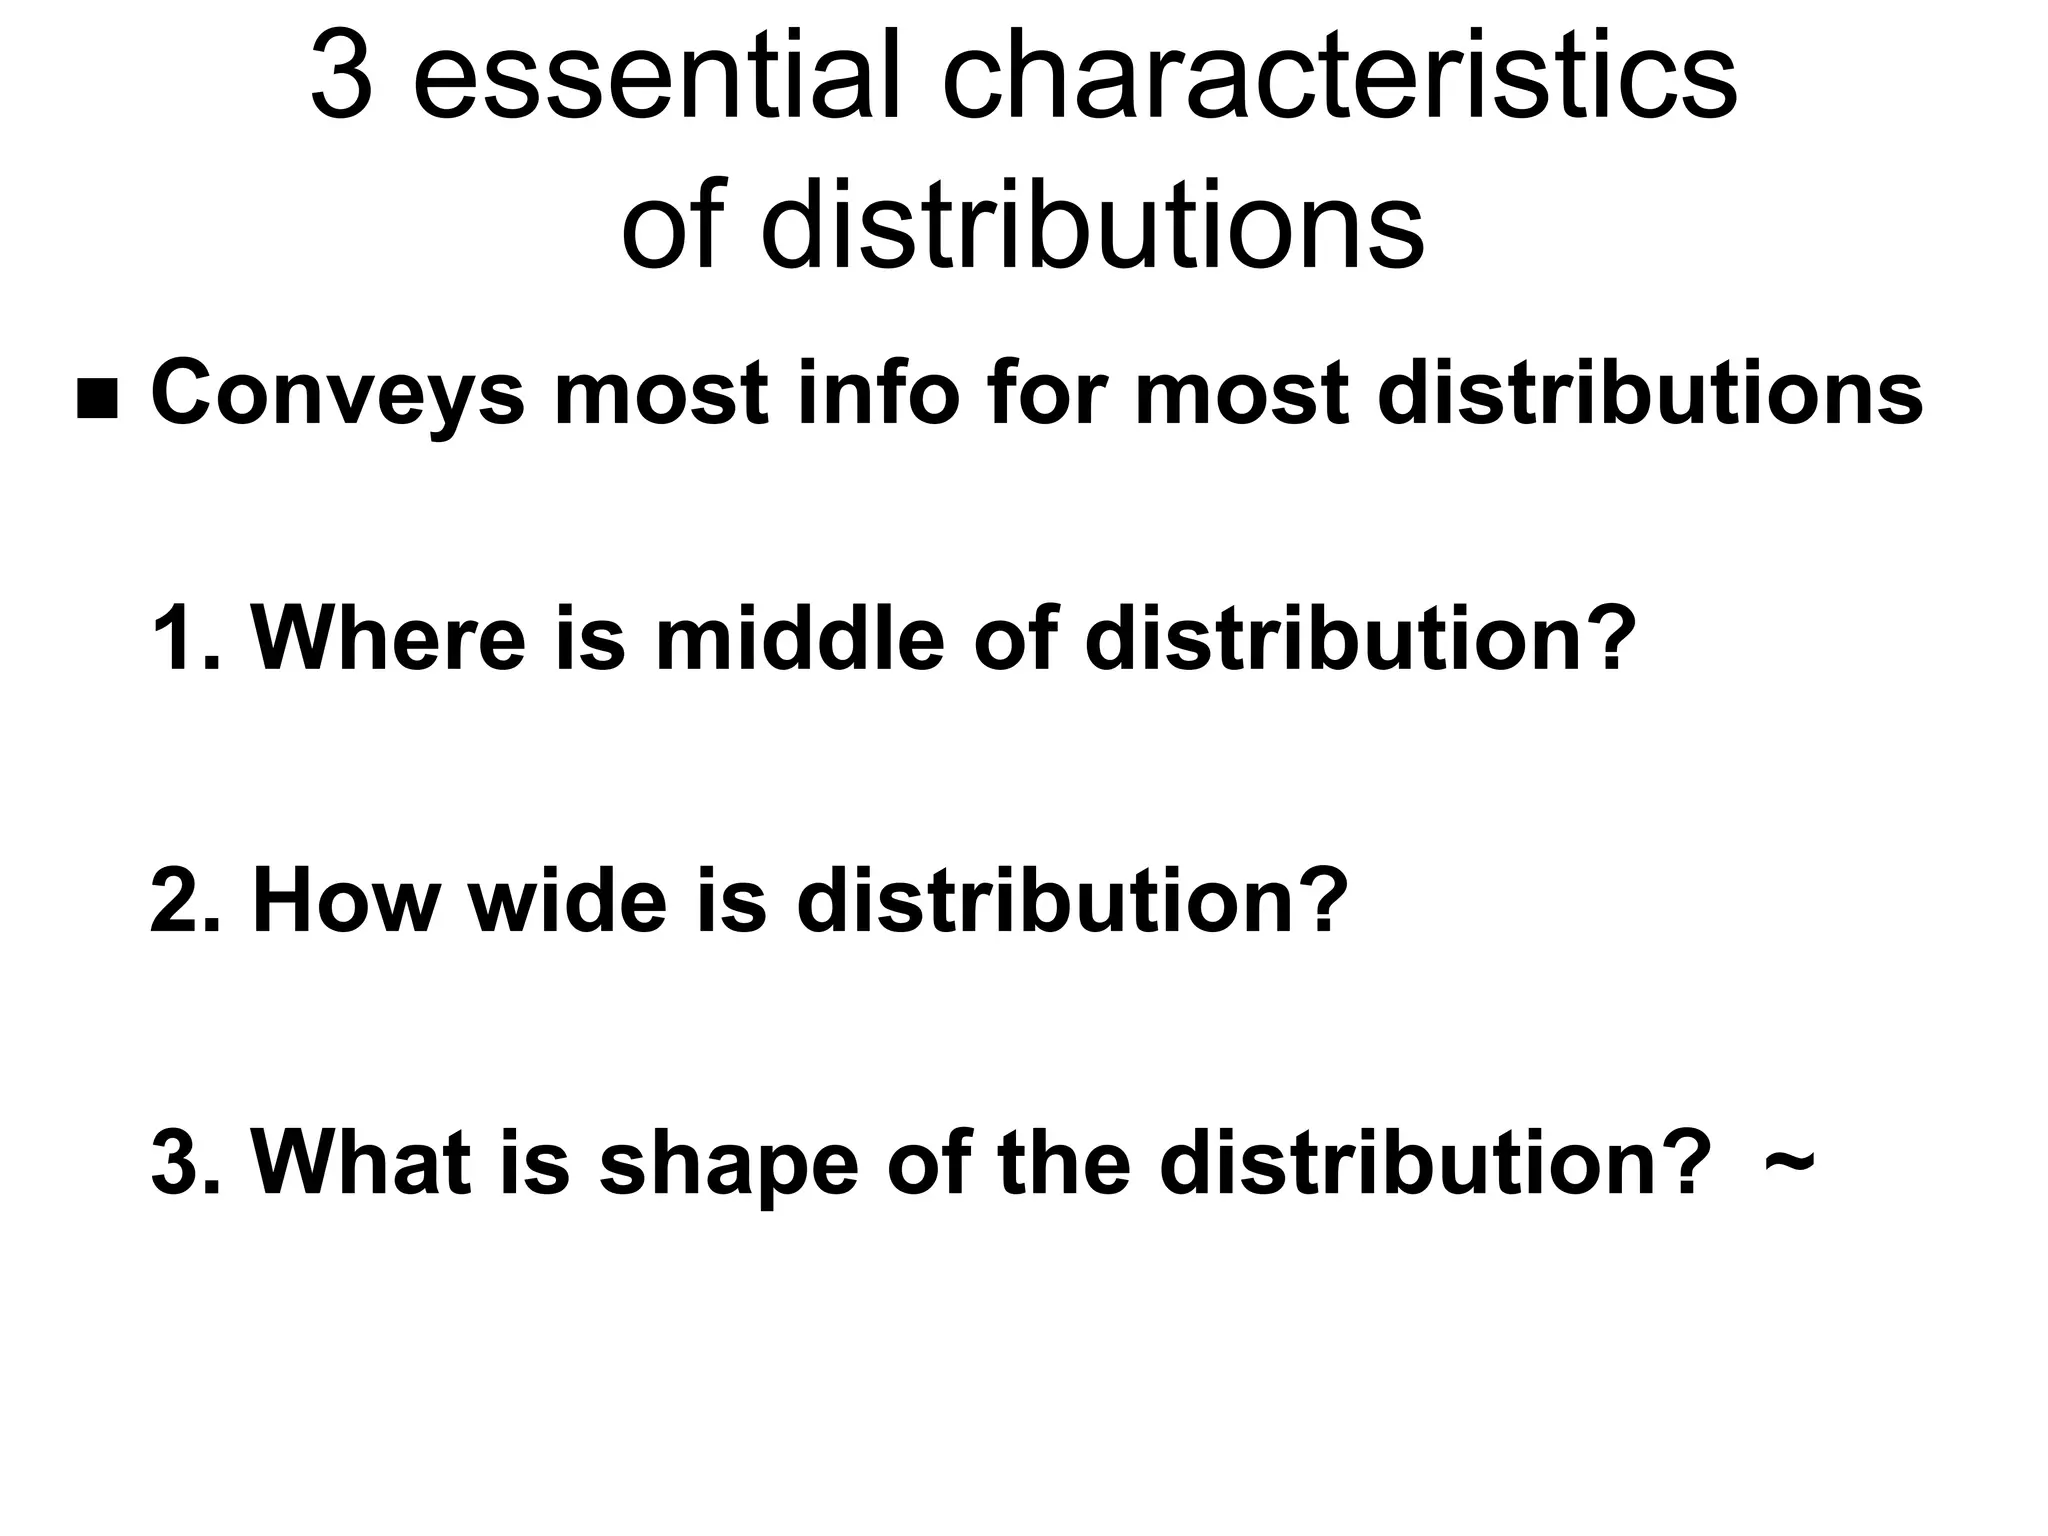
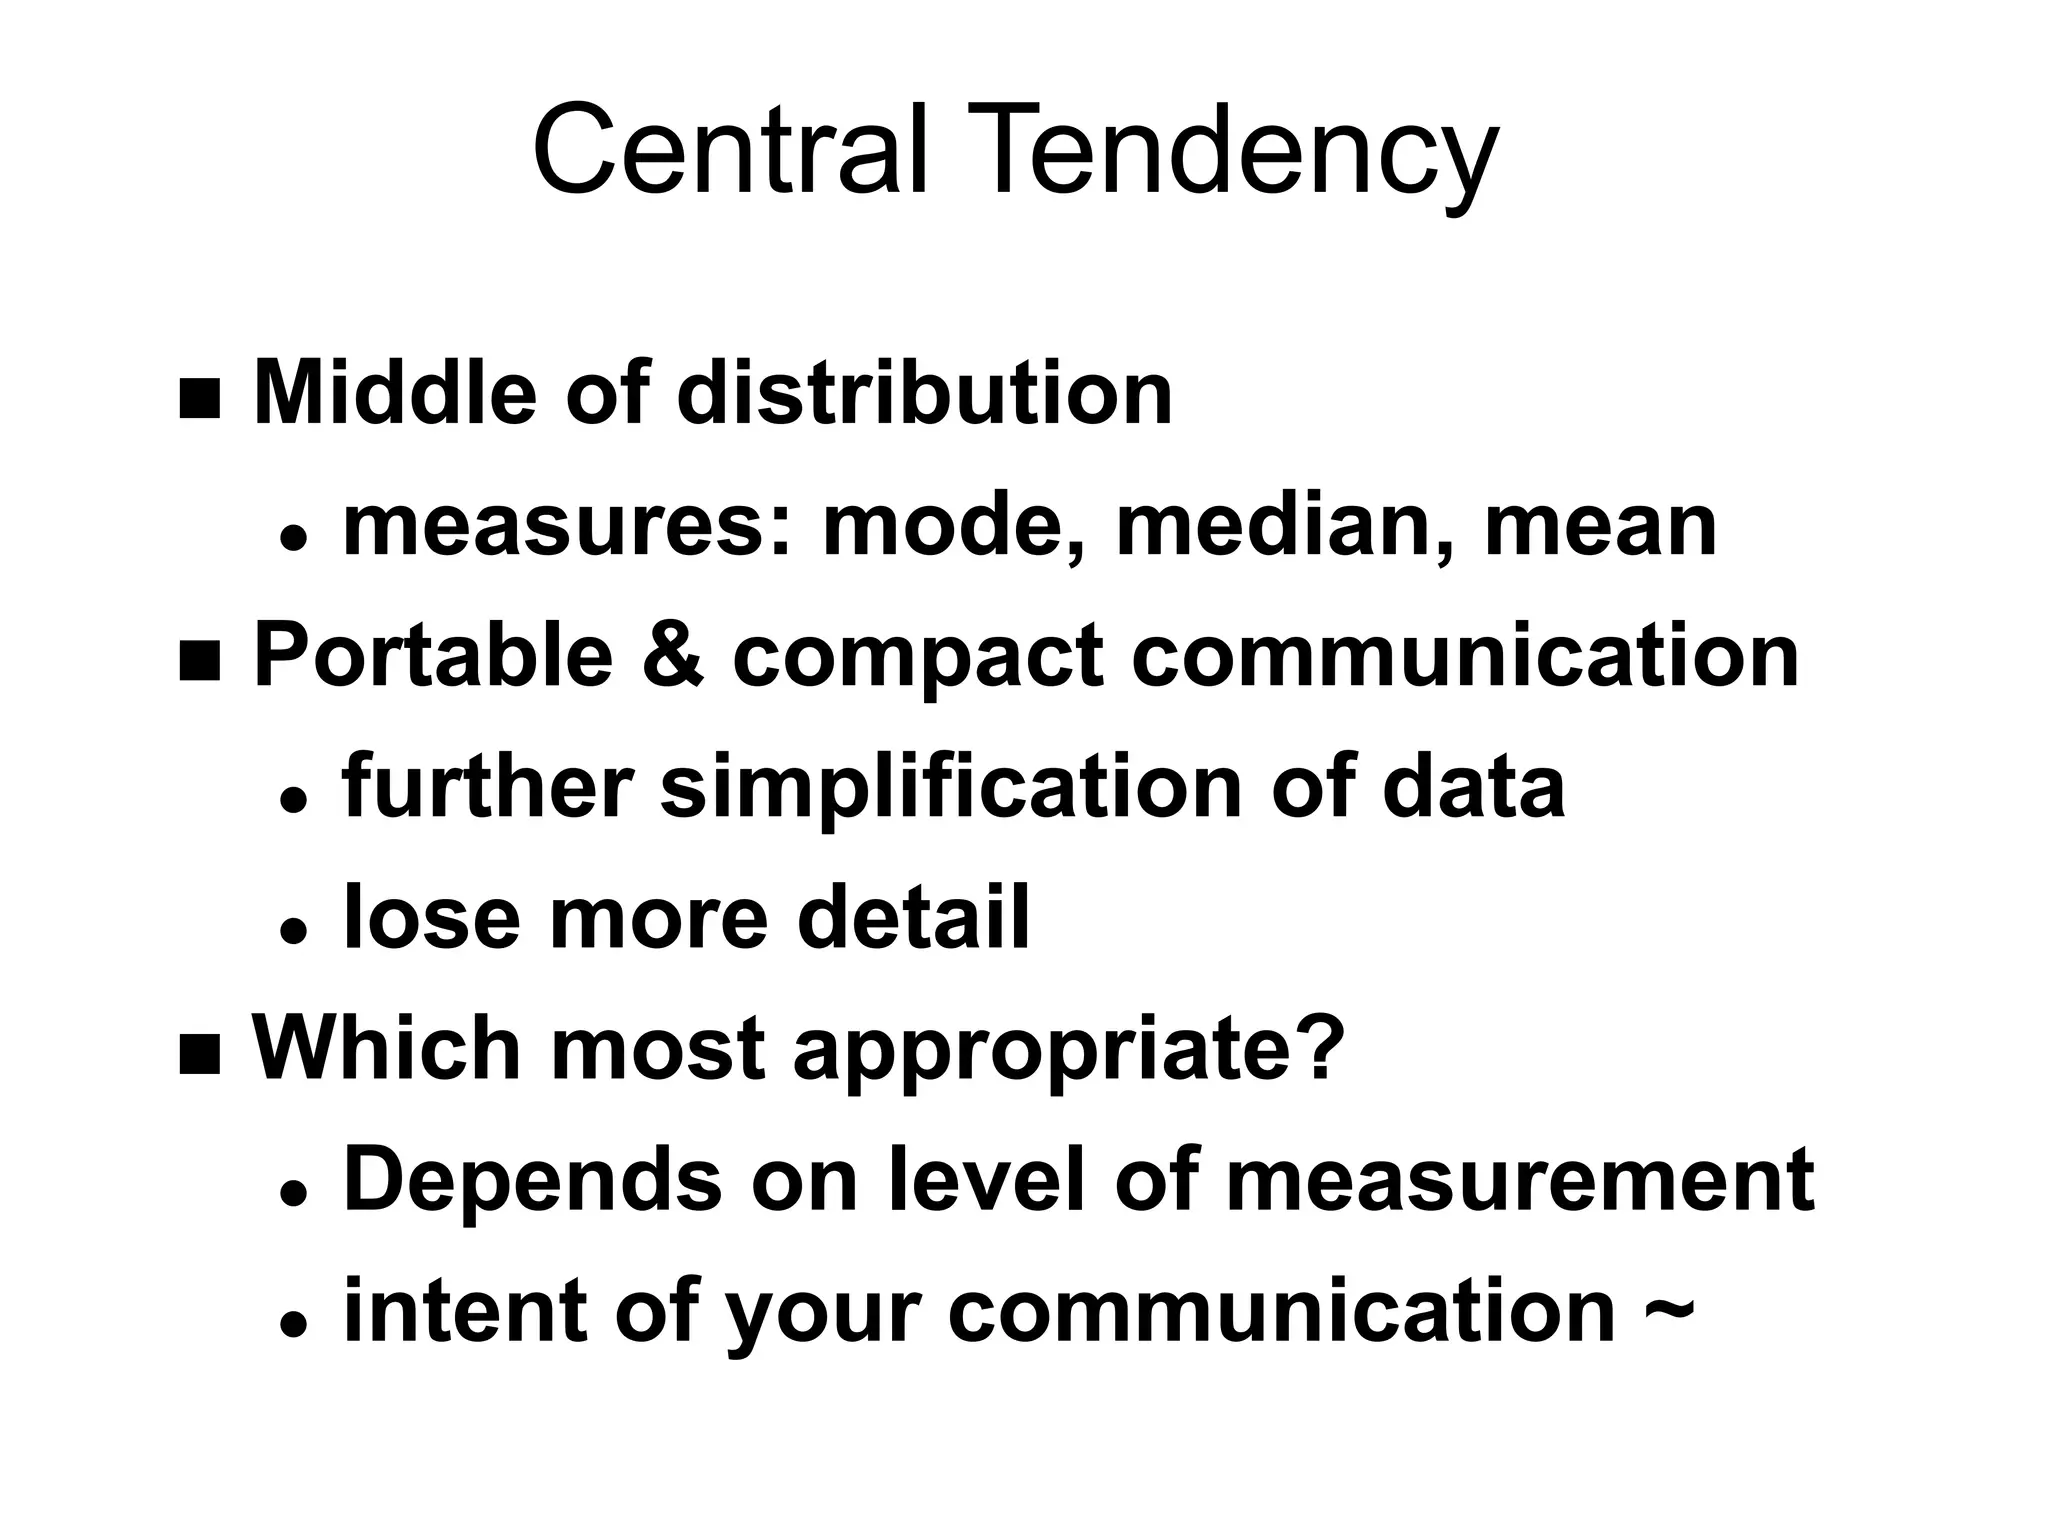
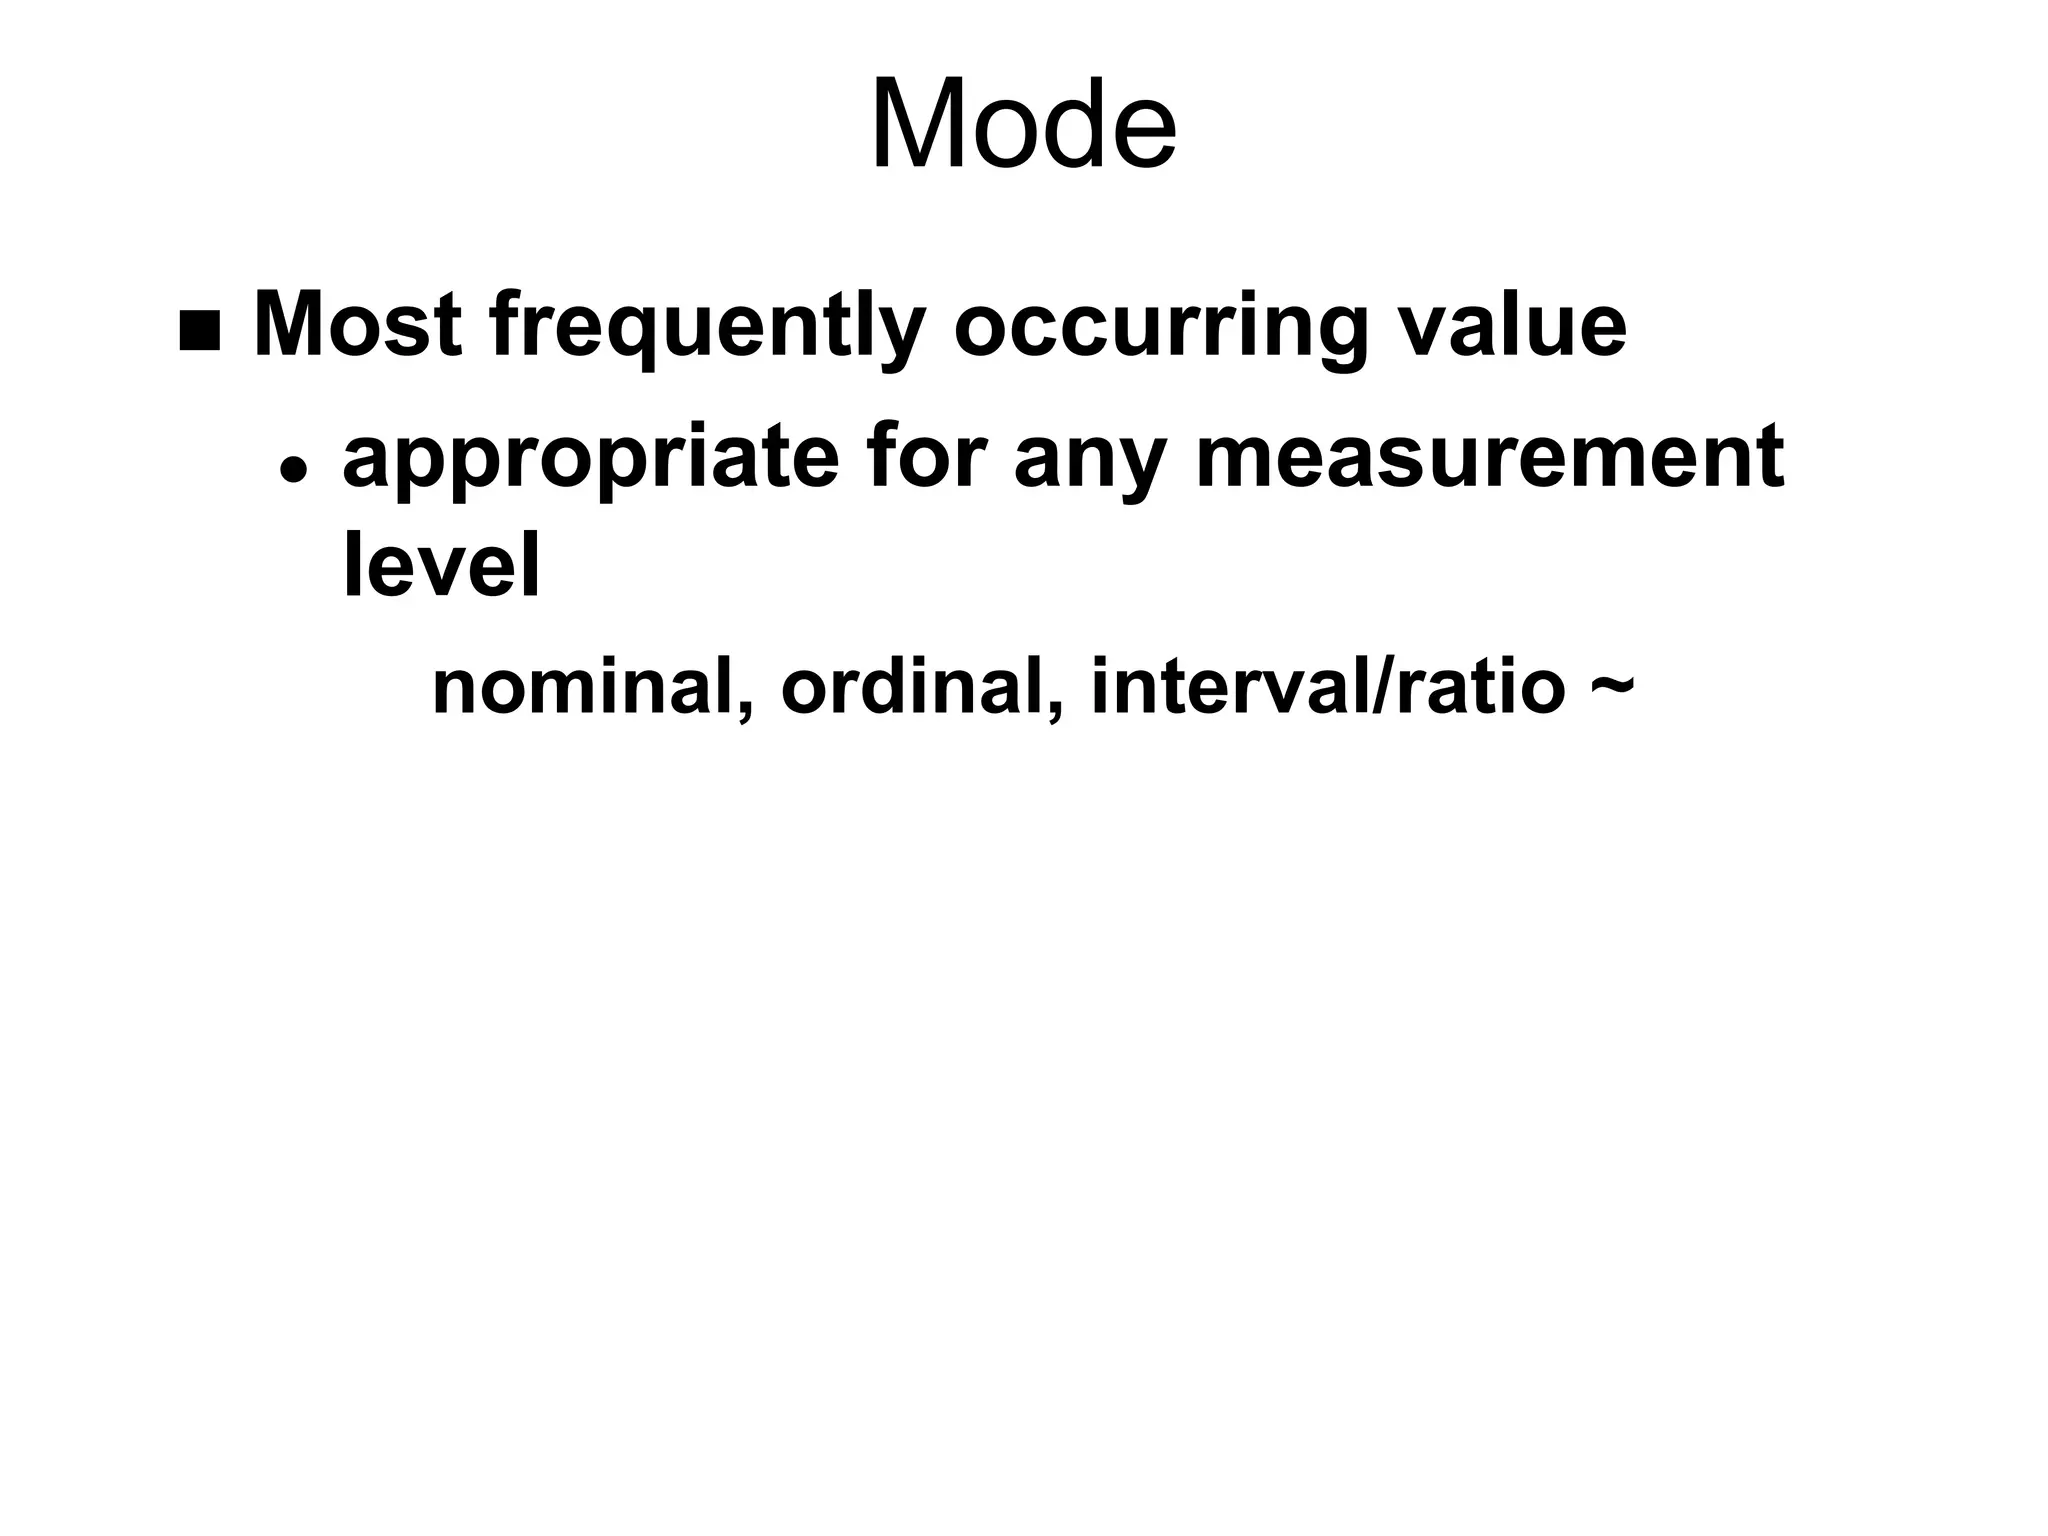
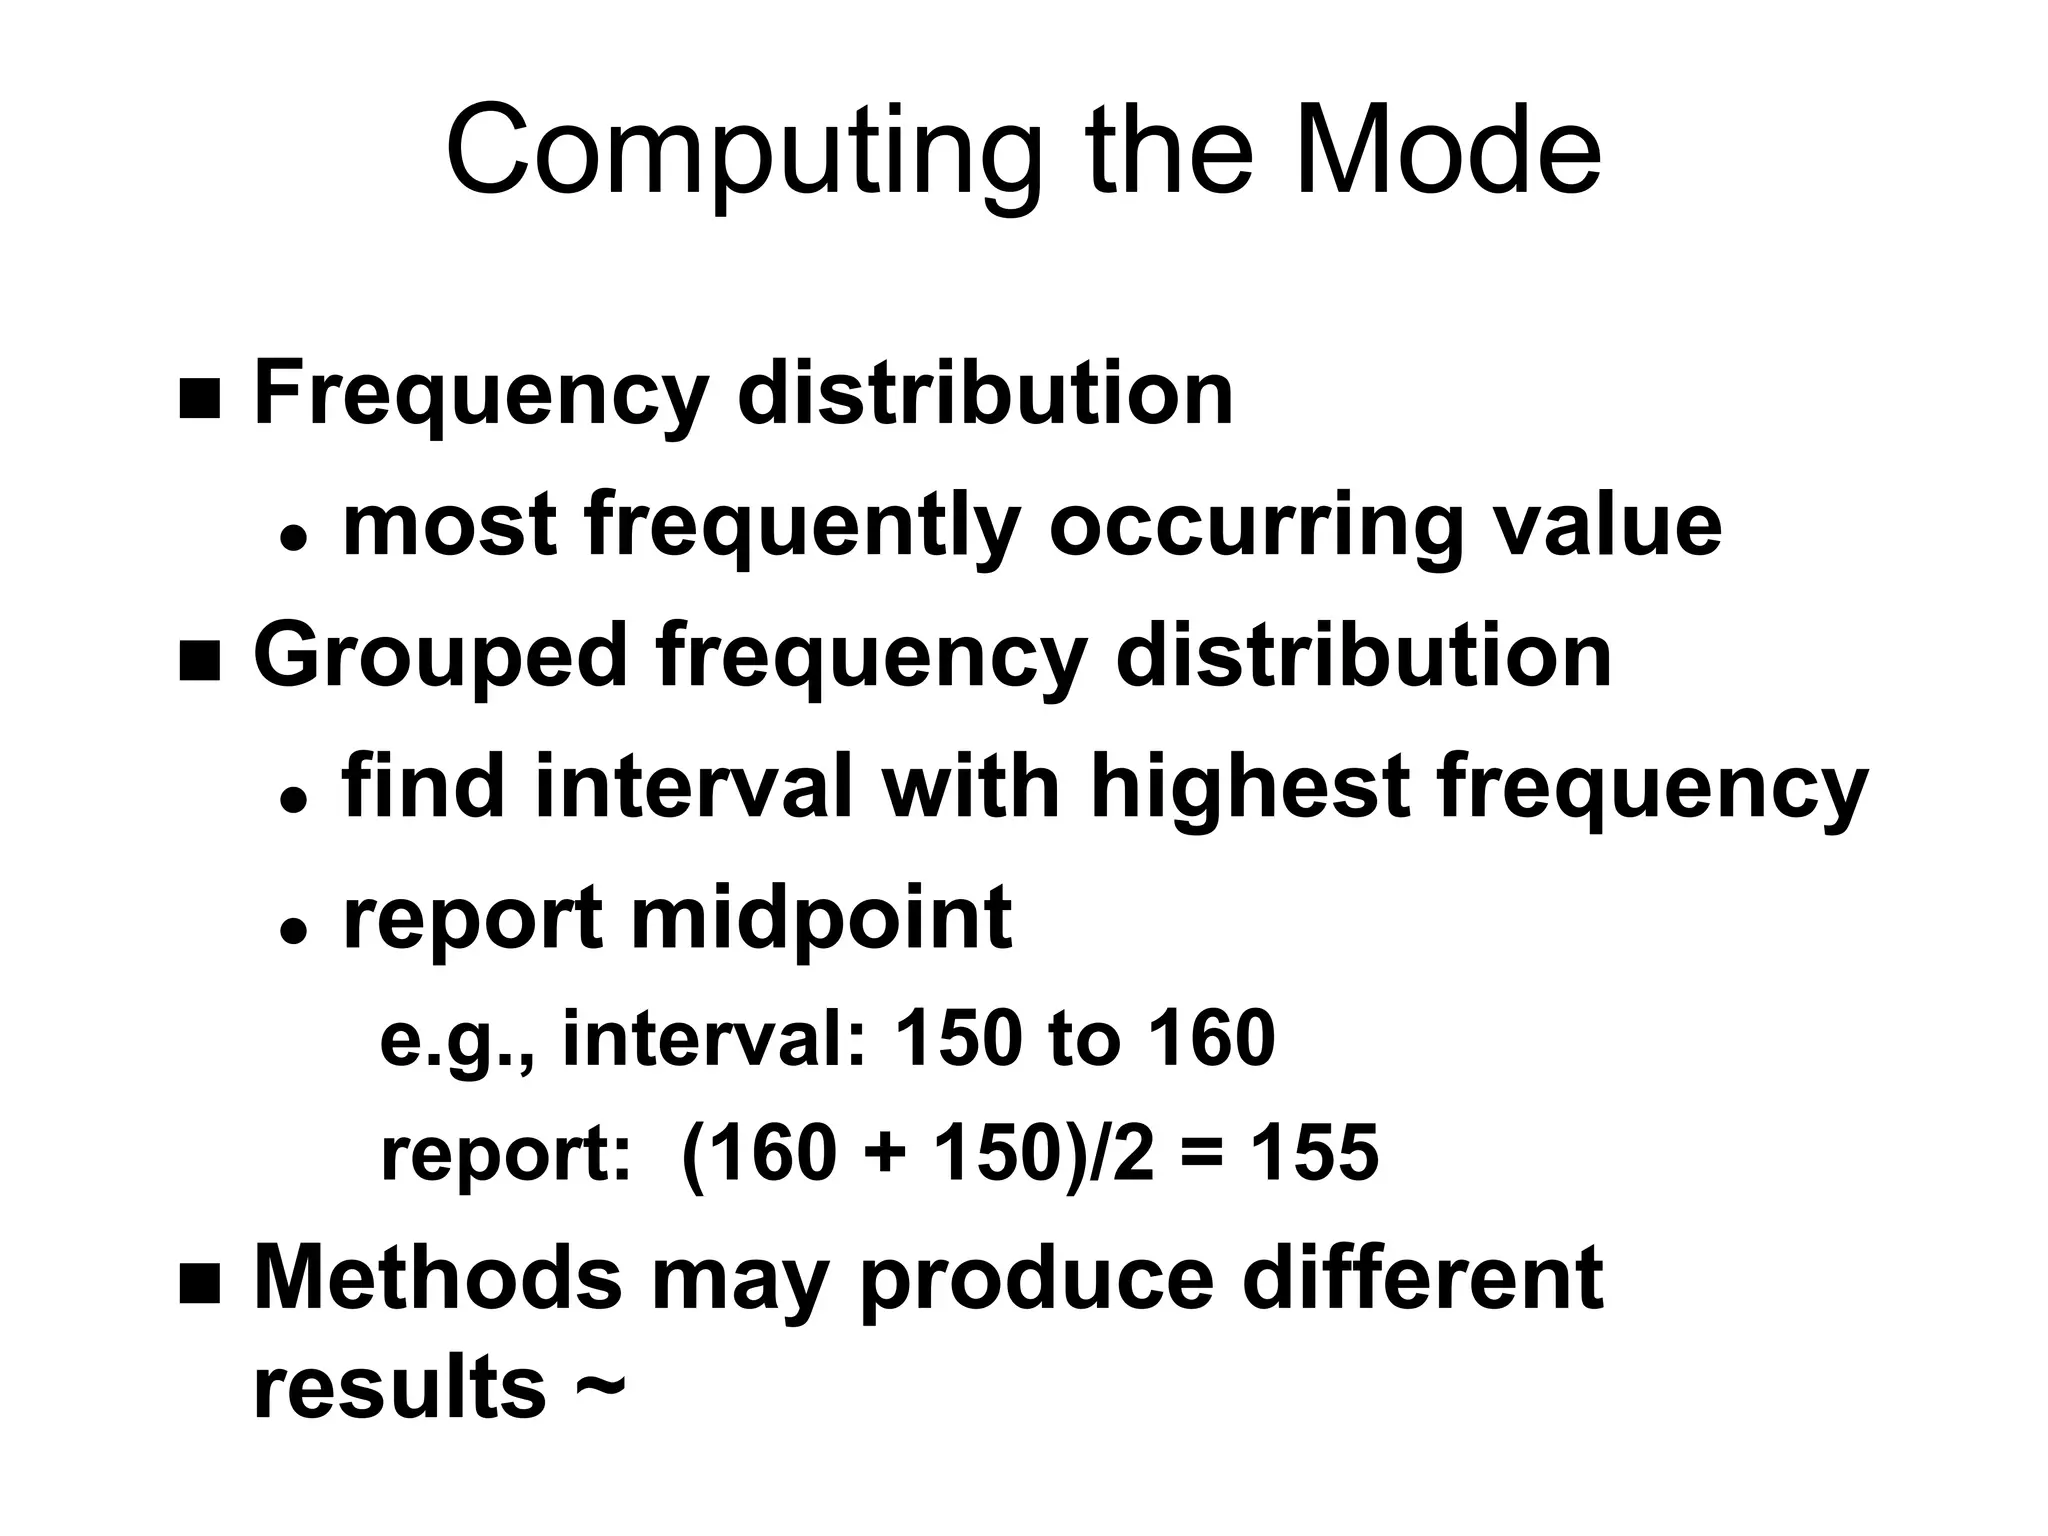
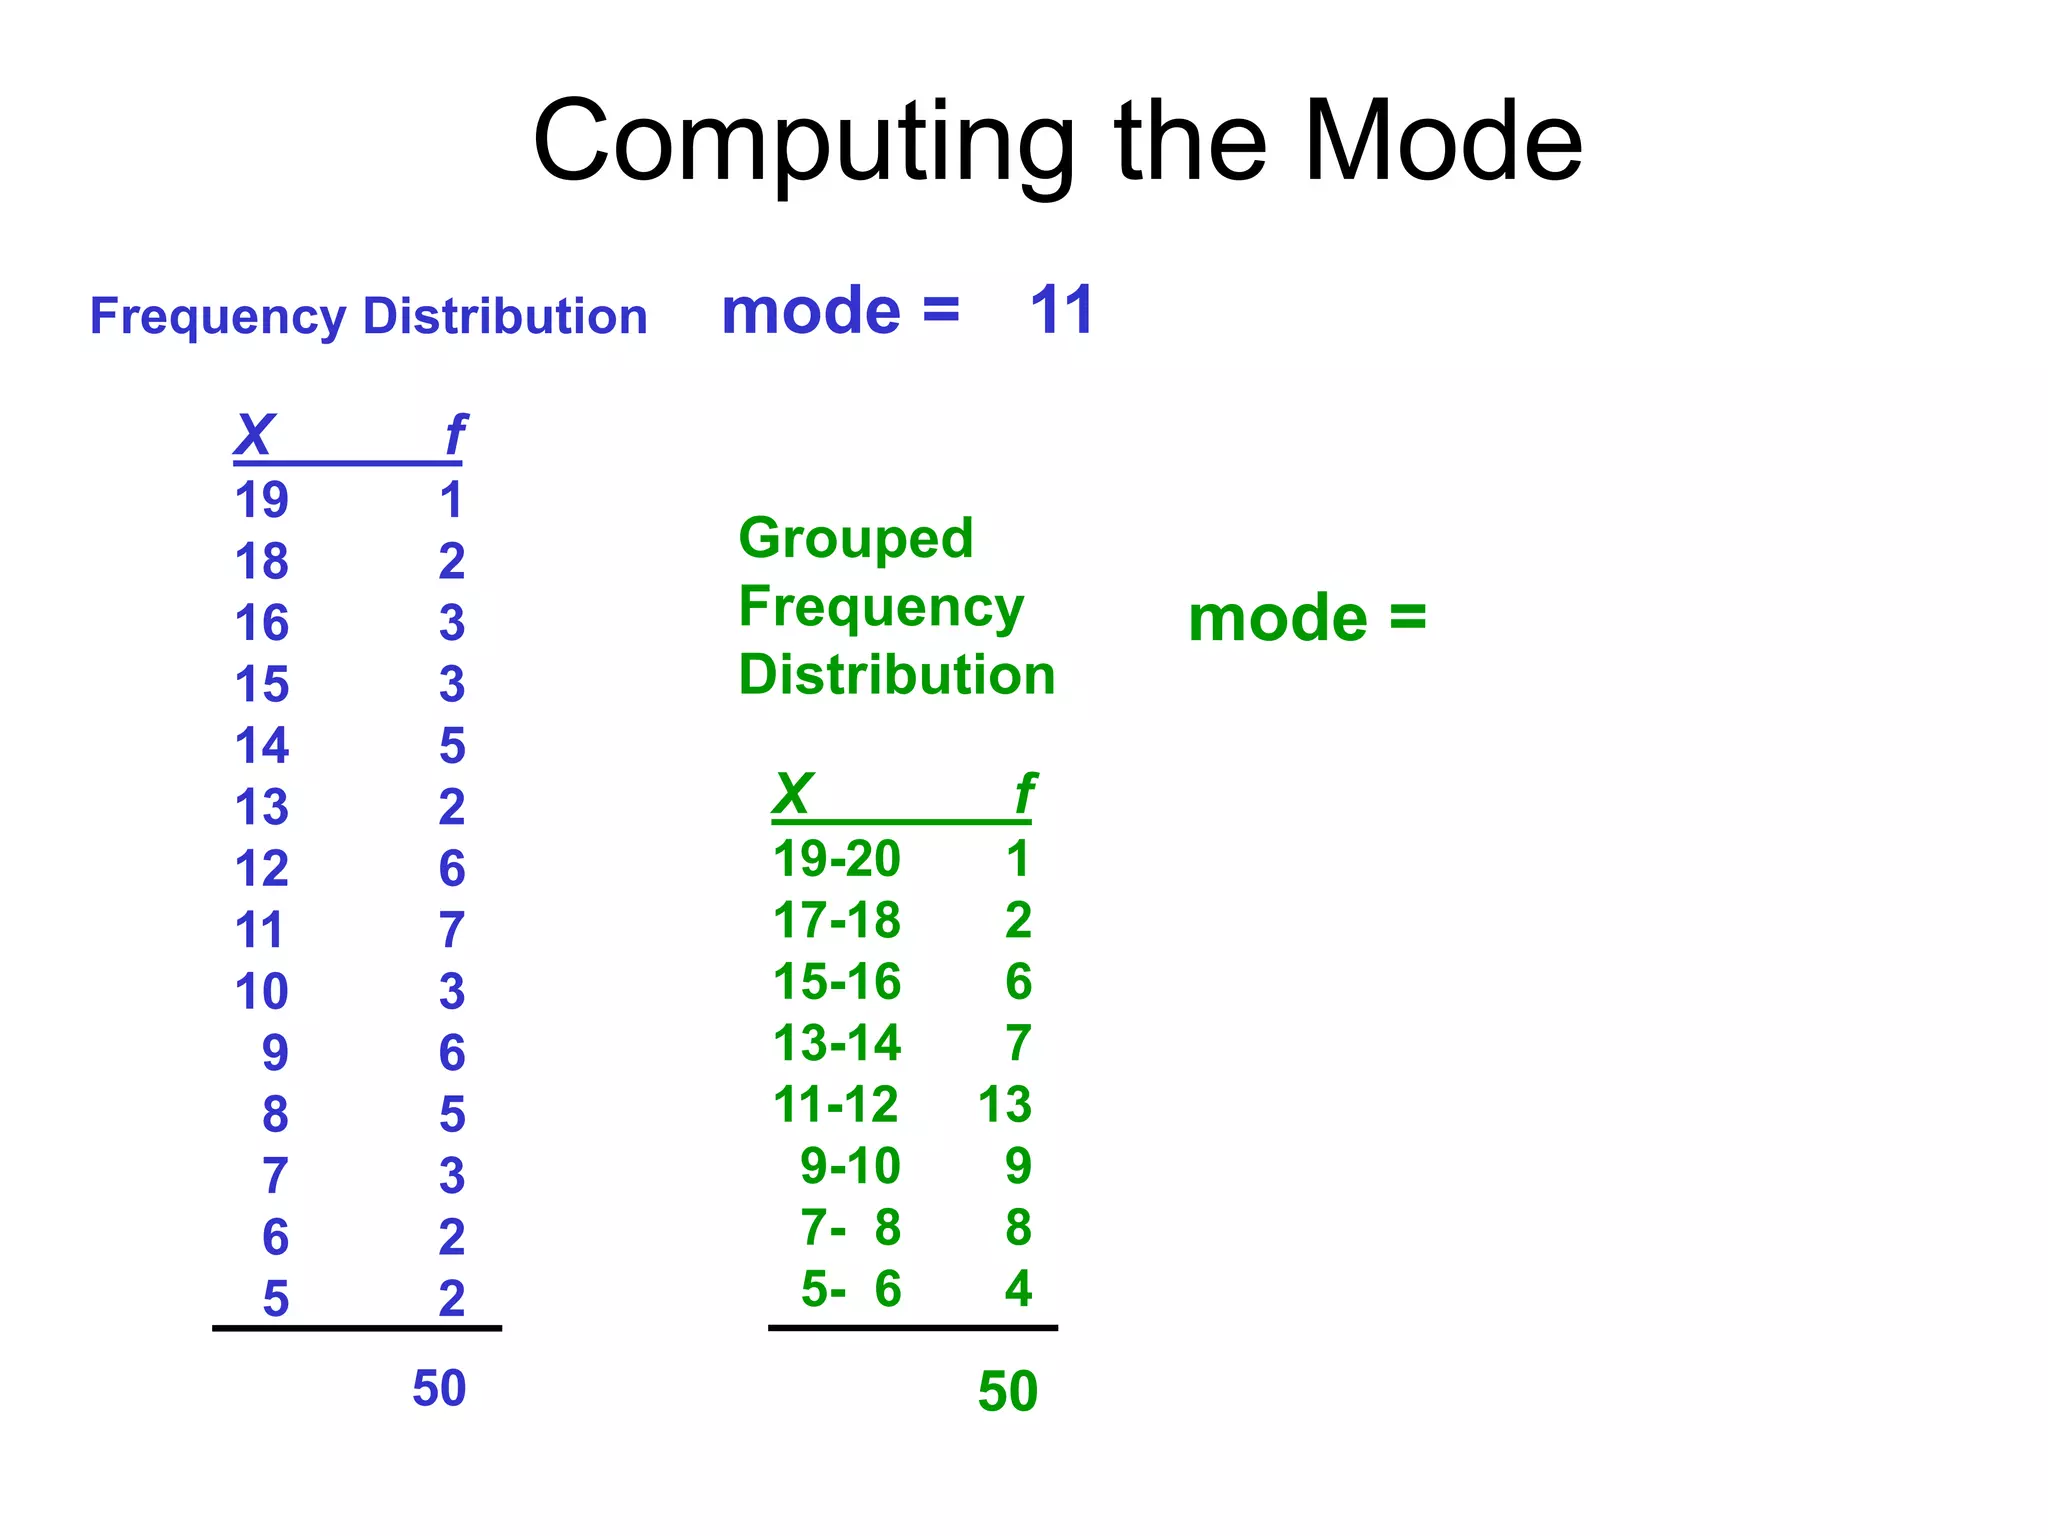
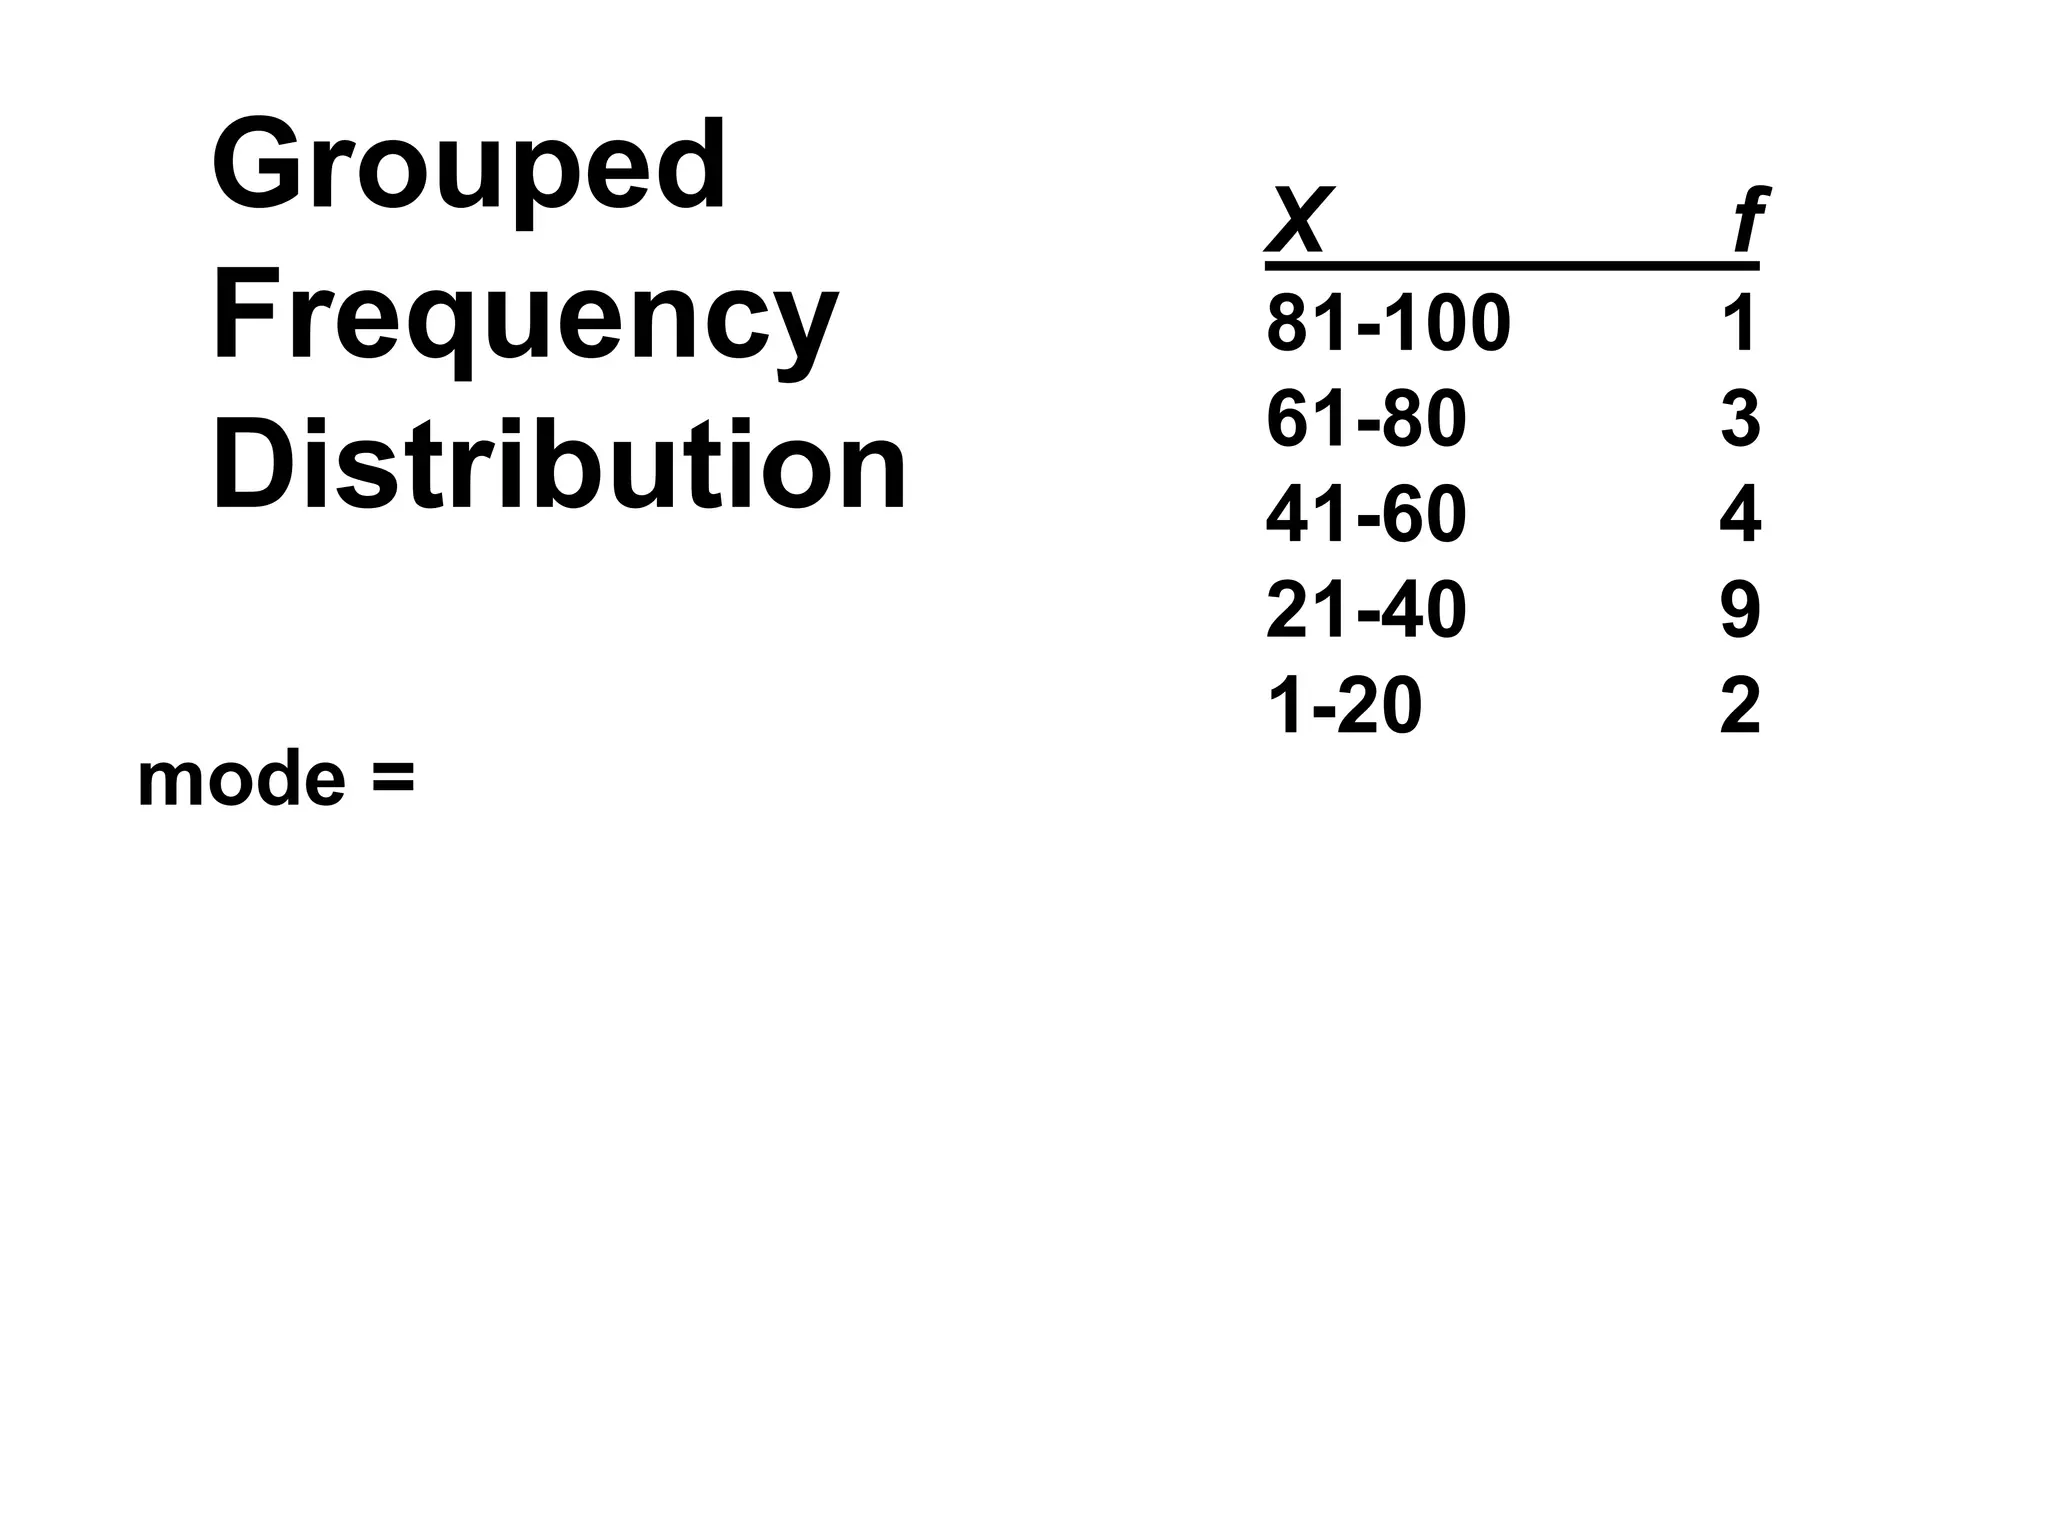
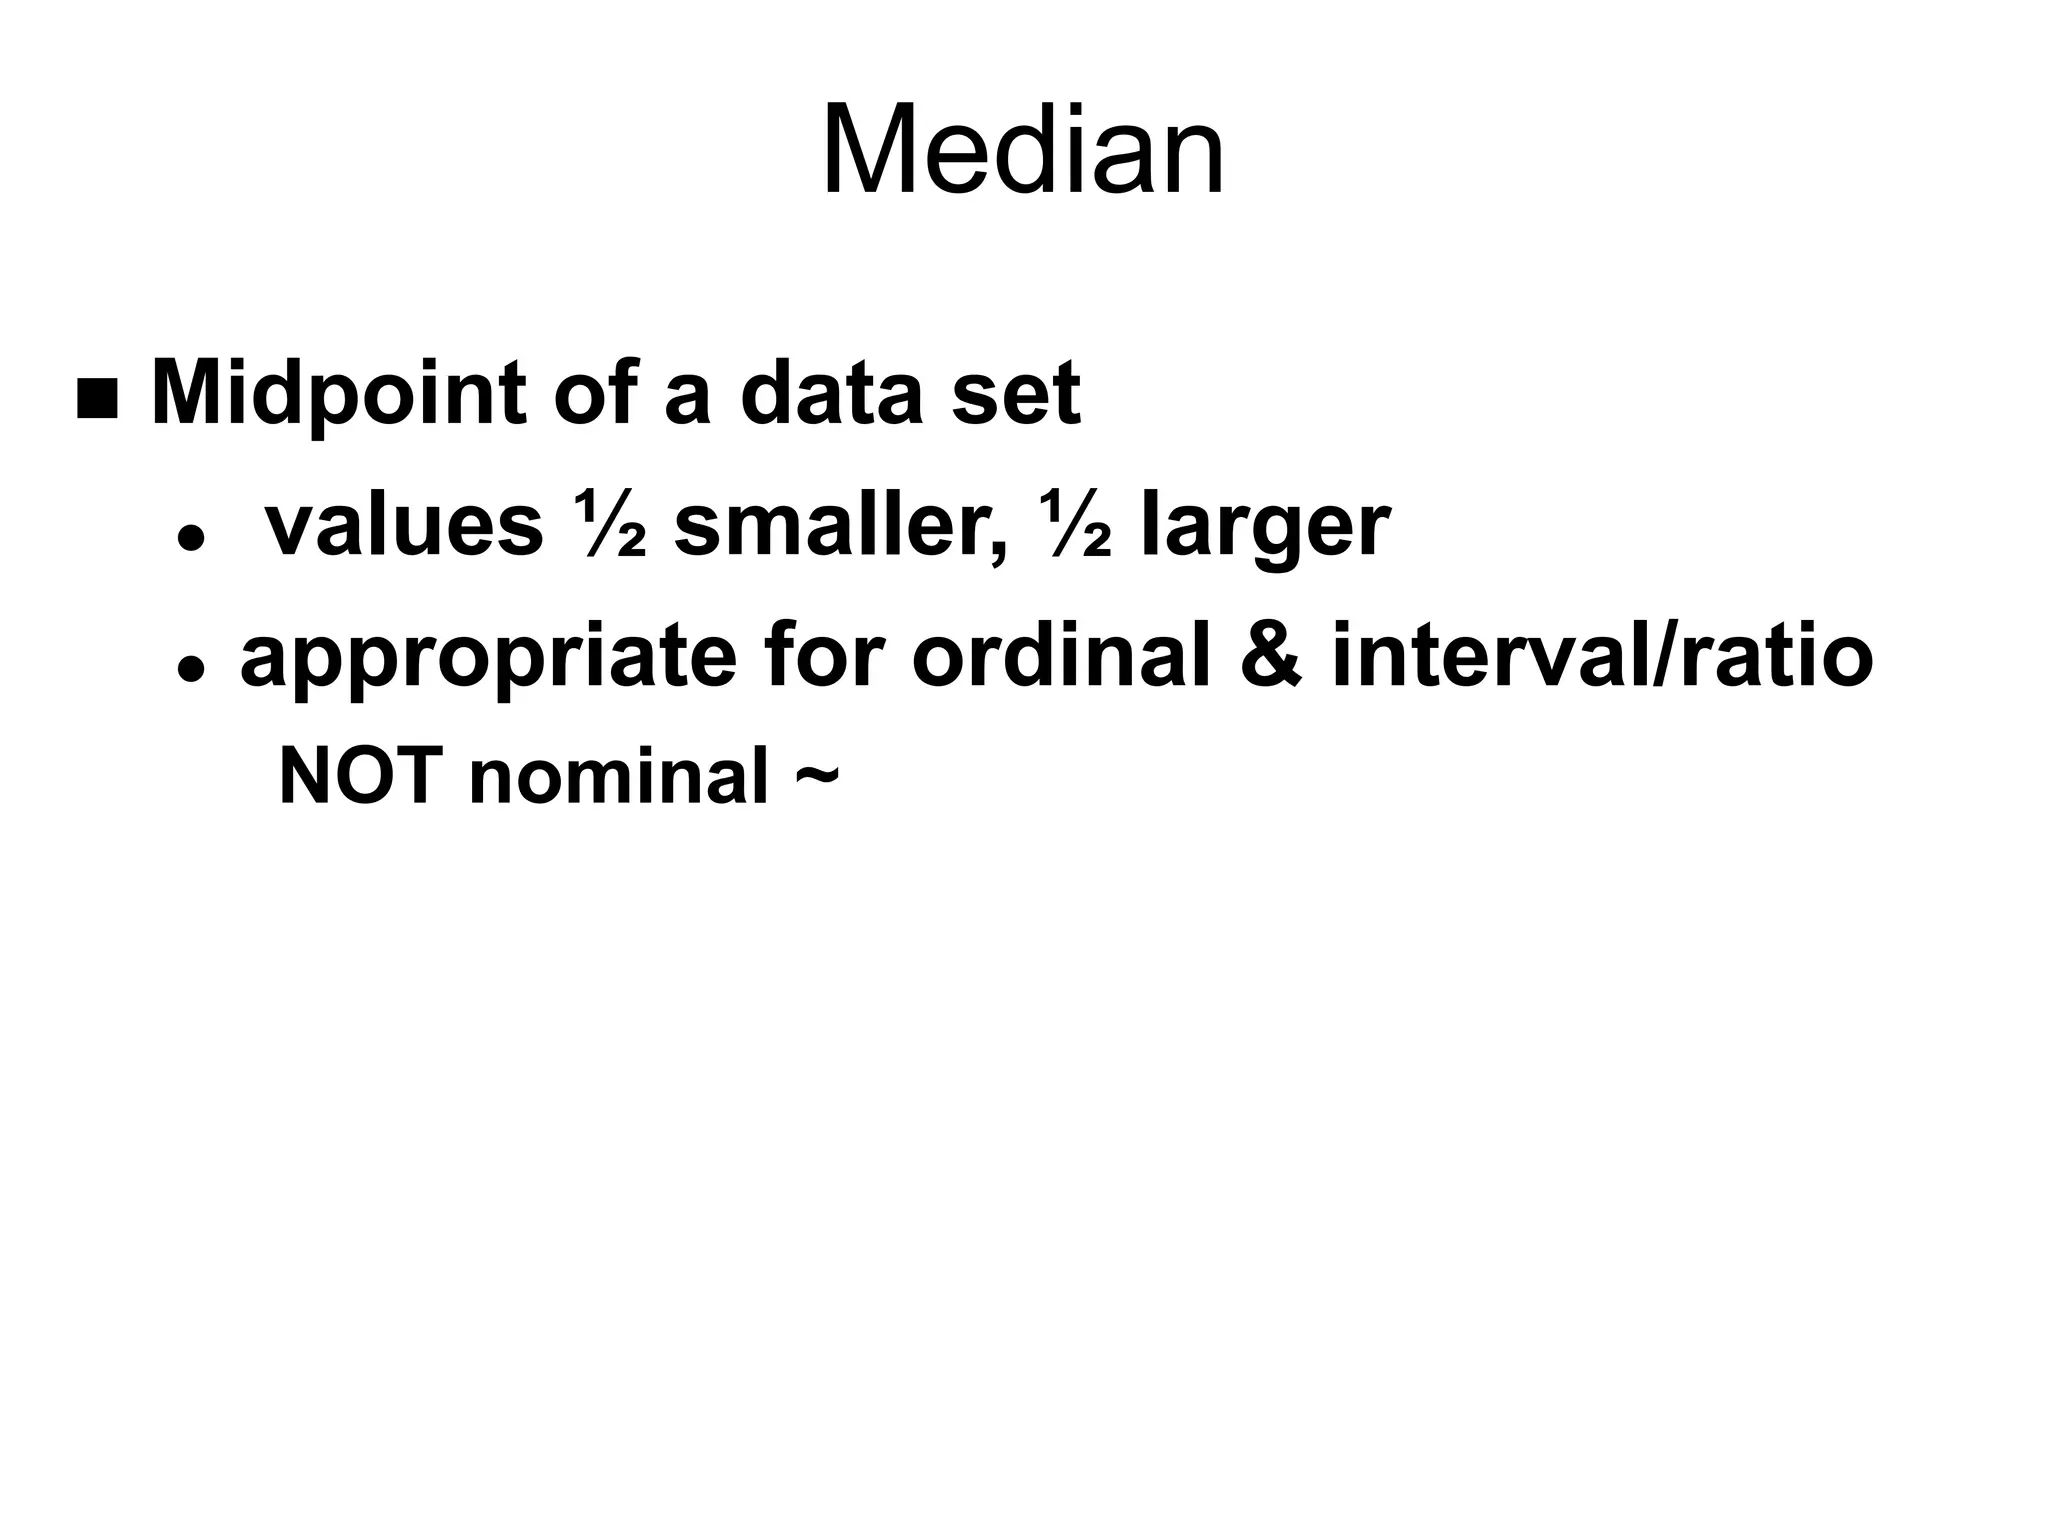
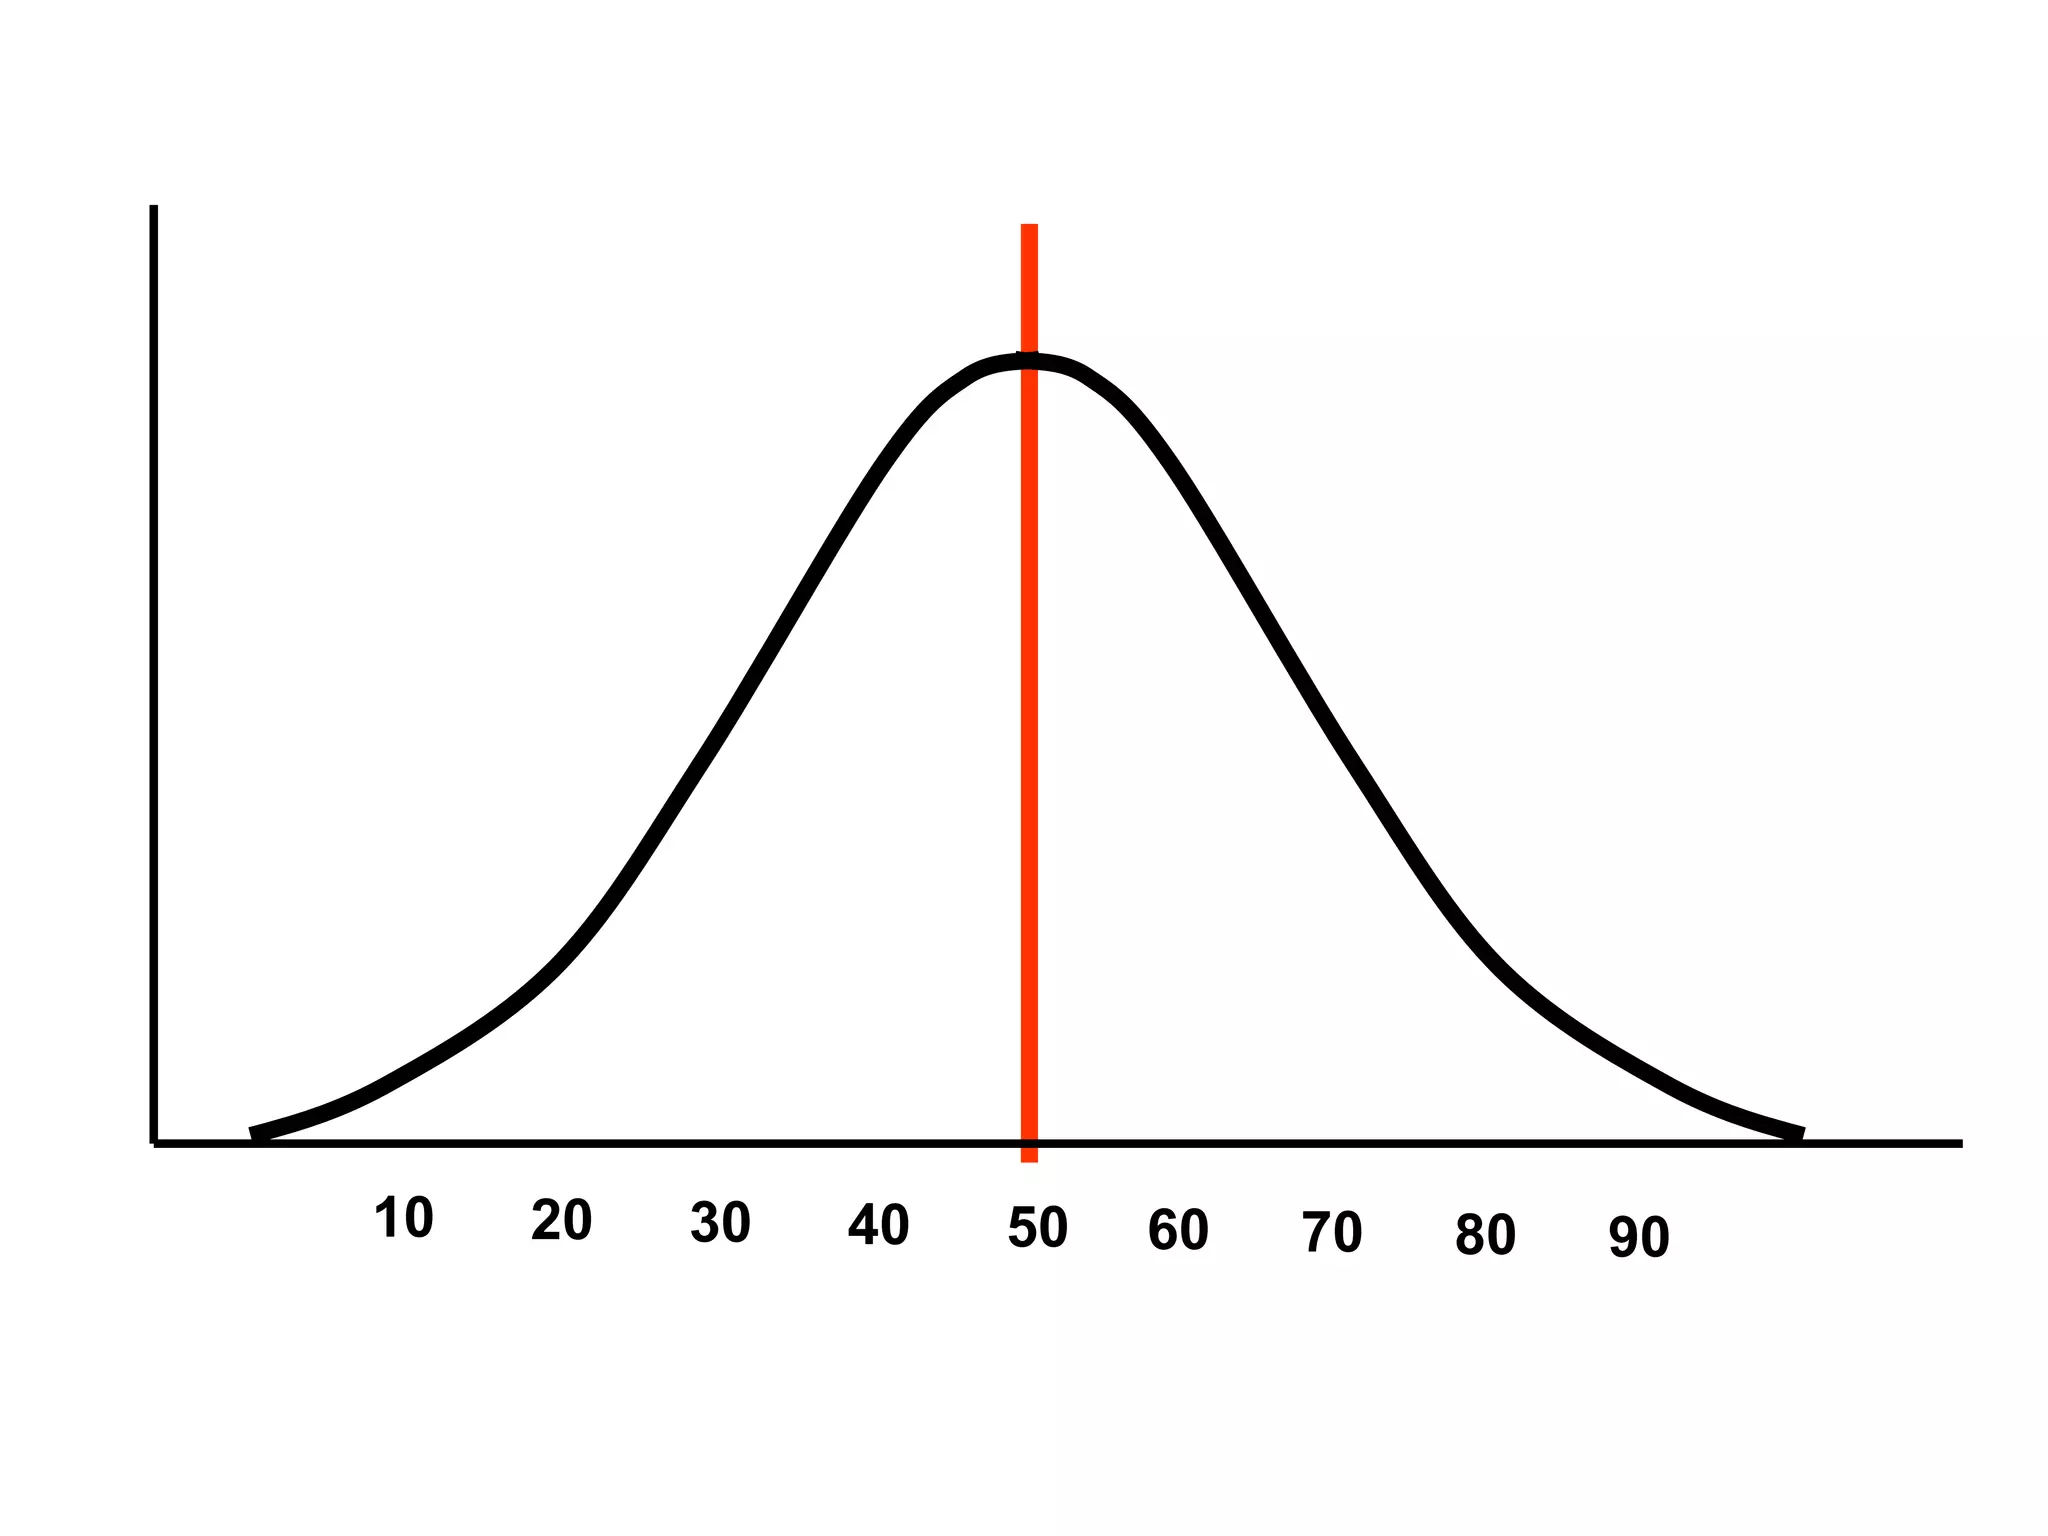
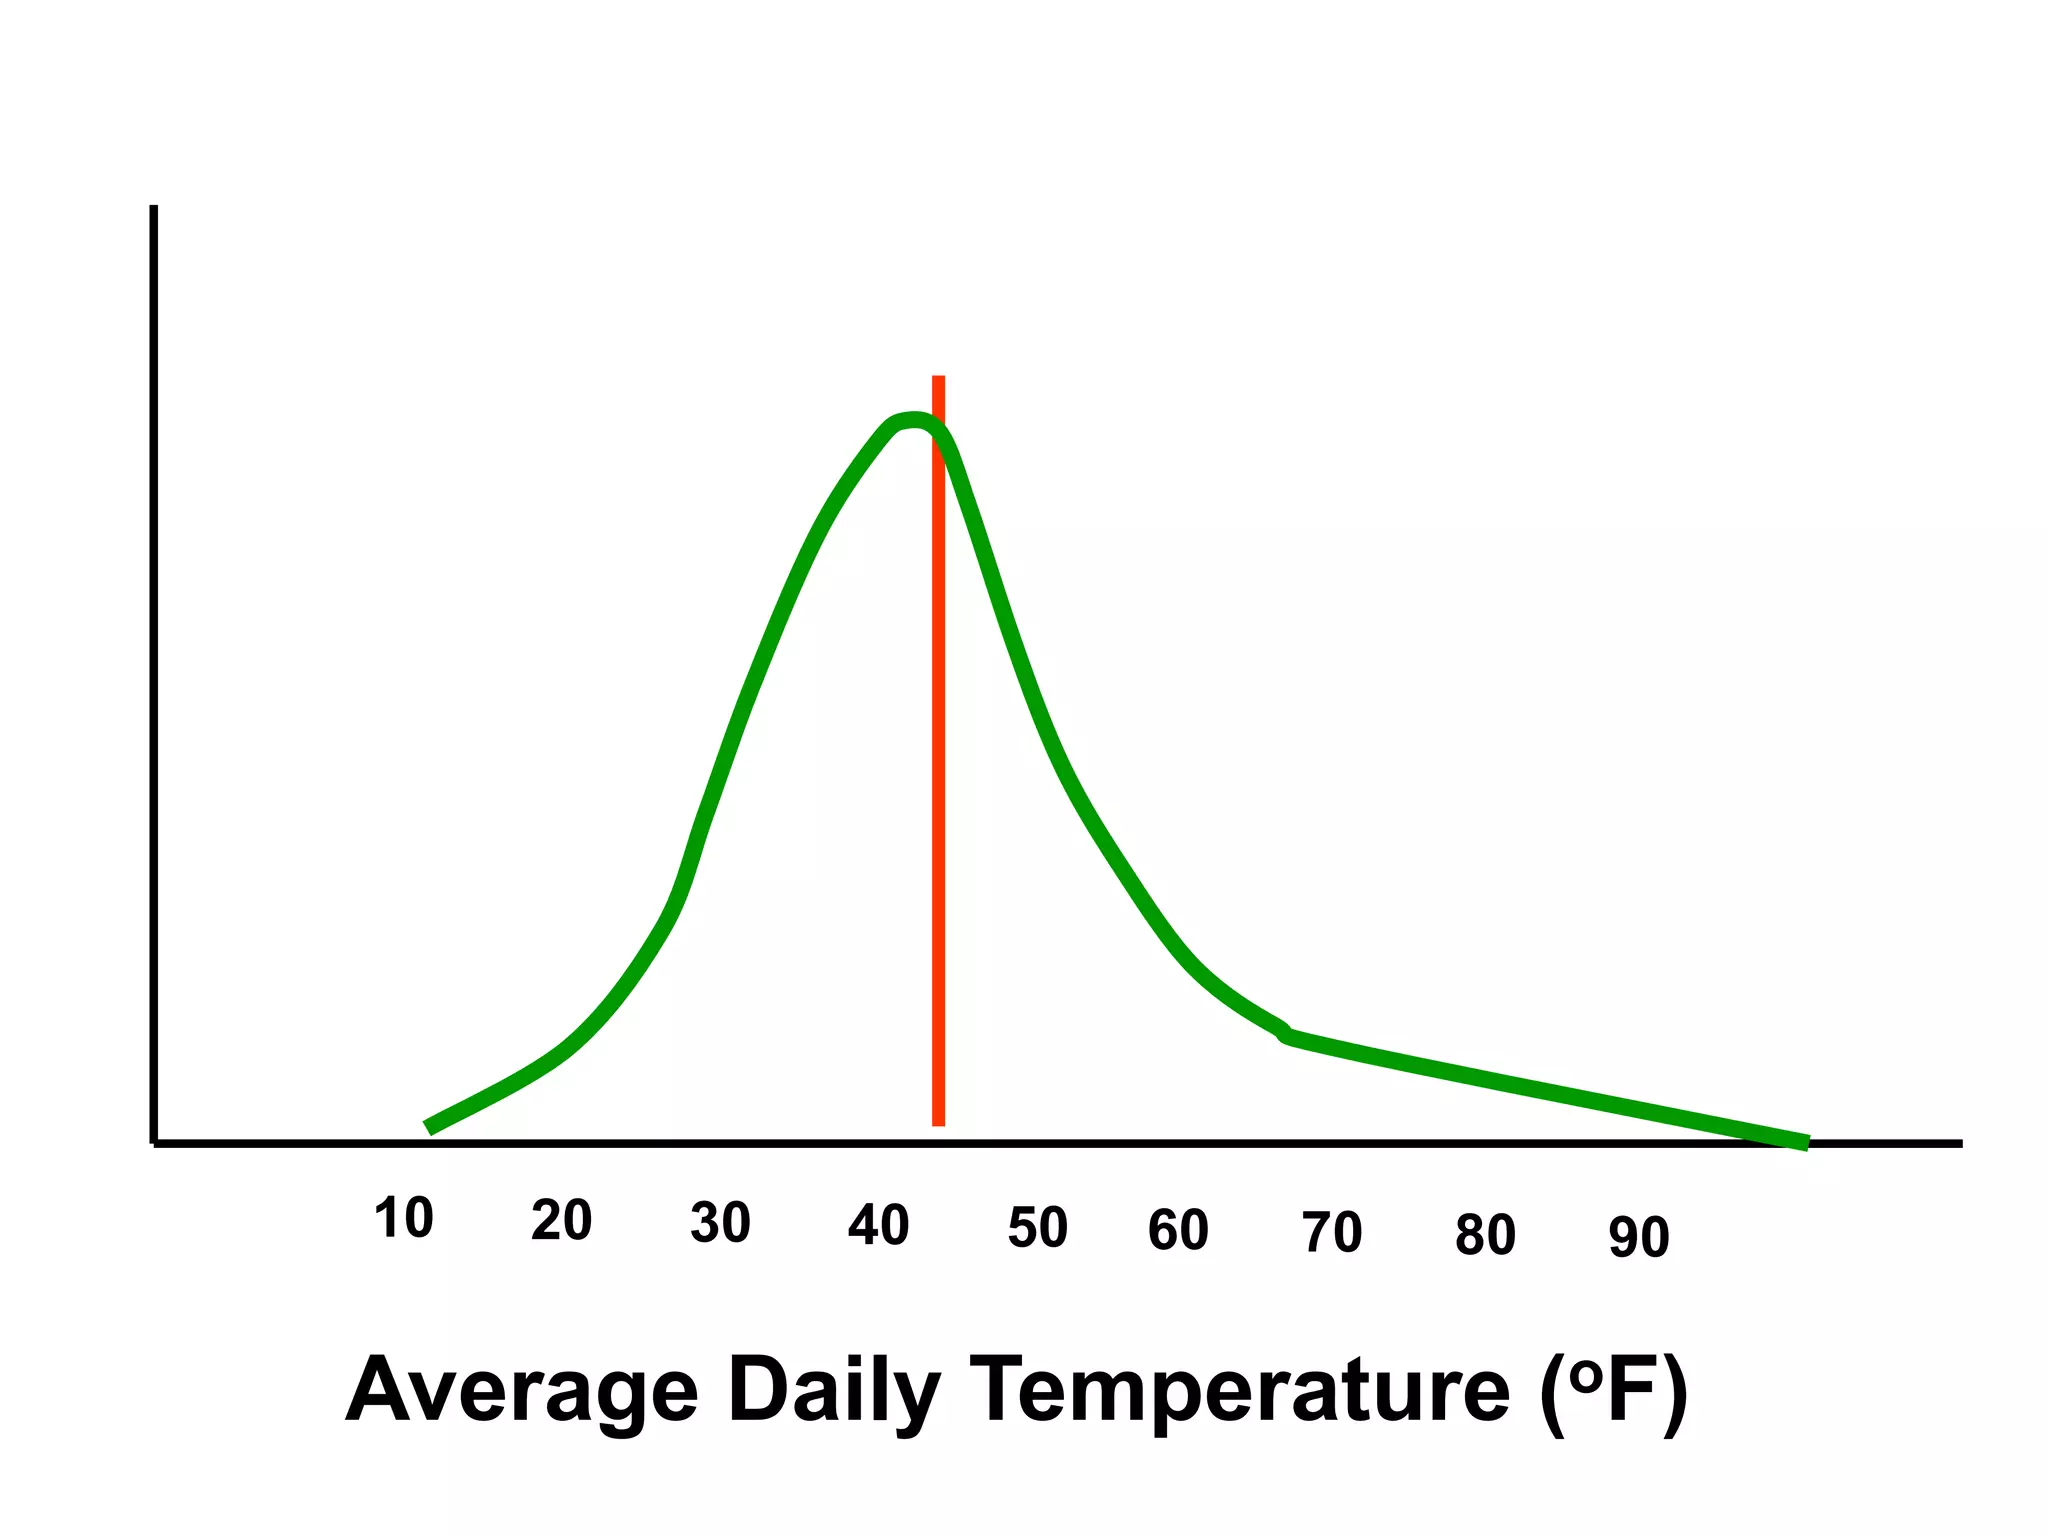
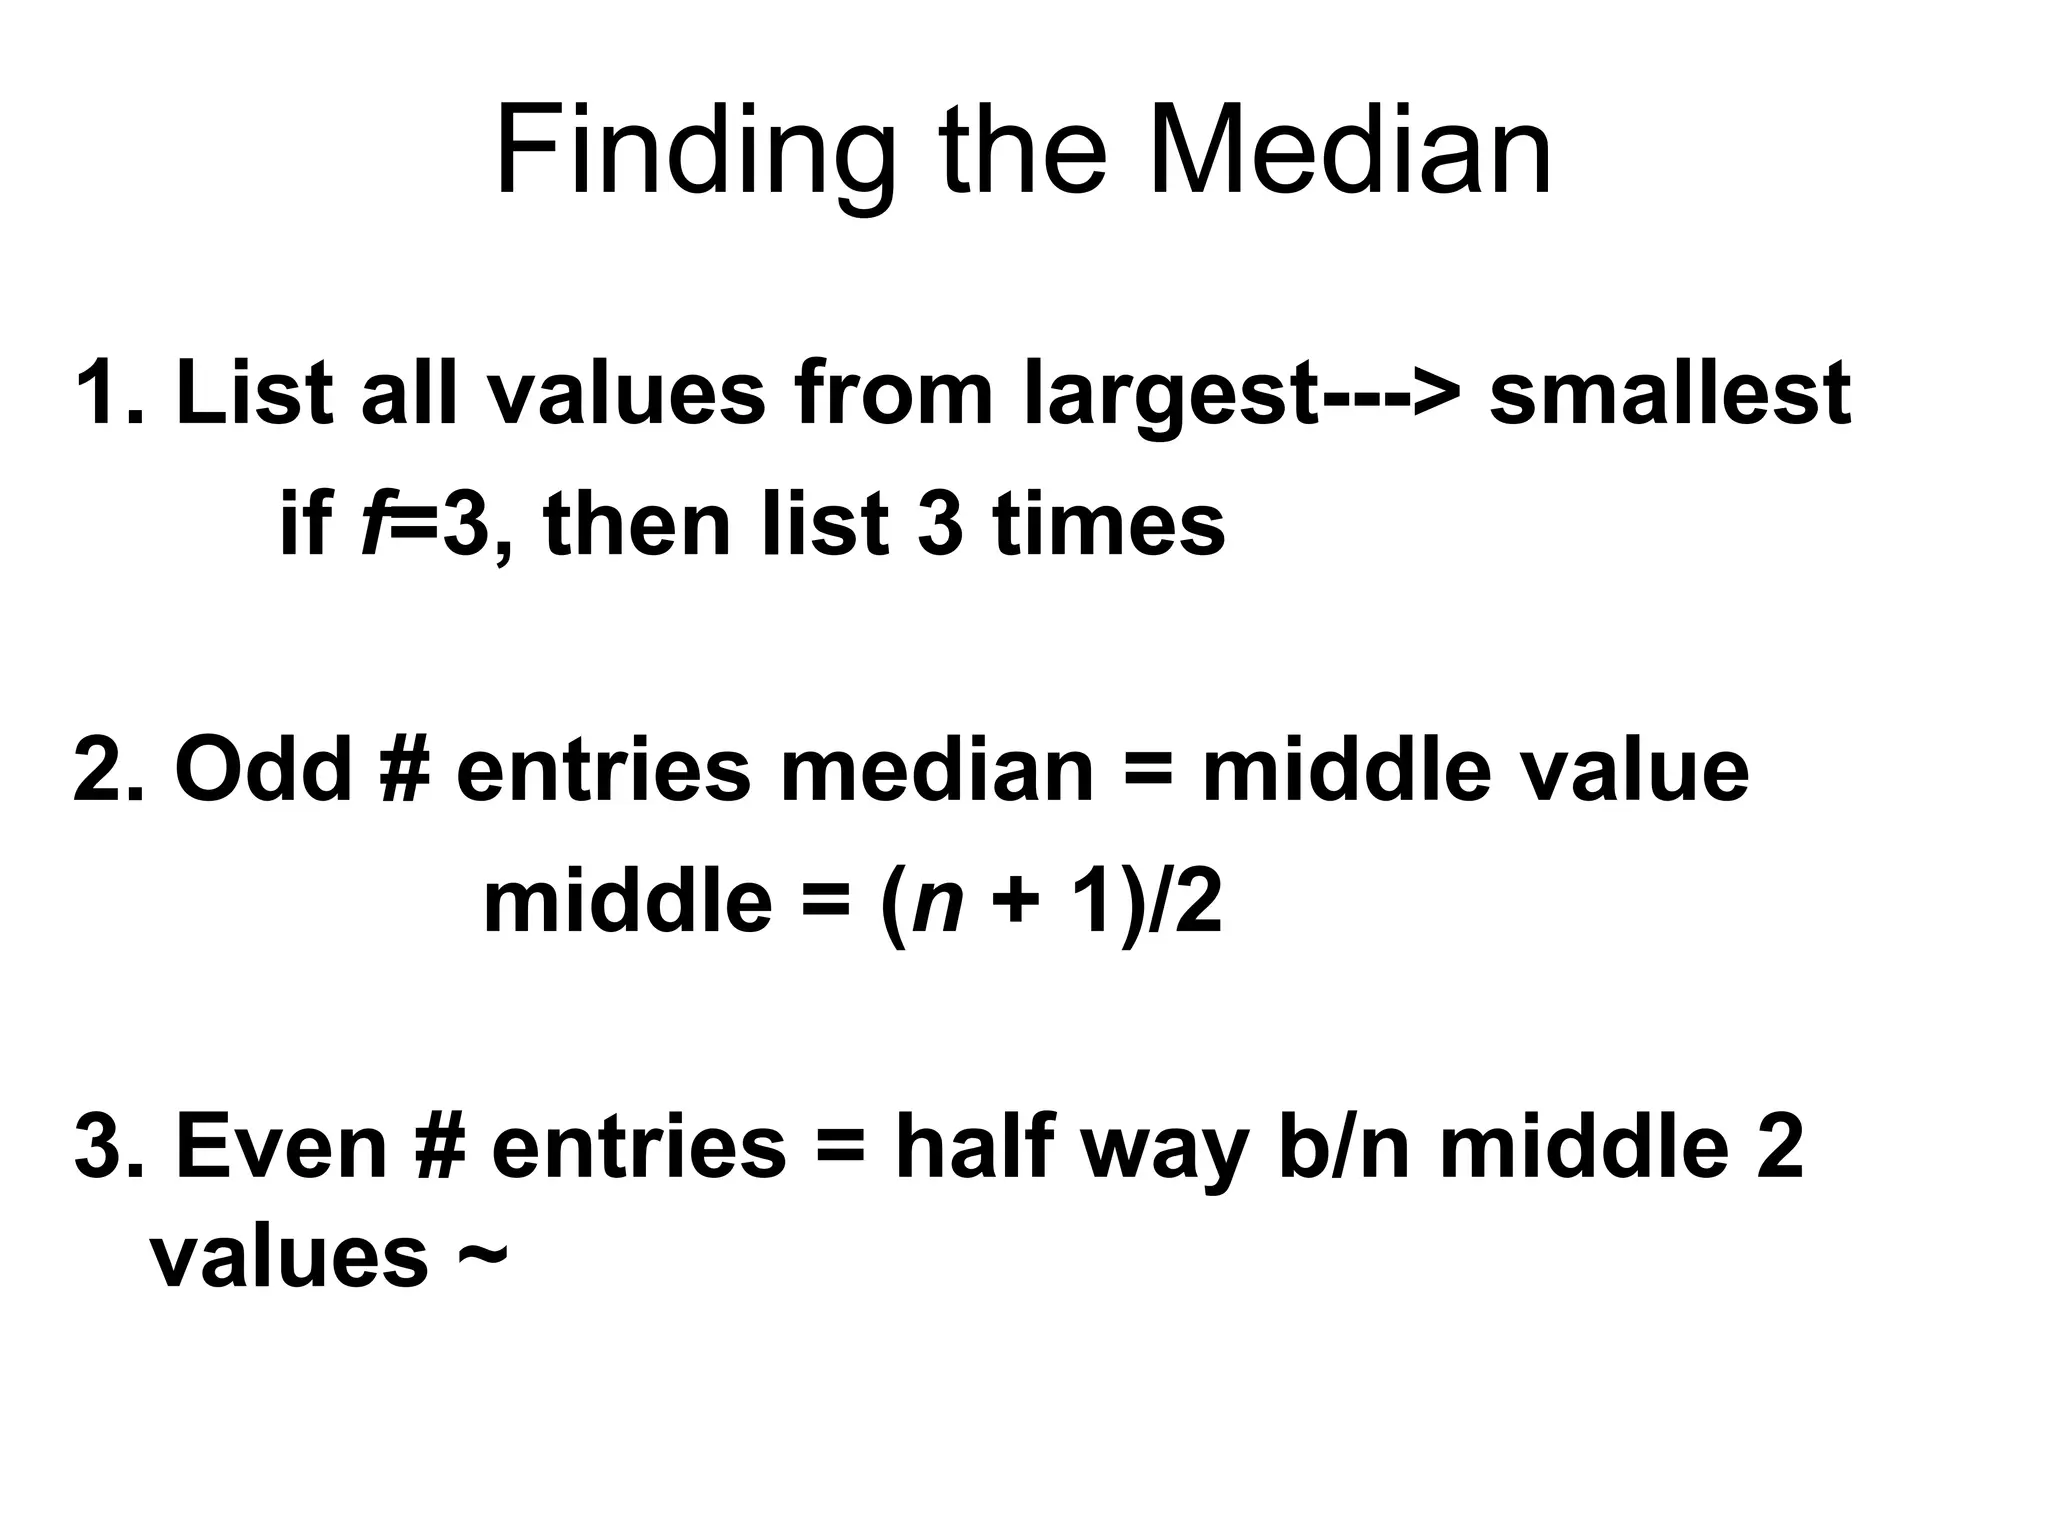
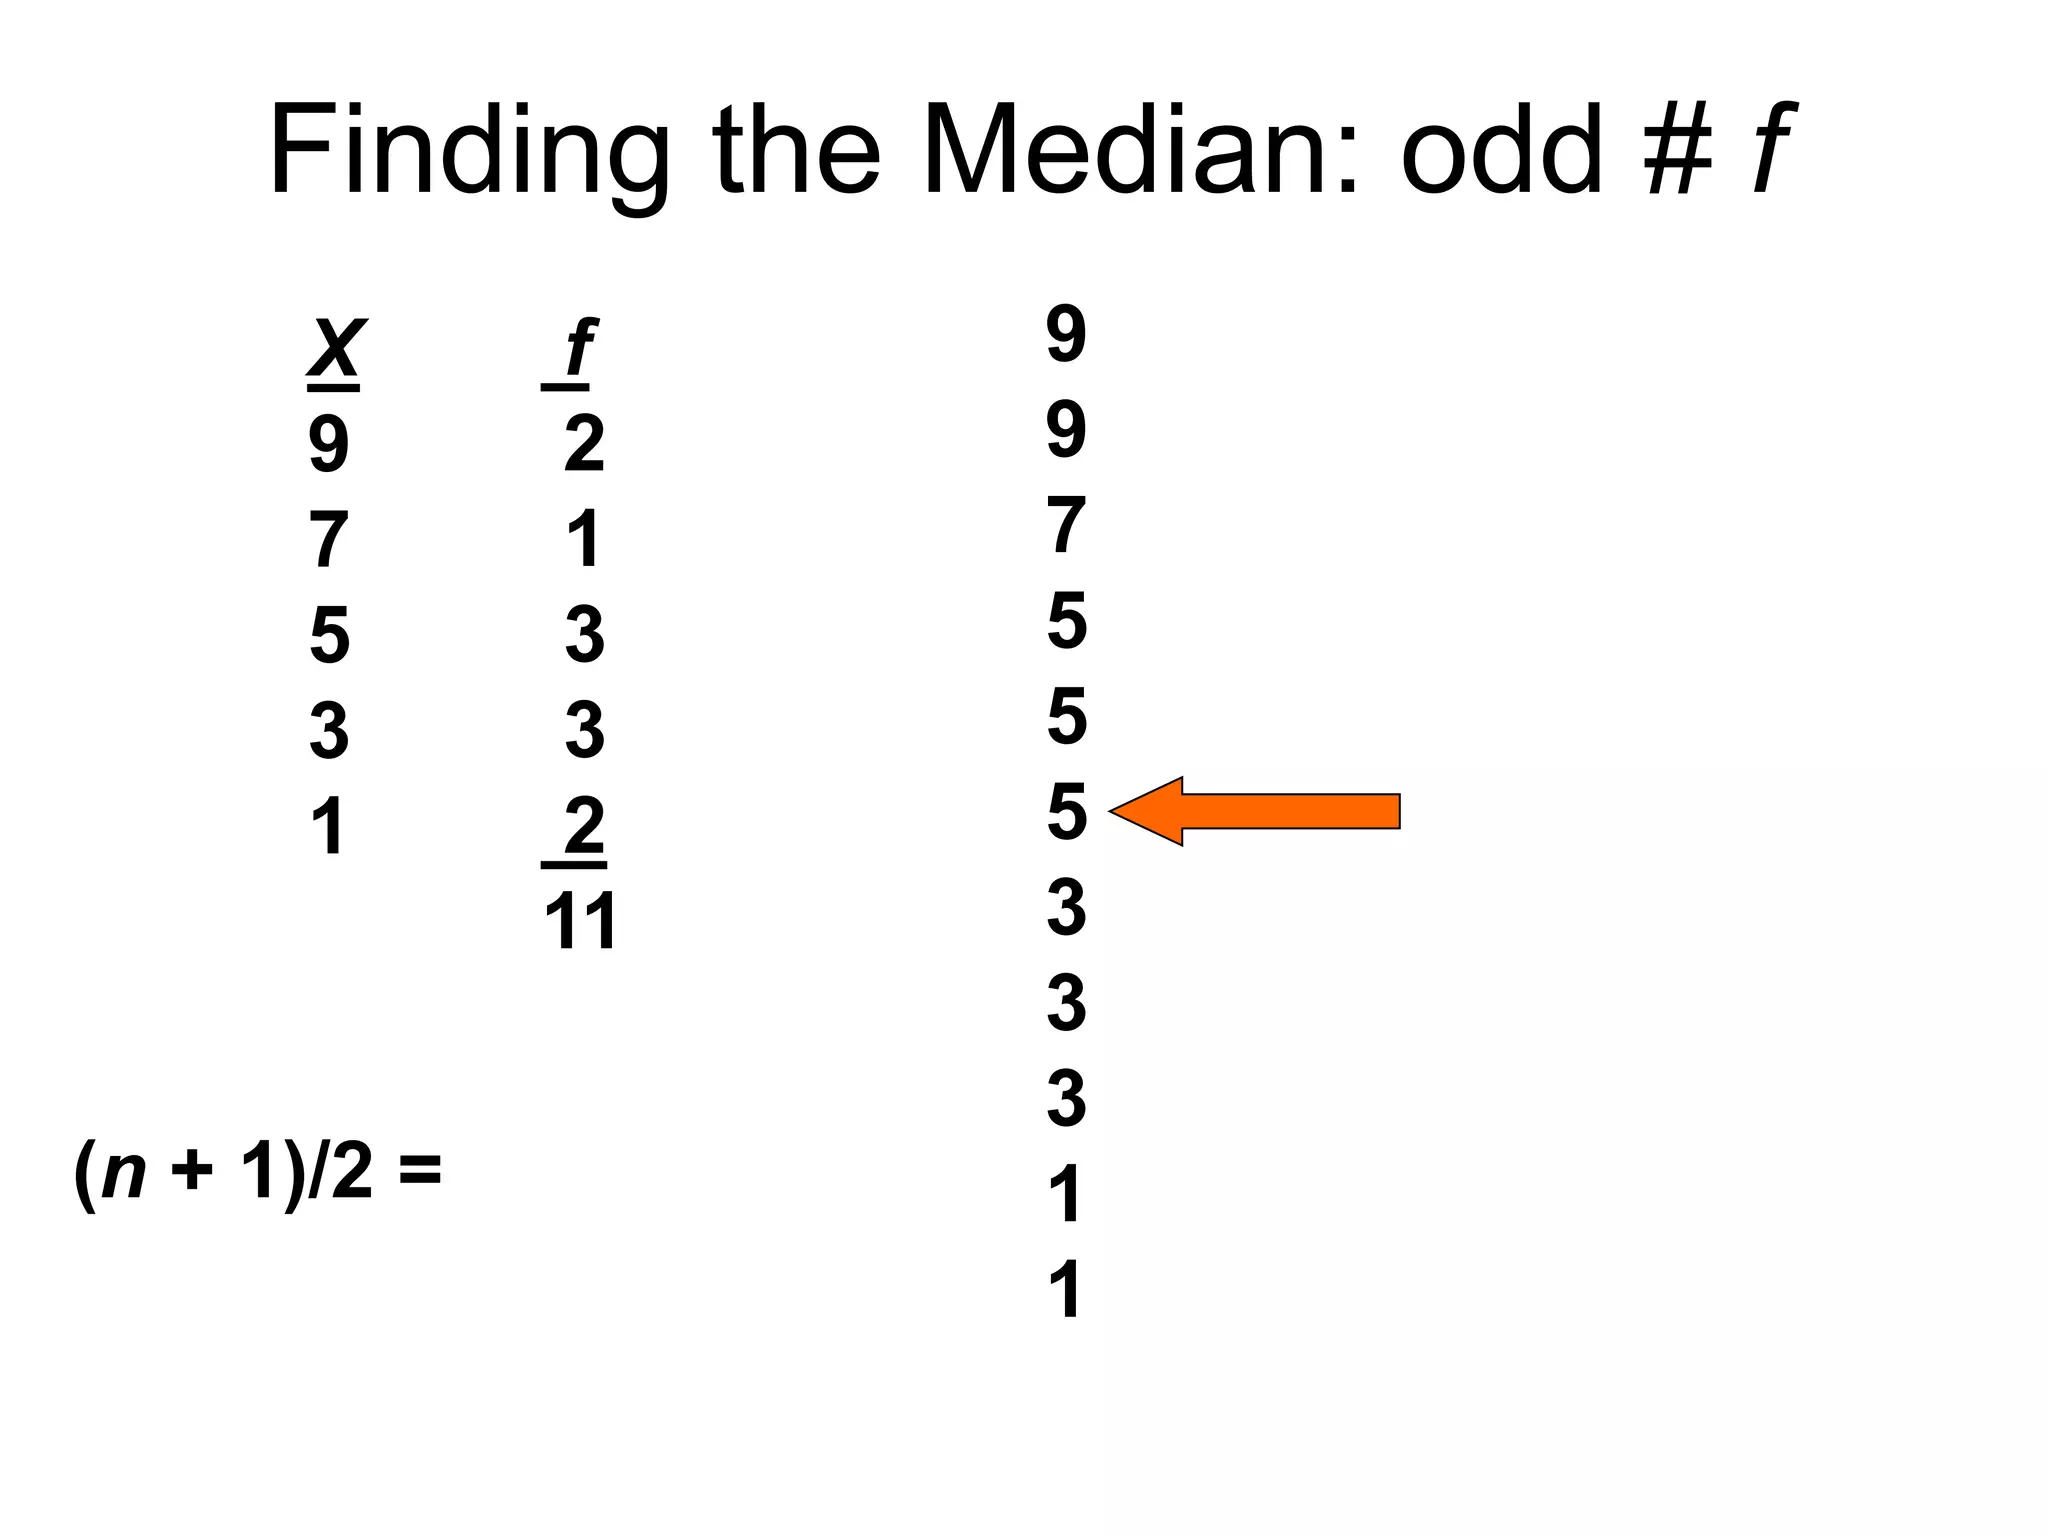
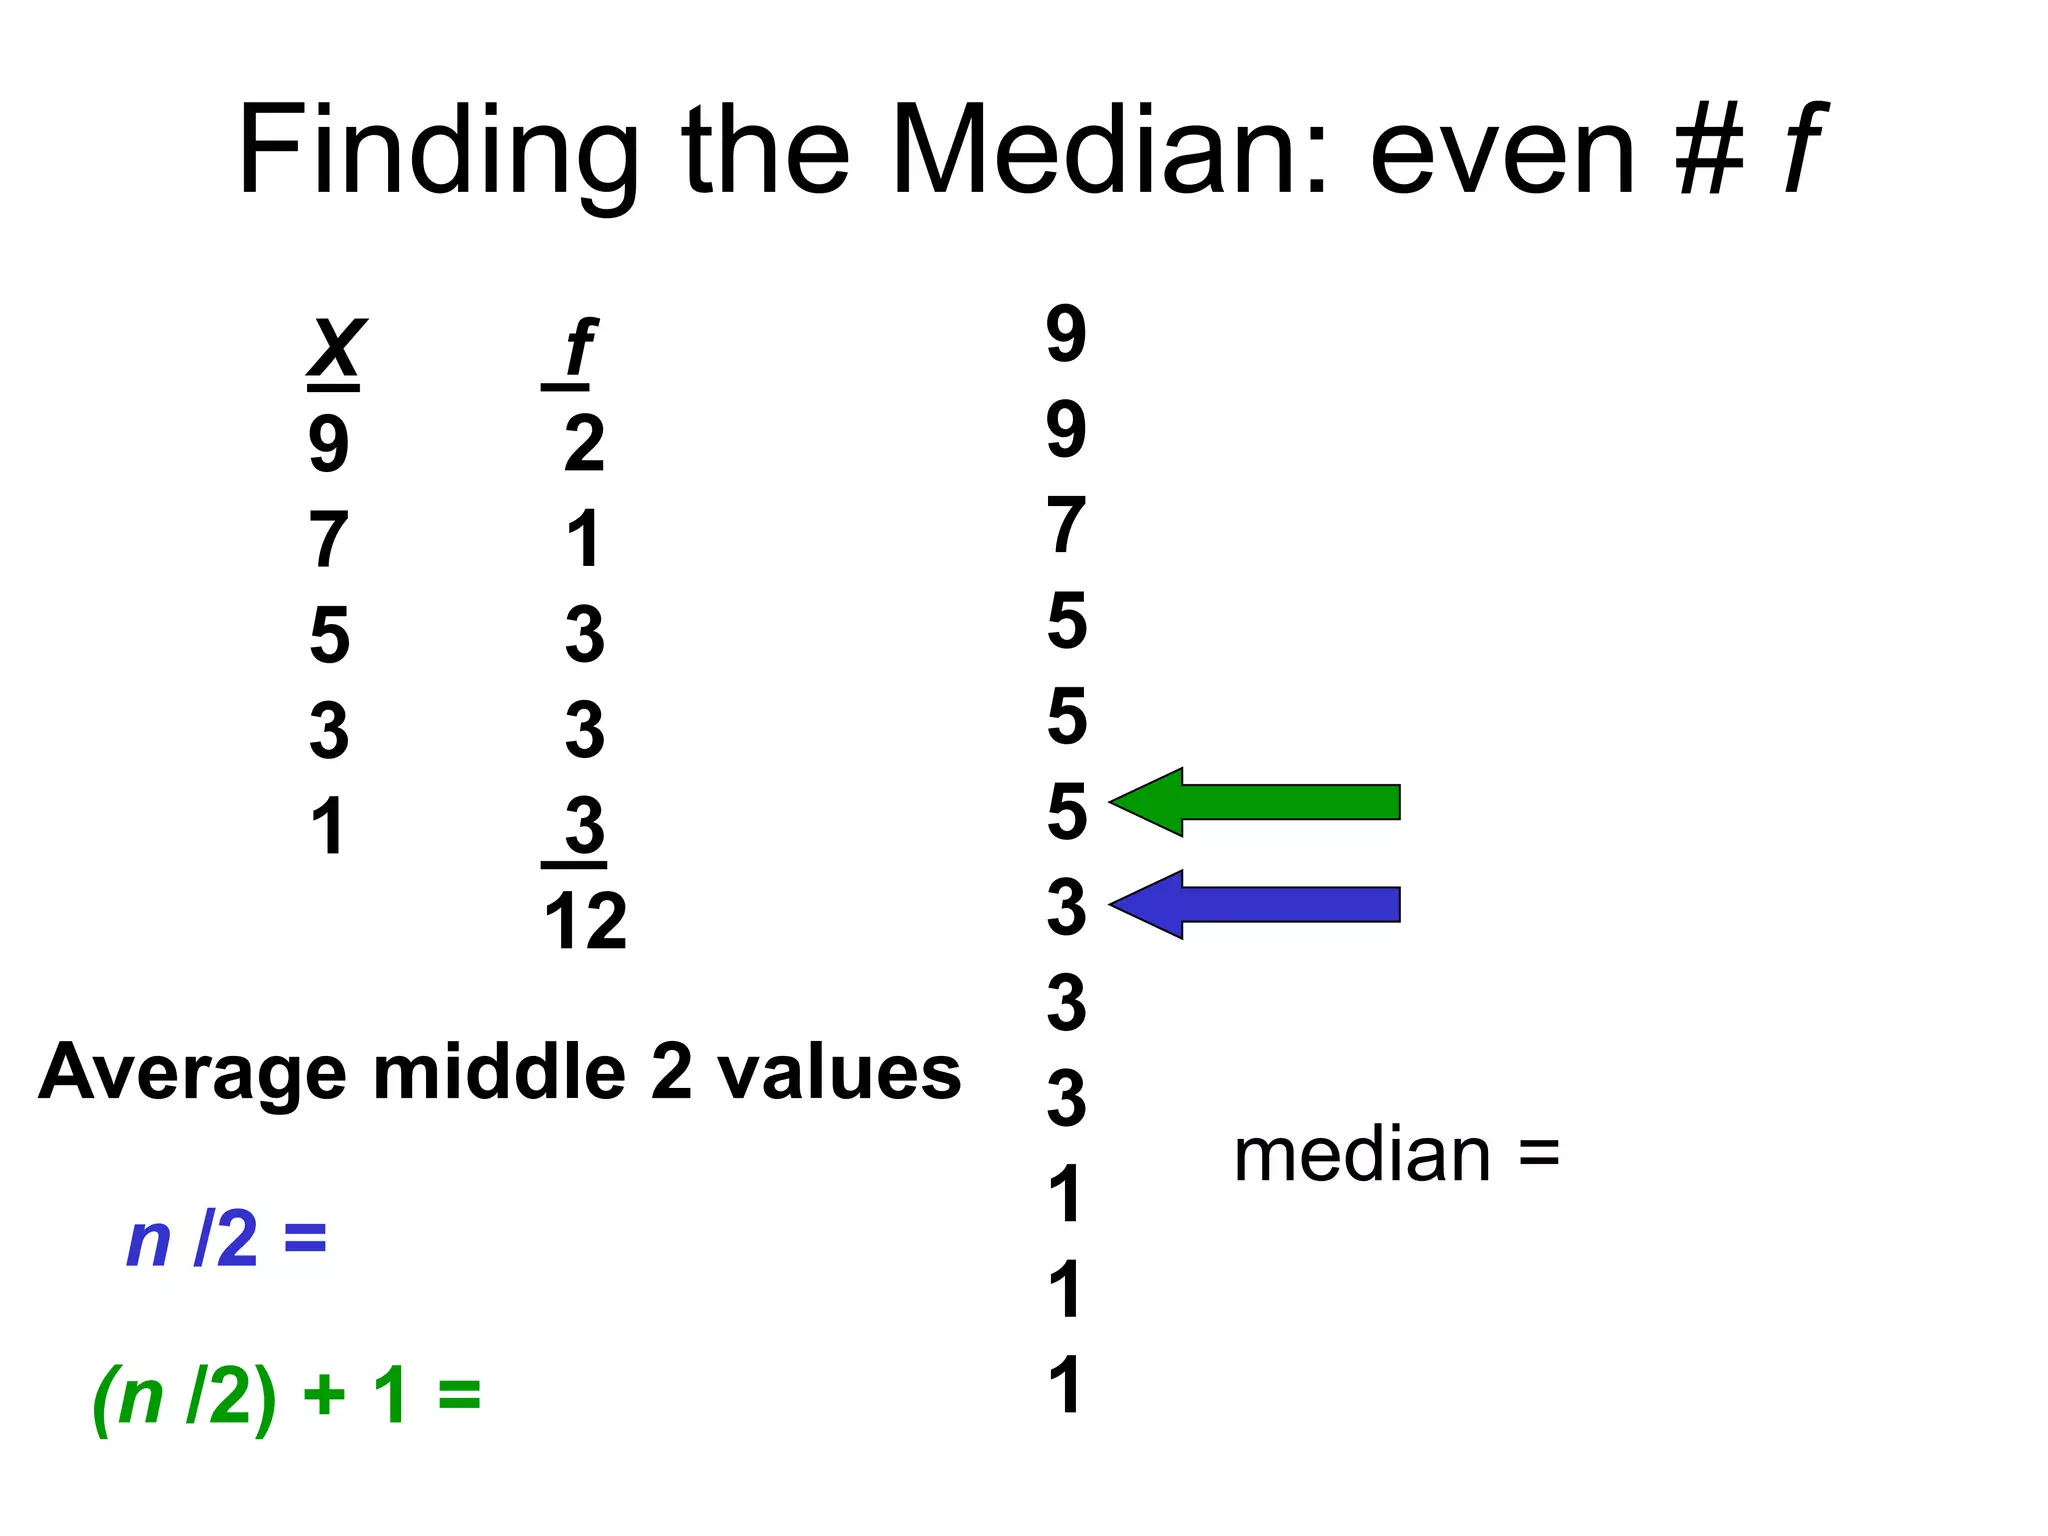
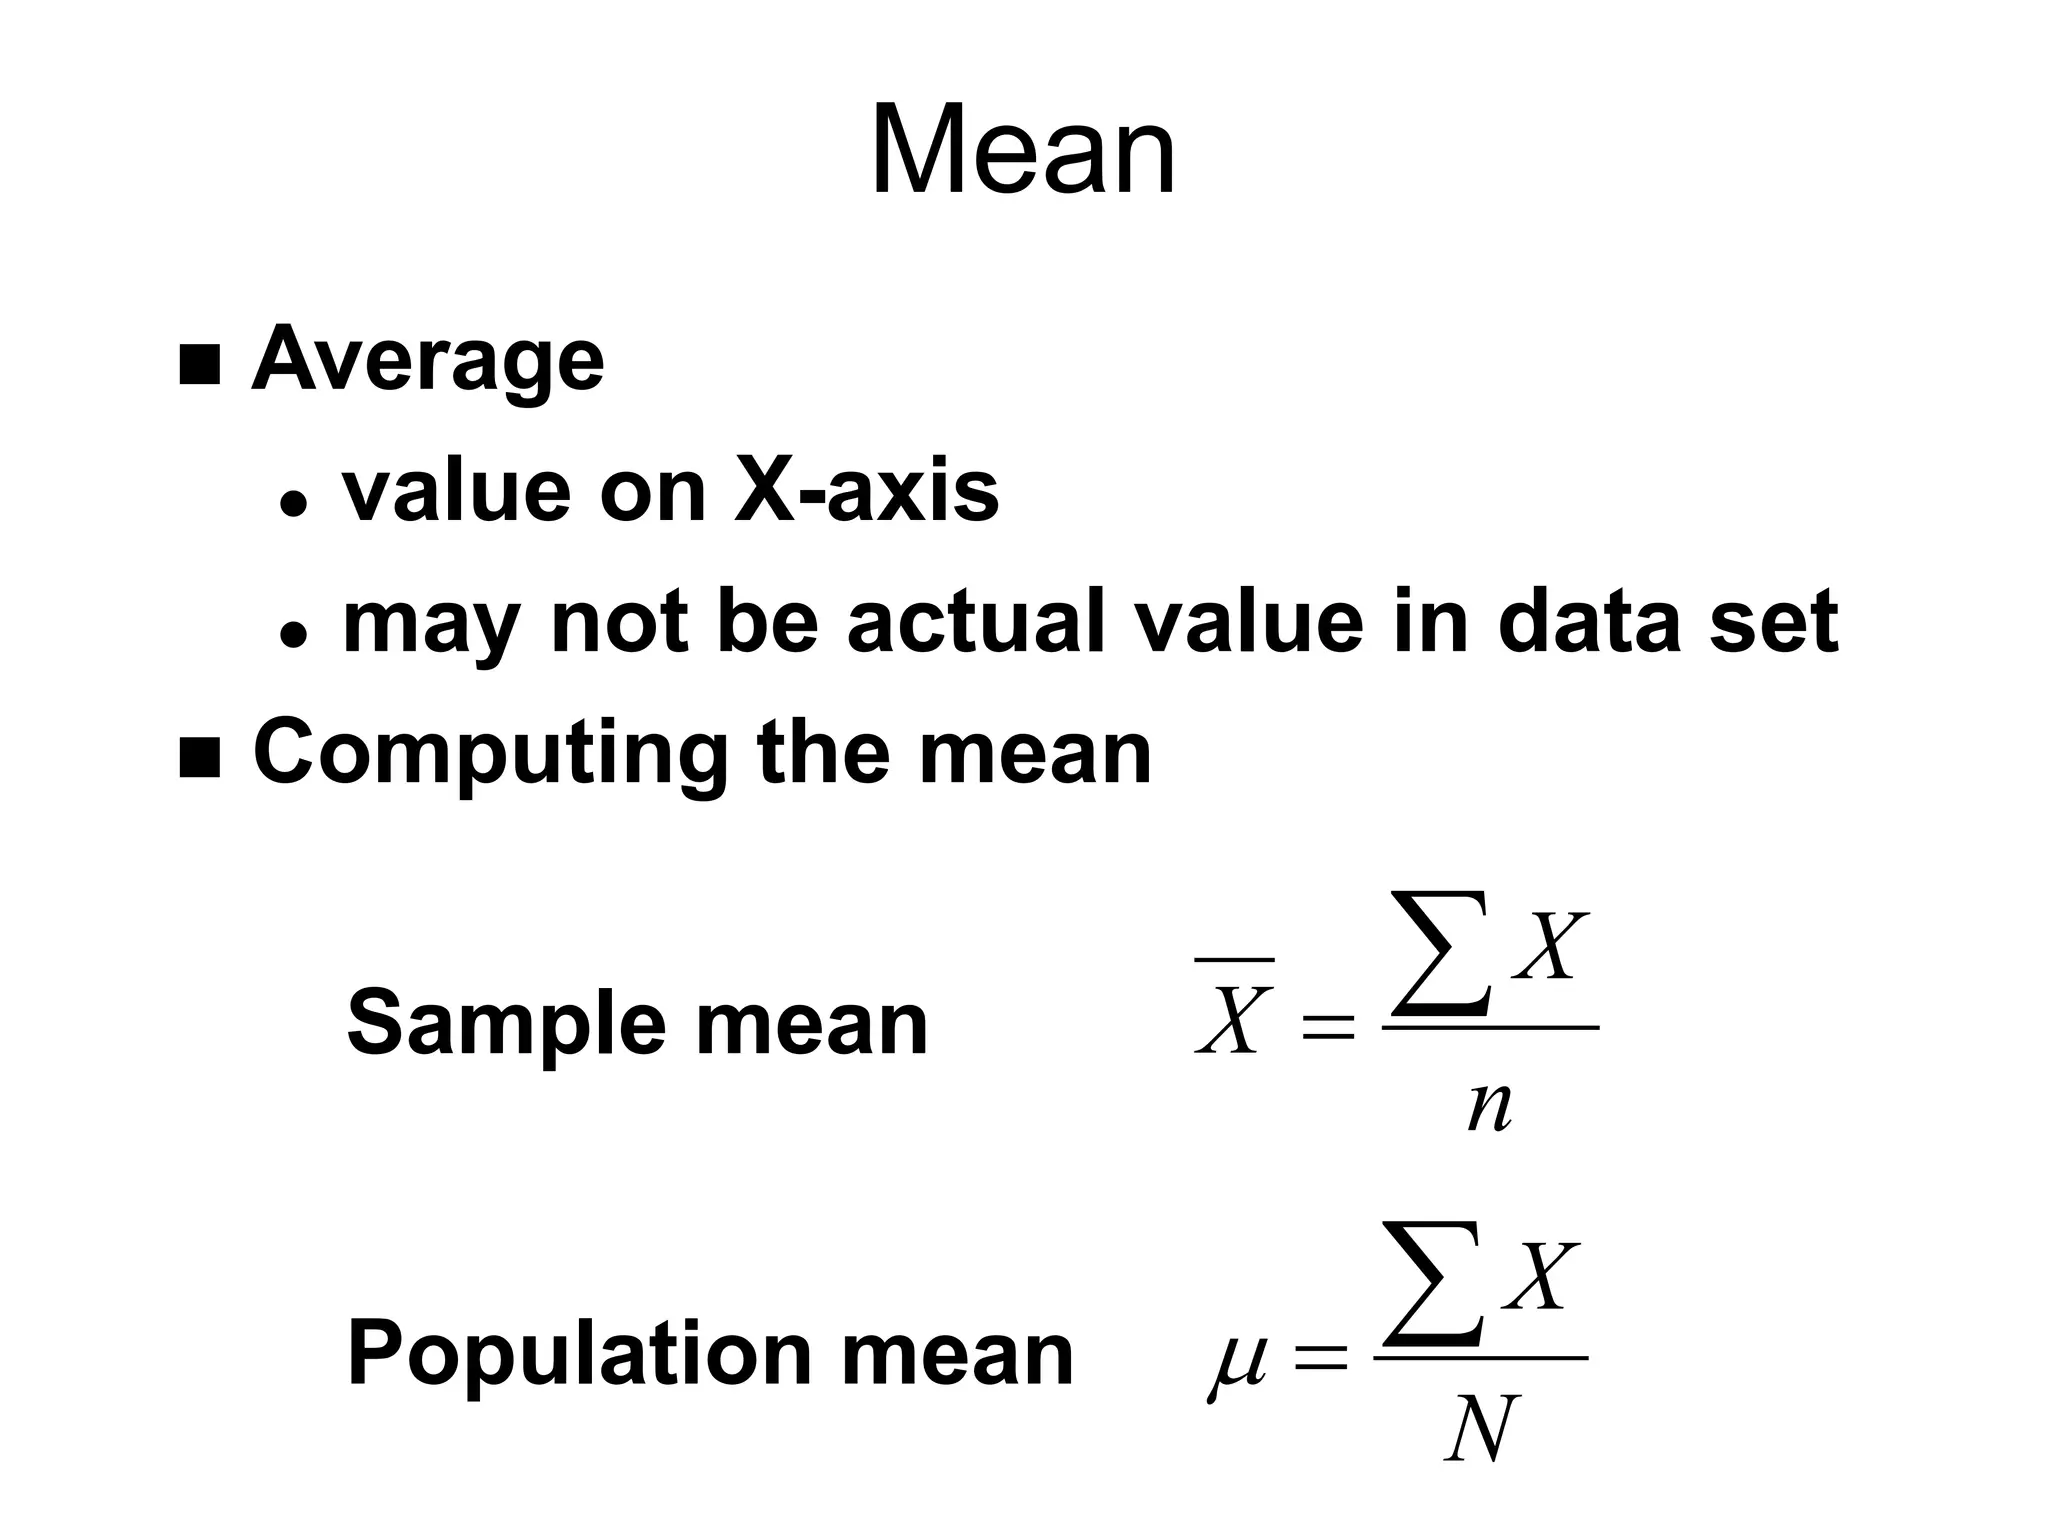
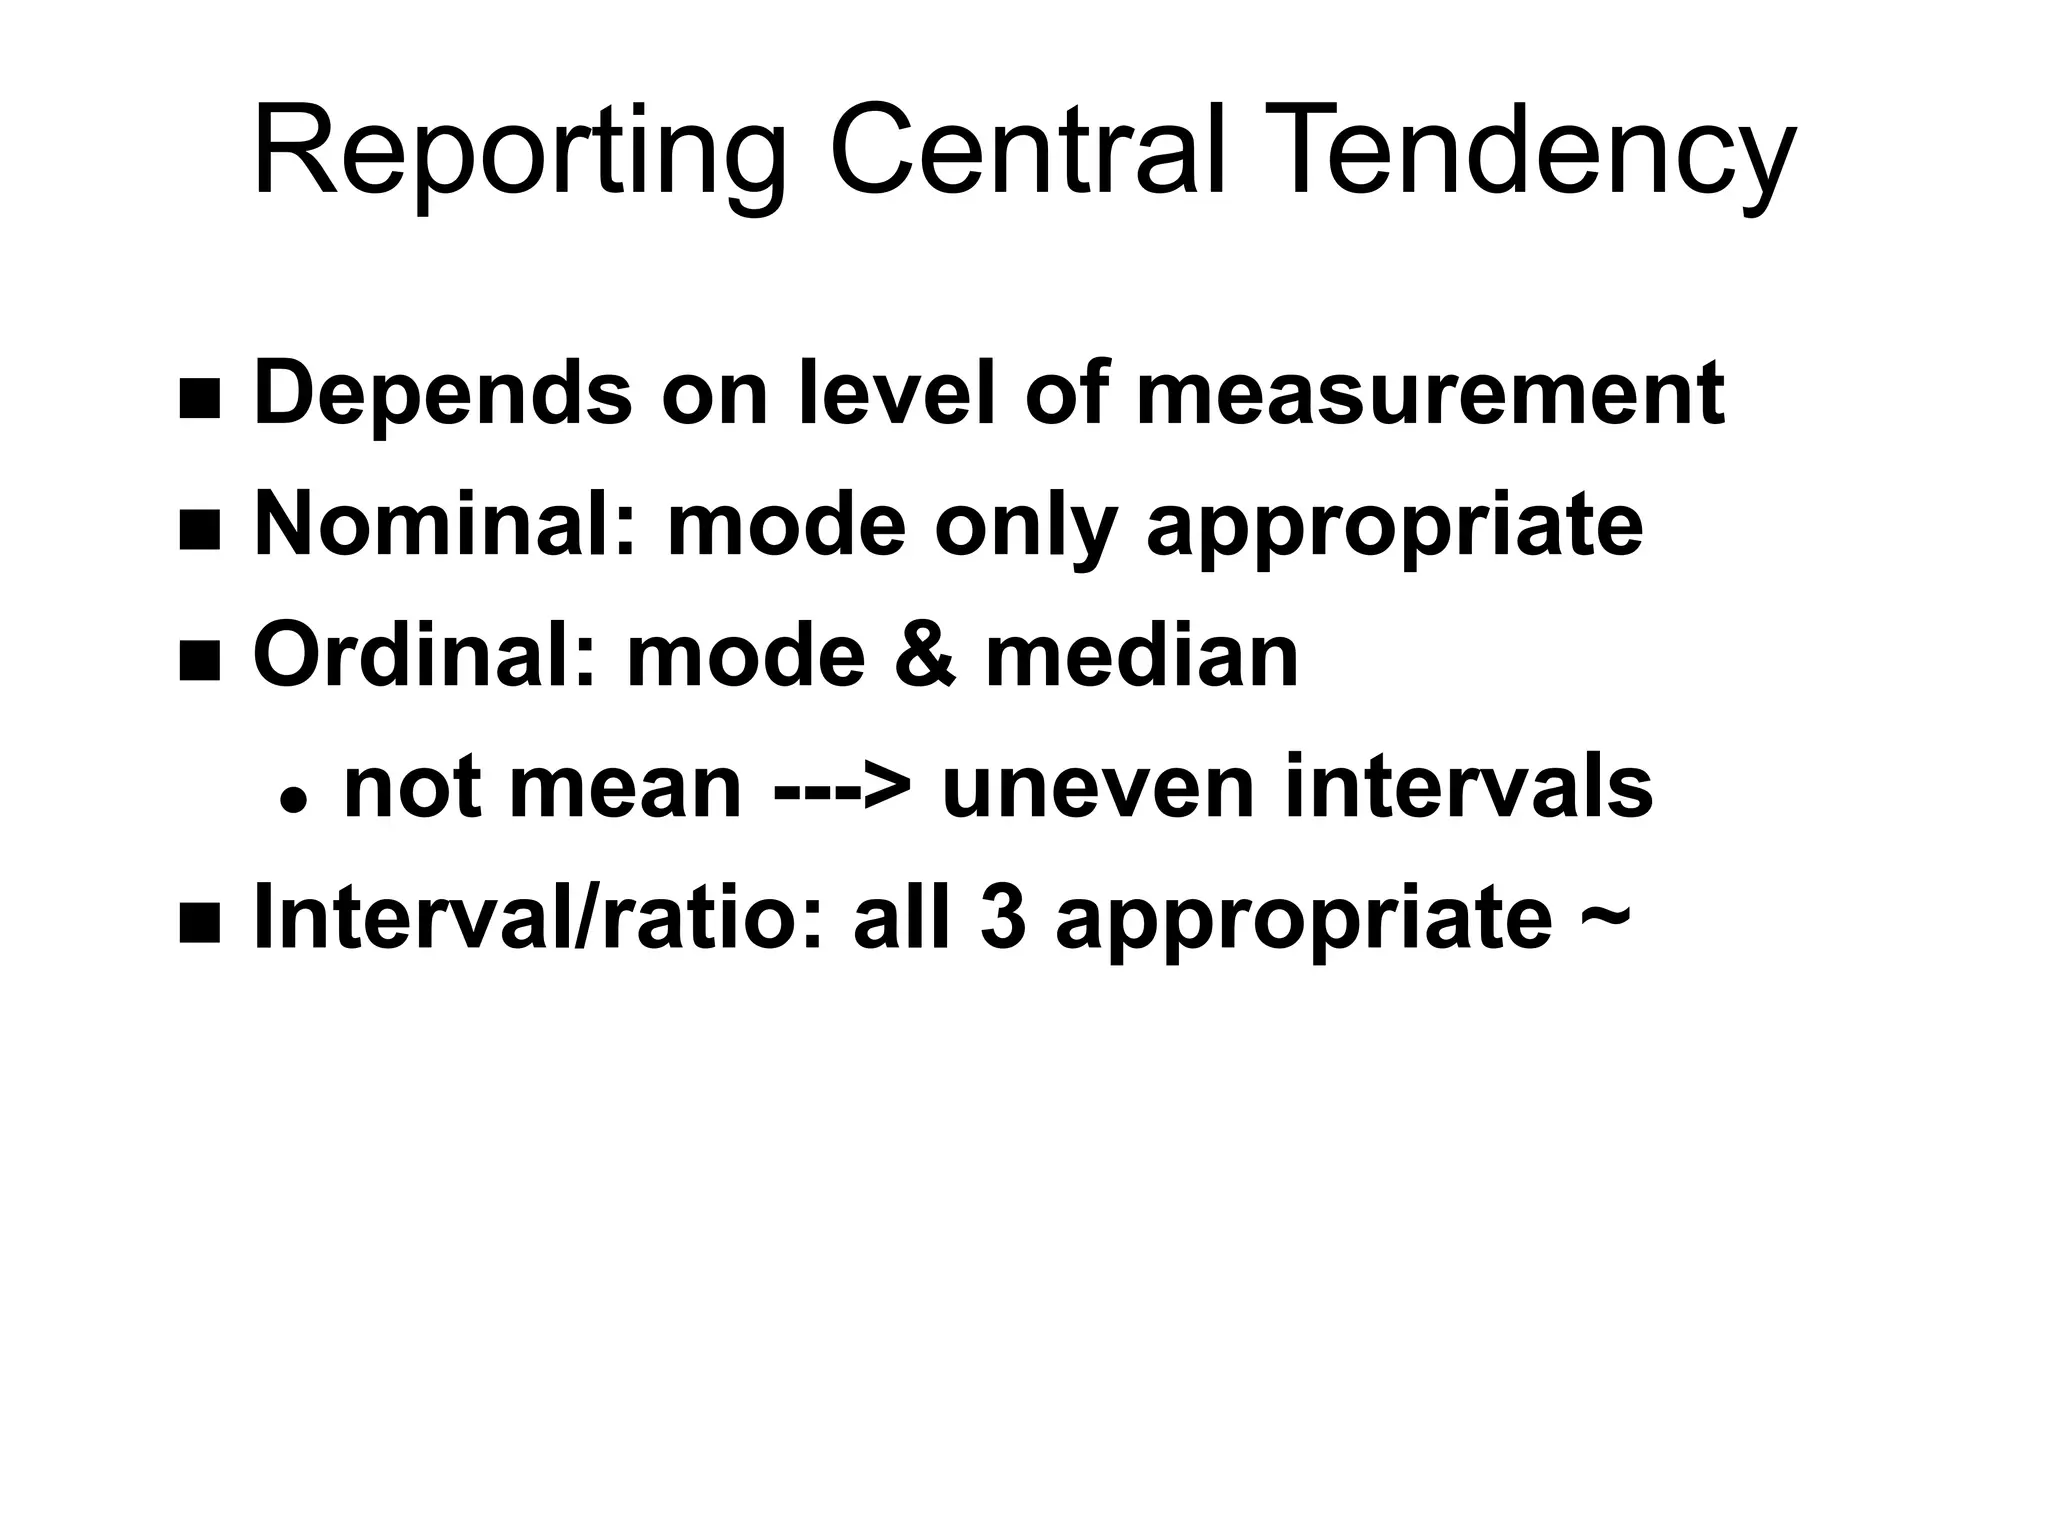
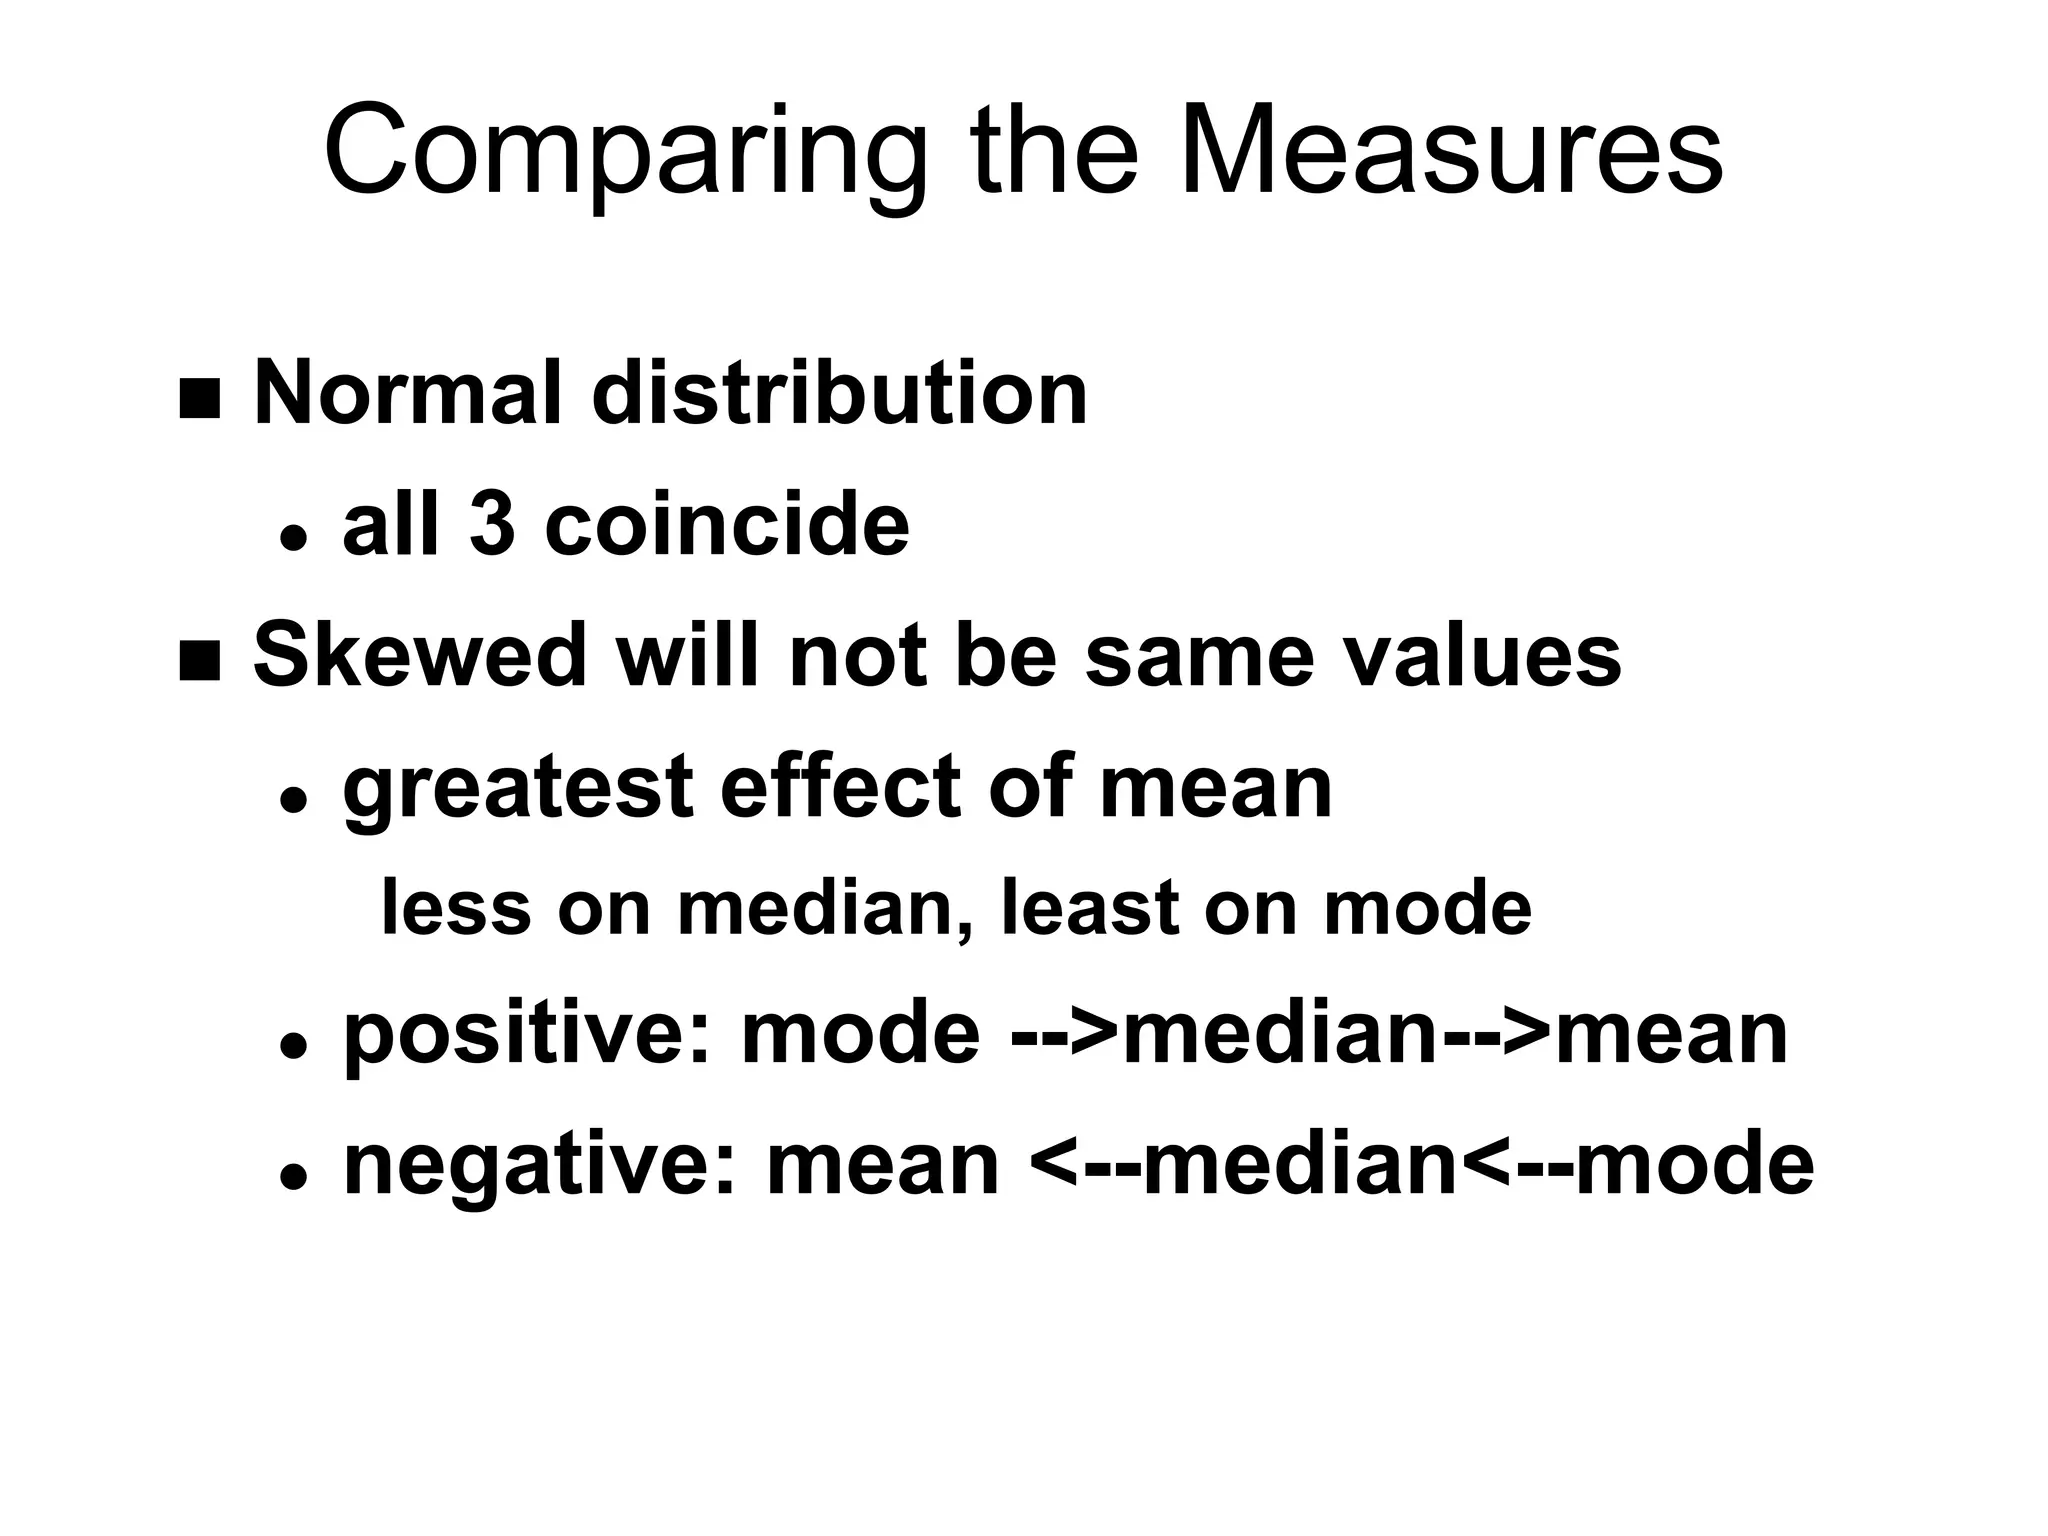
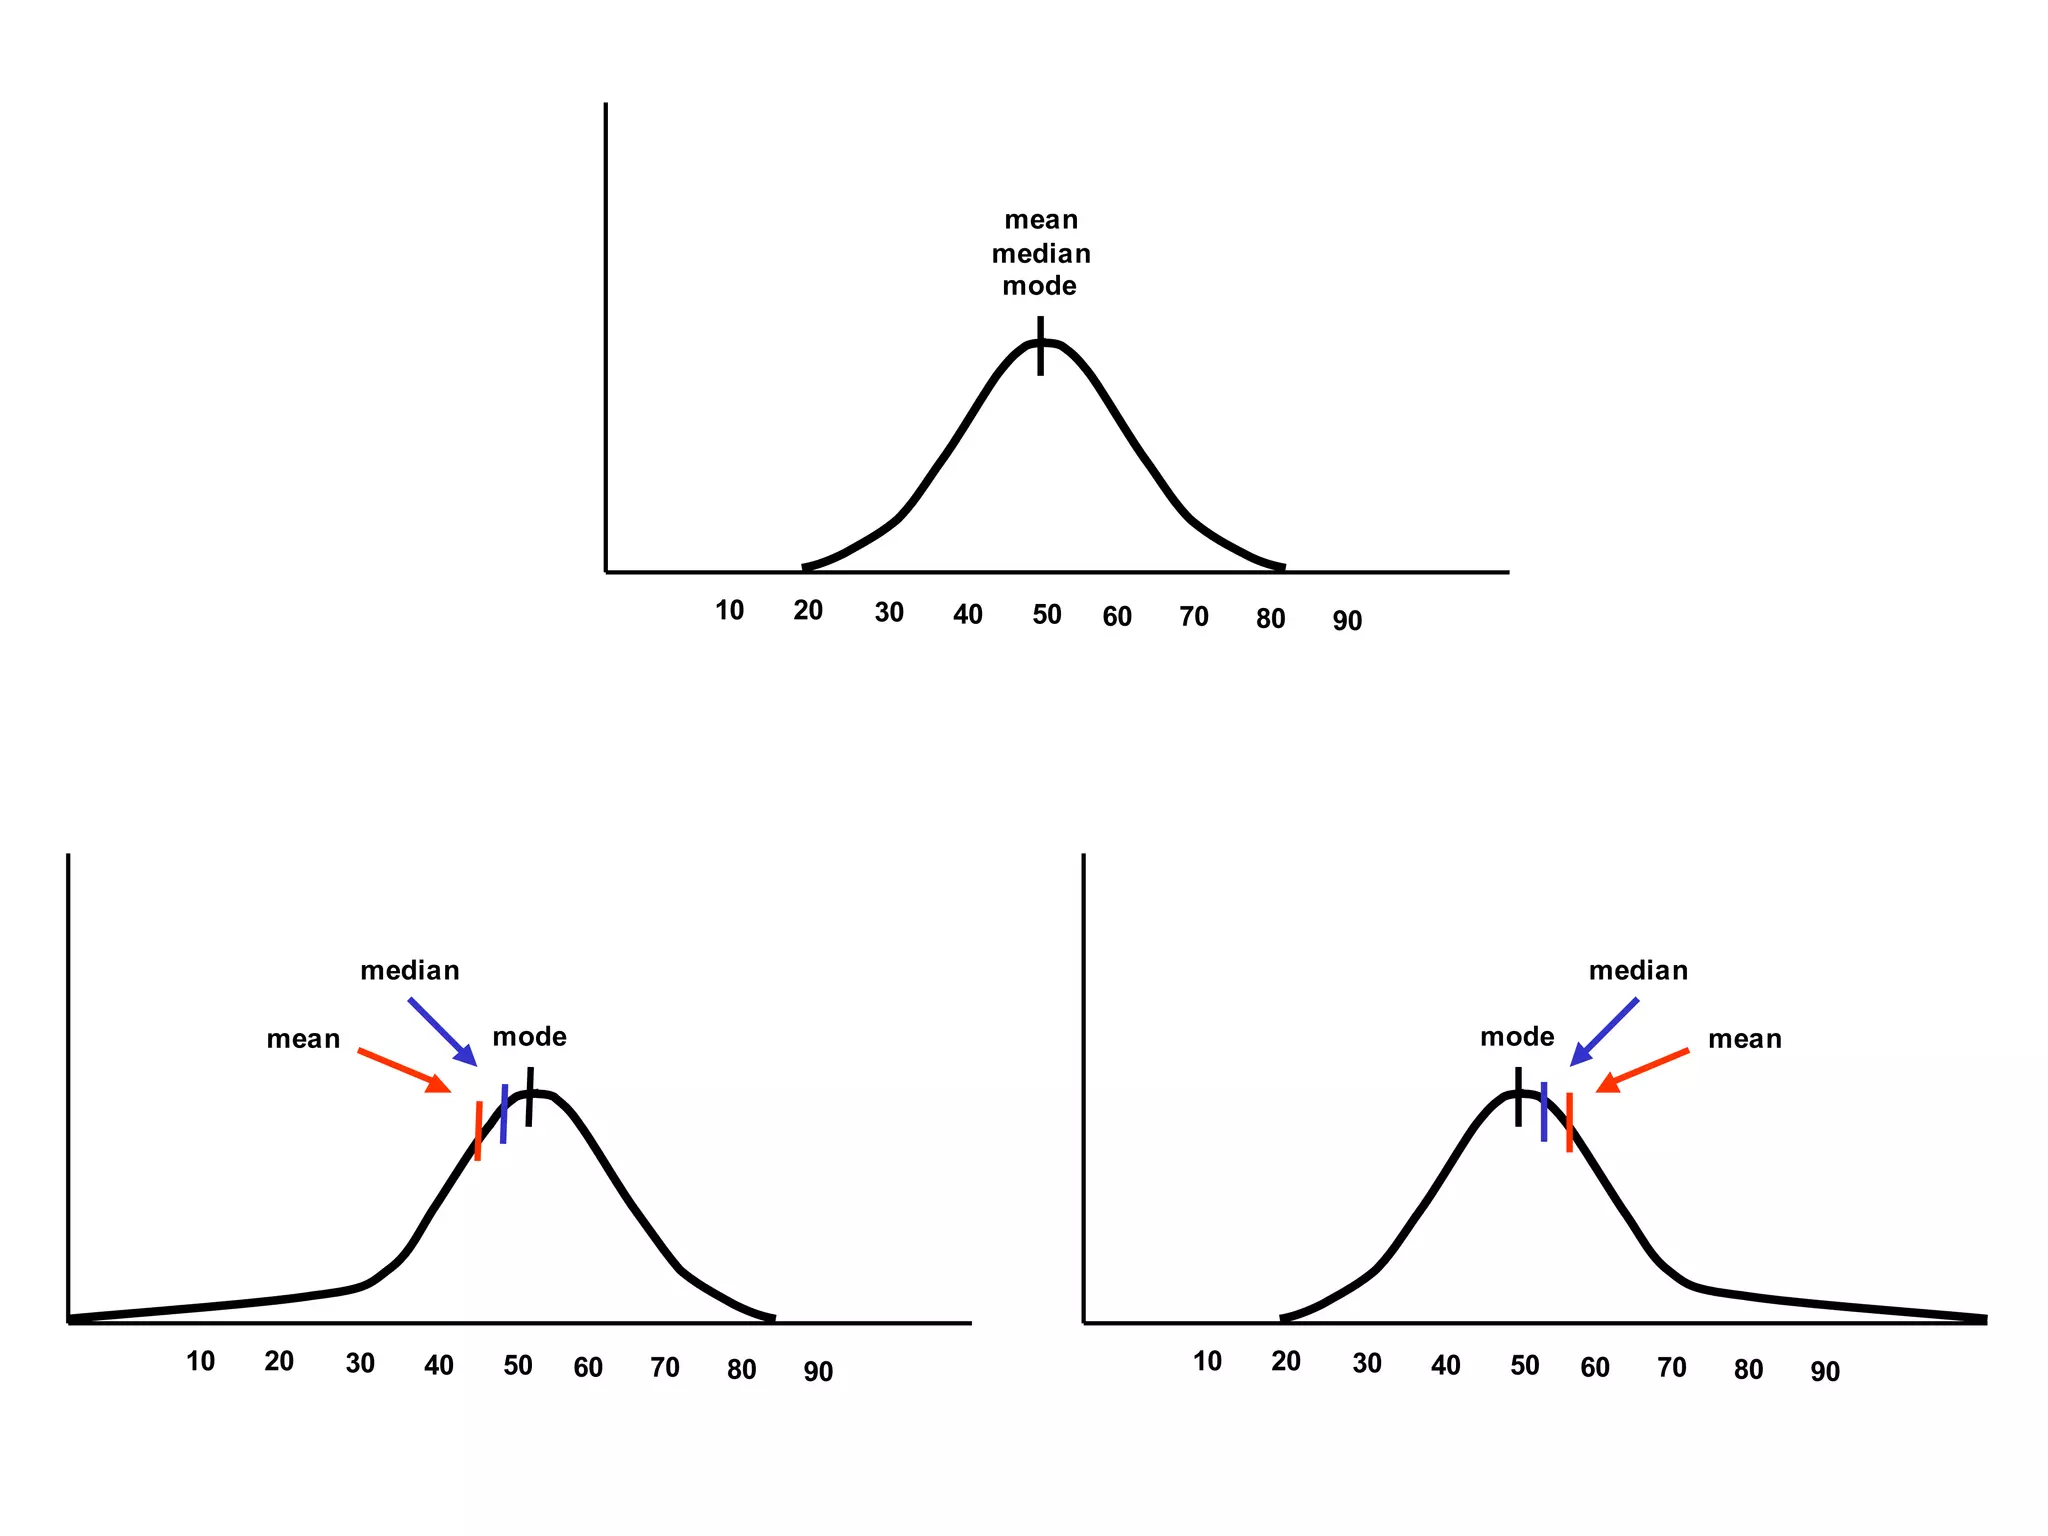

This document discusses measures of central tendency, which convey the most information about distributions. The three main measures are the mode, median, and mean. The mode is the most frequently occurring value. The median is the midpoint value when data are ordered from smallest to largest. The mean is the average value. Which measure is most appropriate depends on the level of measurement and intent of the communication. The mode is suitable for any level, while the median and mean are best for interval/ratio data. These measures may differ depending on the shape of the distribution.