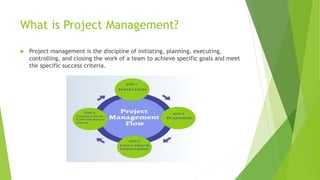
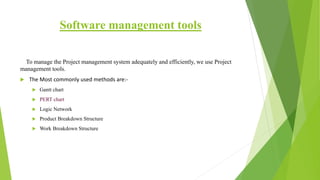
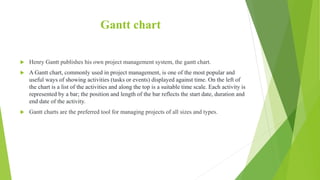
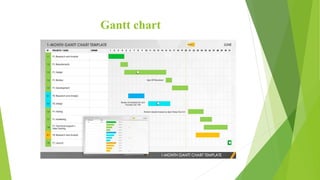
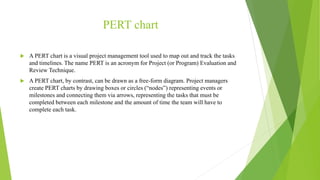
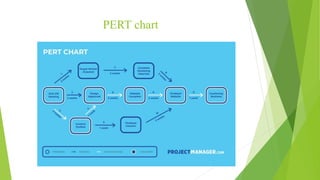
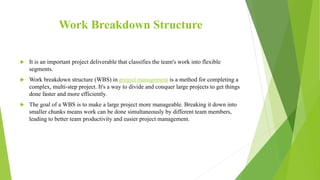
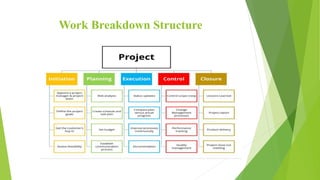
SOFTWARE PROJECT MANAGEMENT TOOLS
What is Project Management?
 Project management is the discipline of initiating, planning, executing,
controlling, and closing the work of a team to achieve specific goals and meet
the specific success criteria.
Software management tools
To manage the Project management system adequately and efficiently, we use Project
management tools.
 The Most commonly used methods are:-
 Gantt chart
 PERT chart
 Logic Network
 Product Breakdown Structure
 Work Breakdown Structure
Gantt chart
 Henry Gantt publishes his own project management system, the gantt chart.
 A Gantt chart, commonly used in project management, is one of the most popular and
useful ways of showing activities (tasks or events) displayed against time. On the left of
the chart is a list of the activities and along the top is a suitable time scale. Each activity is
represented by a bar; the position and length of the bar reflects the start date, duration and
end date of the activity.
 Gantt charts are the preferred tool for managing projects of all sizes and types.
Gantt chart
PERT chart
 A PERT chart is a visual project management tool used to map out and track the tasks
and timelines. The name PERT is an acronym for Project (or Program) Evaluation and
Review Technique.
 A PERT chart, by contrast, can be drawn as a free-form diagram. Project managers
create PERT charts by drawing boxes or circles (“nodes”) representing events or
milestones and connecting them via arrows, representing the tasks that must be
completed between each milestone and the amount of time the team will have to
complete each task.
PERT chart
Logic Network
 A Logic Network shows the sequence of activities in a project across time.
 It indicates which activity logically precedes or follows another.
 Create a Start (left) and End (right) sticky note and put them on a whiteboard.
 Join the notes with an arrow in and out; some may have more than one arrow.
 All connecting lines on a network enter at the left (beginning) of the activity box
exit at the right (ending).
 Unconnected lines are not allowed.
Logic Network
Product Breakdown Structure
 A product breakdown structure is an effective tool that details the physical
components of a particular product, or system, under consideration.
 Product Breakdown Structure (BBS) is a management tool and necessary a part of the
project designing.
 It's a task-oriented system for subdividing a project into product parts.
 The product breakdown structure describes subtasks or work packages and represents
the connection between work packages.
Work Breakdown Structure
 It is an important project deliverable that classifies the team's work into flexible
segments.
 Work breakdown structure (WBS) in project management is a method for completing a
complex, multi-step project. It's a way to divide and conquer large projects to get things
done faster and more efficiently.
 The goal of a WBS is to make a large project more manageable. Breaking it down into
smaller chunks means work can be done simultaneously by different team members,
leading to better team productivity and easier project management.
Work Breakdown Structure
THANK YOU

Software project management tools

  • 1.
  • 2.
    What is ProjectManagement?  Project management is the discipline of initiating, planning, executing, controlling, and closing the work of a team to achieve specific goals and meet the specific success criteria.
  • 3.
    Software management tools Tomanage the Project management system adequately and efficiently, we use Project management tools.  The Most commonly used methods are:-  Gantt chart  PERT chart  Logic Network  Product Breakdown Structure  Work Breakdown Structure
  • 4.
    Gantt chart  HenryGantt publishes his own project management system, the gantt chart.  A Gantt chart, commonly used in project management, is one of the most popular and useful ways of showing activities (tasks or events) displayed against time. On the left of the chart is a list of the activities and along the top is a suitable time scale. Each activity is represented by a bar; the position and length of the bar reflects the start date, duration and end date of the activity.  Gantt charts are the preferred tool for managing projects of all sizes and types.
  • 5.
  • 6.
    PERT chart  APERT chart is a visual project management tool used to map out and track the tasks and timelines. The name PERT is an acronym for Project (or Program) Evaluation and Review Technique.  A PERT chart, by contrast, can be drawn as a free-form diagram. Project managers create PERT charts by drawing boxes or circles (“nodes”) representing events or milestones and connecting them via arrows, representing the tasks that must be completed between each milestone and the amount of time the team will have to complete each task.
  • 7.
  • 8.
    Logic Network  ALogic Network shows the sequence of activities in a project across time.  It indicates which activity logically precedes or follows another.  Create a Start (left) and End (right) sticky note and put them on a whiteboard.  Join the notes with an arrow in and out; some may have more than one arrow.  All connecting lines on a network enter at the left (beginning) of the activity box exit at the right (ending).  Unconnected lines are not allowed.
  • 9.
  • 10.
    Product Breakdown Structure A product breakdown structure is an effective tool that details the physical components of a particular product, or system, under consideration.  Product Breakdown Structure (BBS) is a management tool and necessary a part of the project designing.  It's a task-oriented system for subdividing a project into product parts.  The product breakdown structure describes subtasks or work packages and represents the connection between work packages.
  • 11.
    Work Breakdown Structure It is an important project deliverable that classifies the team's work into flexible segments.  Work breakdown structure (WBS) in project management is a method for completing a complex, multi-step project. It's a way to divide and conquer large projects to get things done faster and more efficiently.  The goal of a WBS is to make a large project more manageable. Breaking it down into smaller chunks means work can be done simultaneously by different team members, leading to better team productivity and easier project management.
  • 12.
  • 13.