Downloaded 37 times
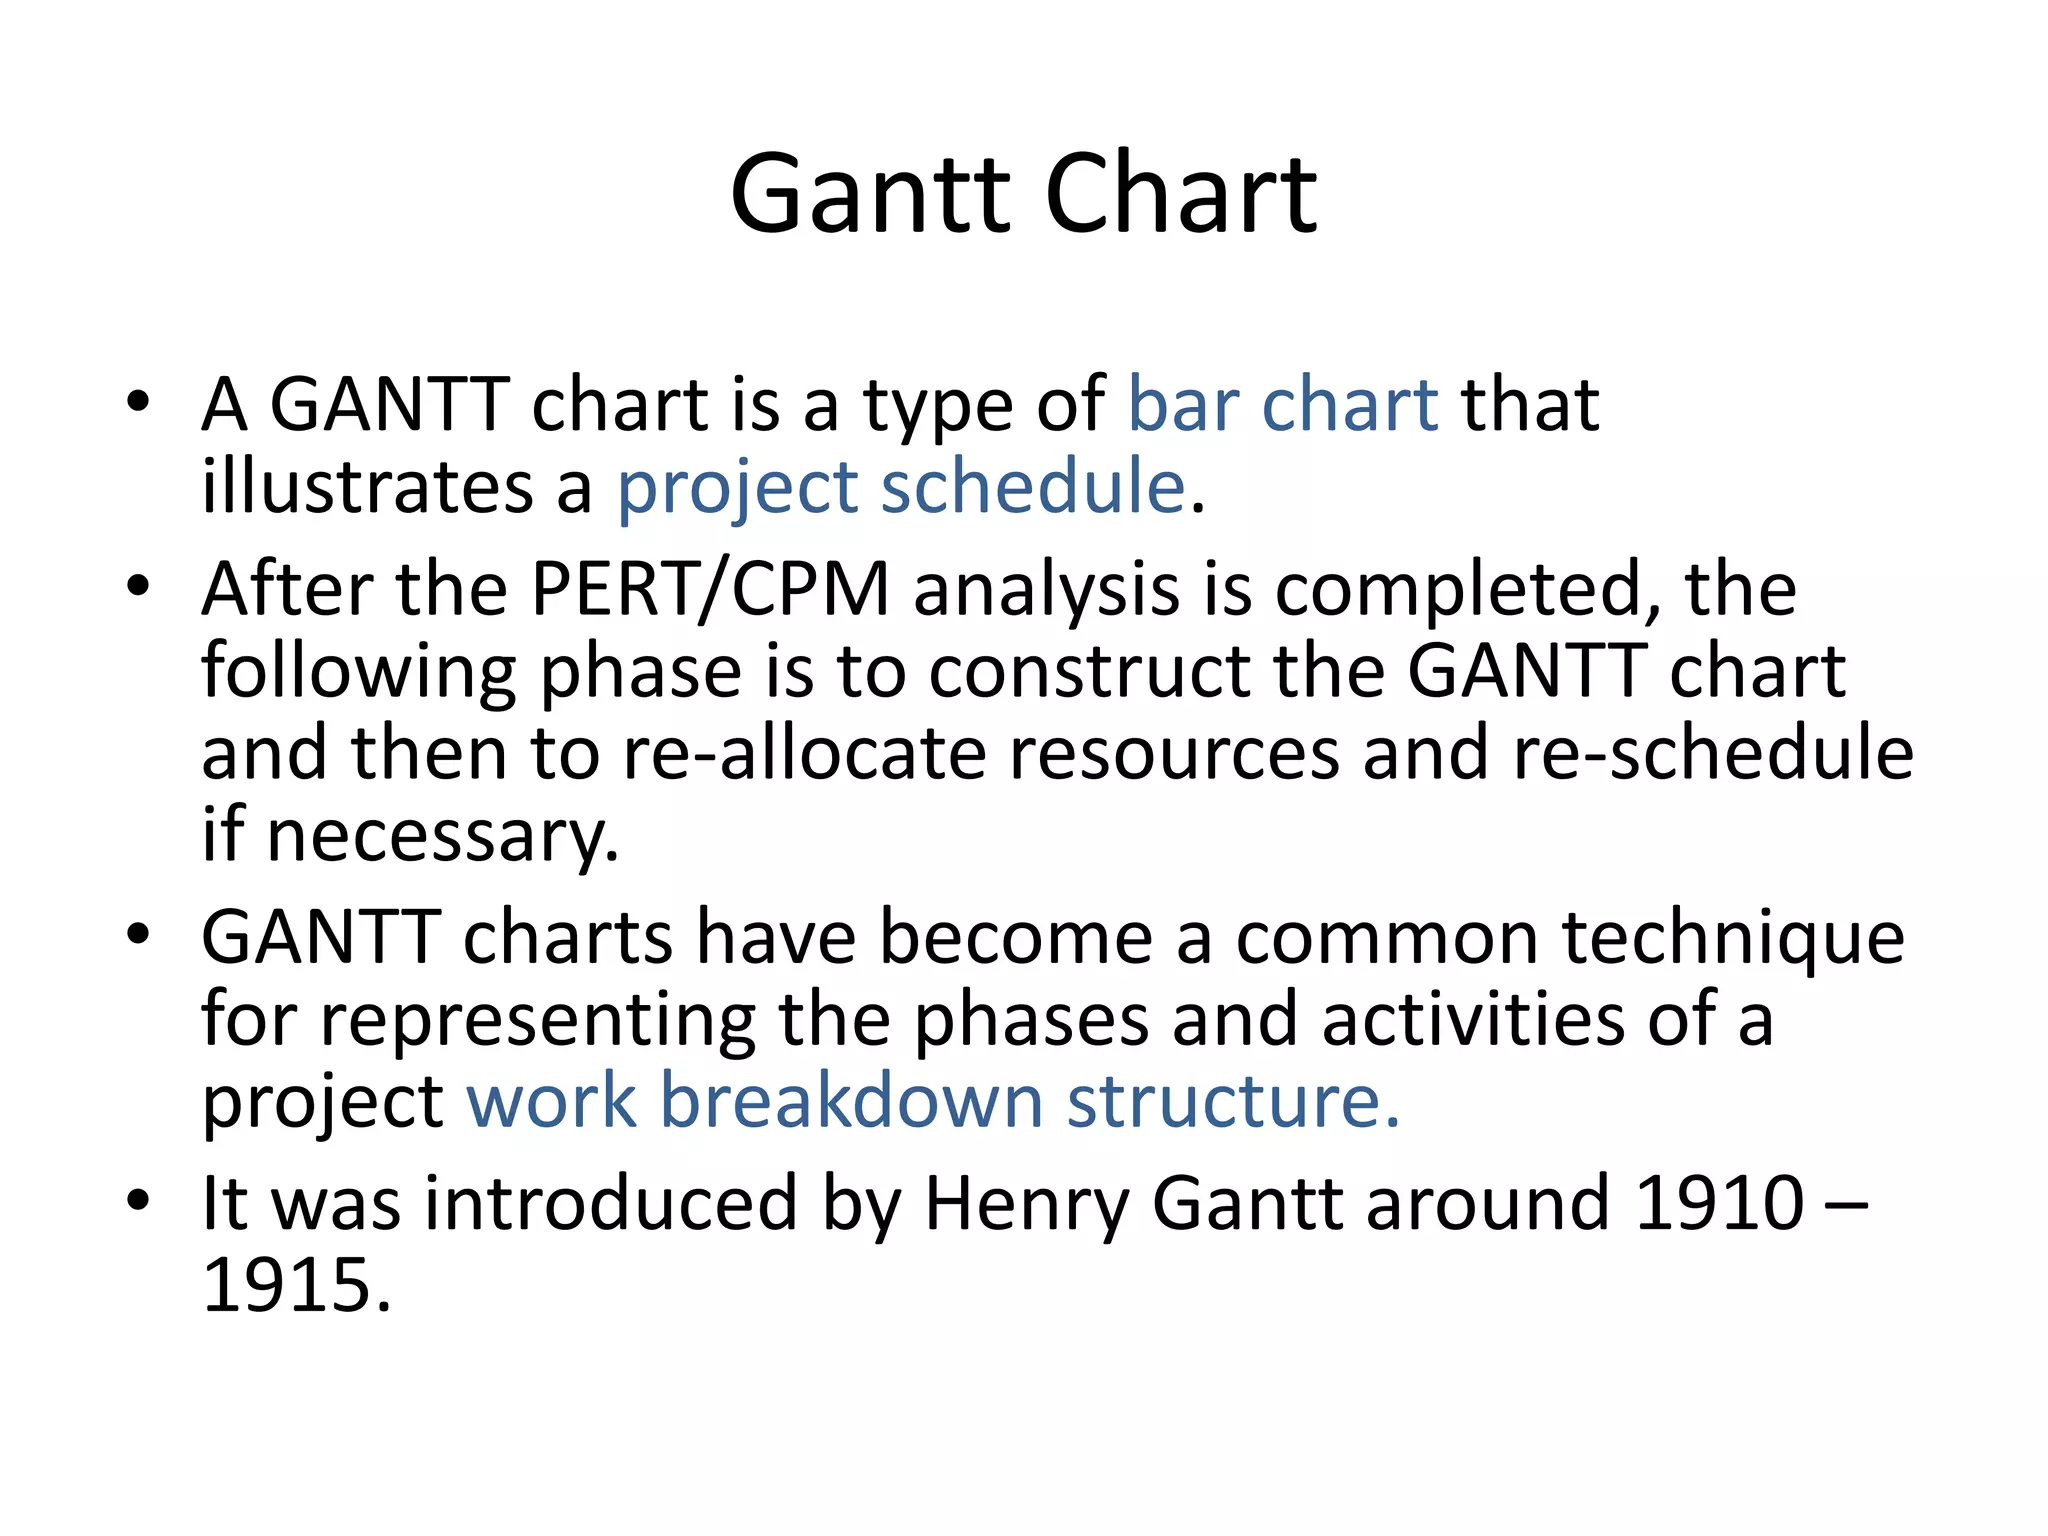
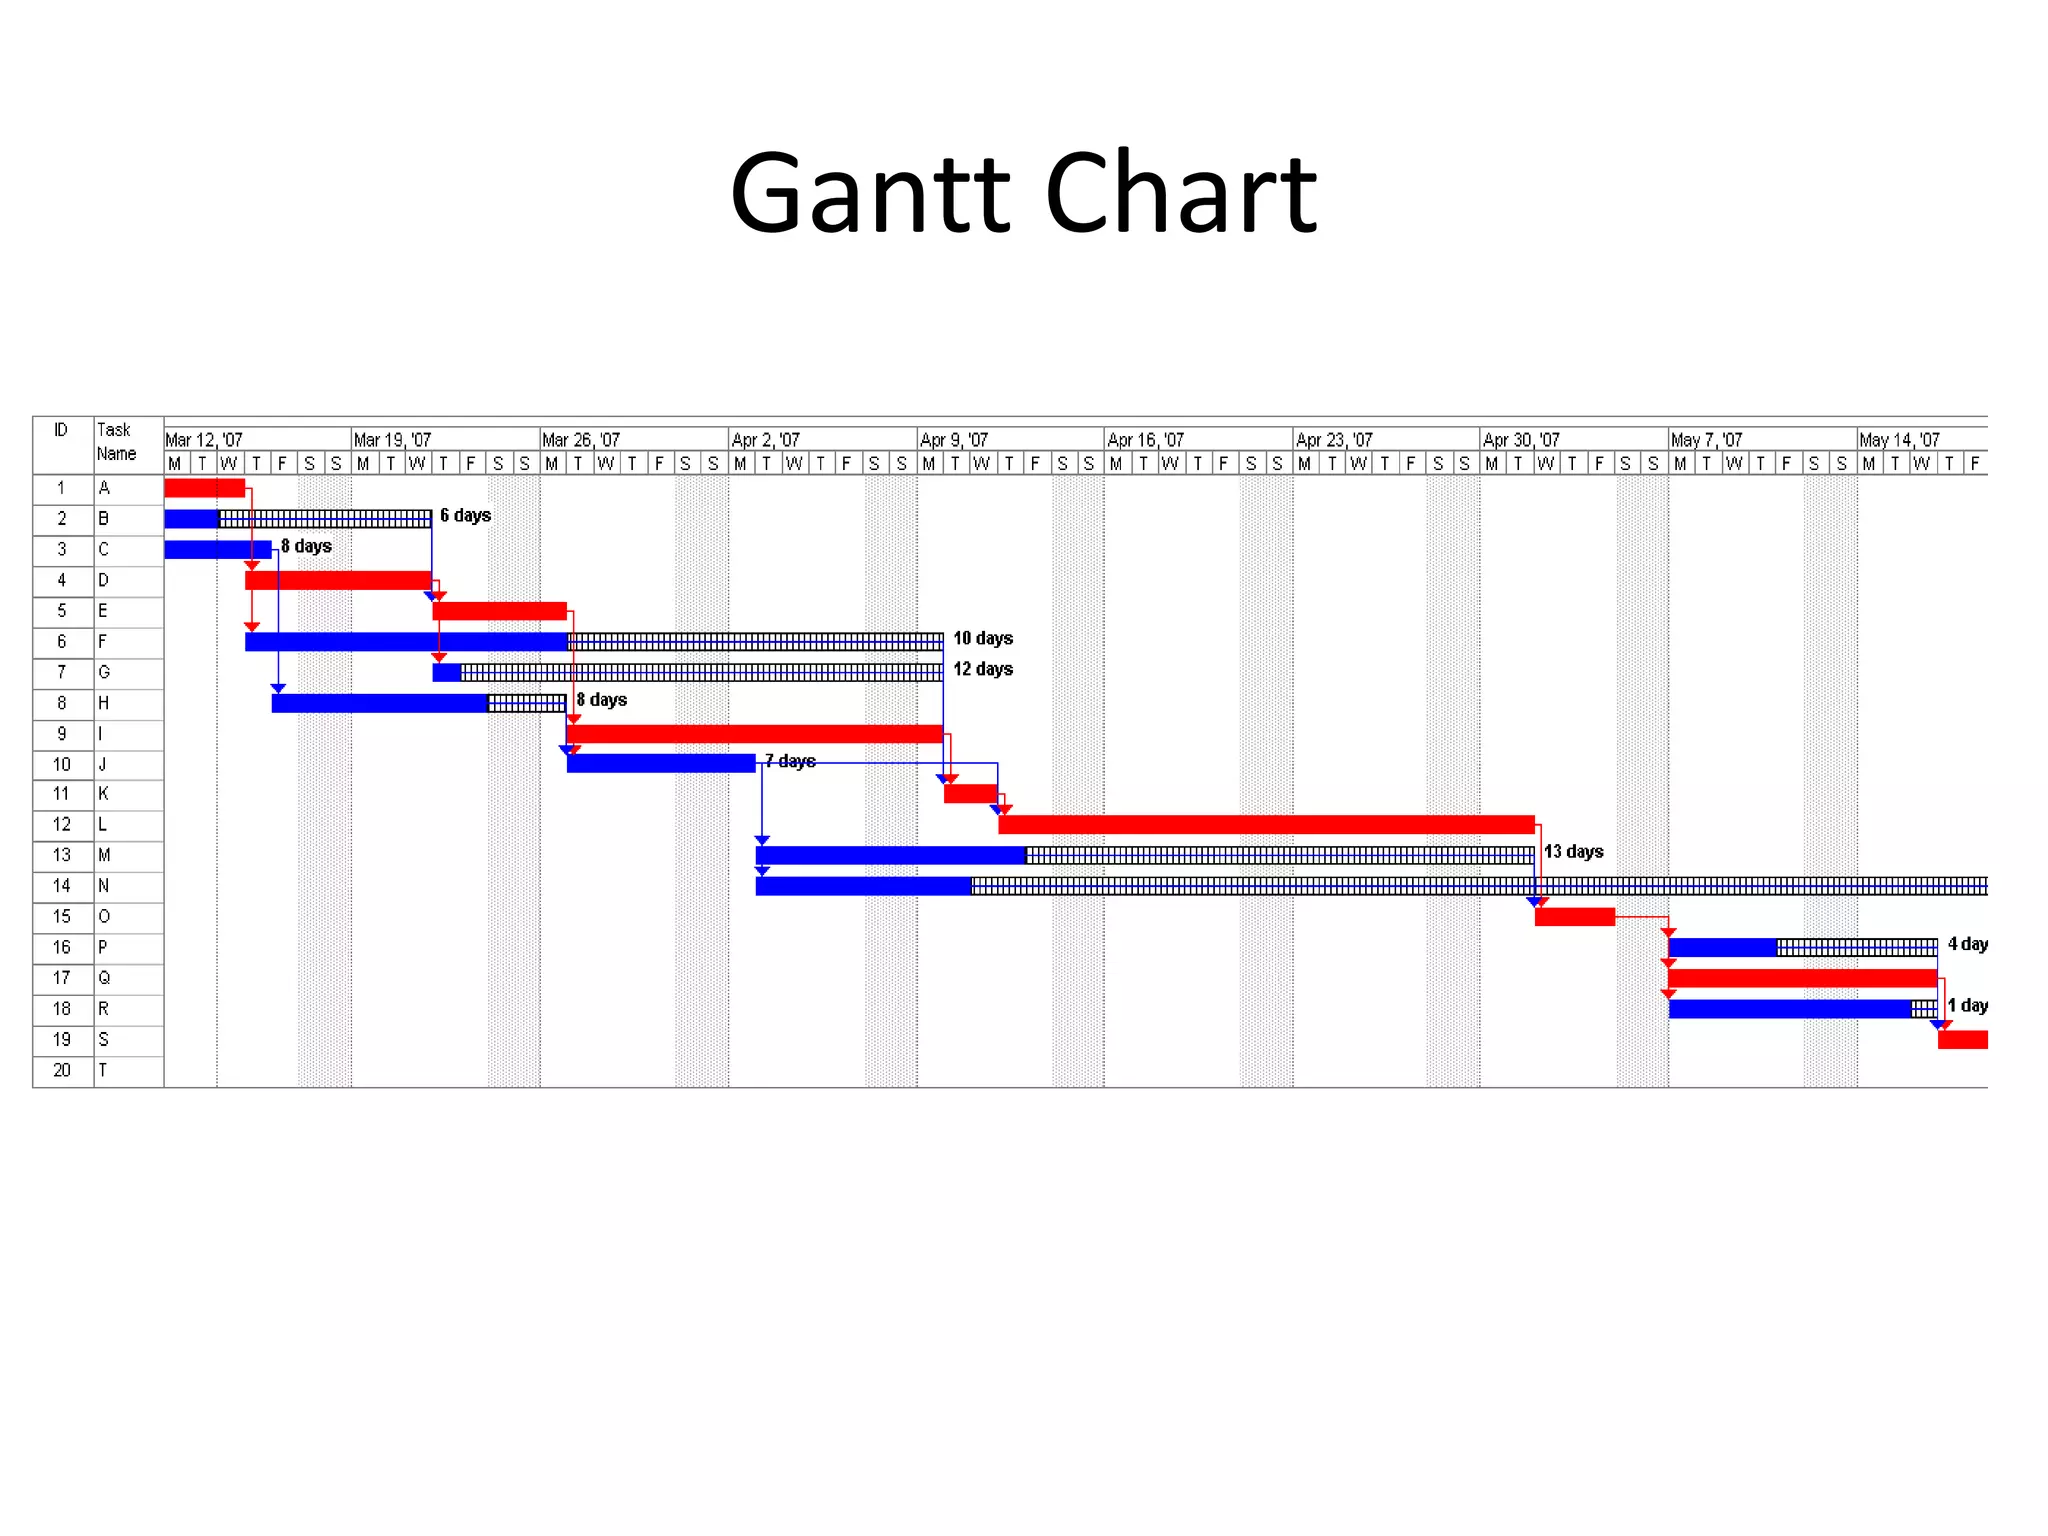
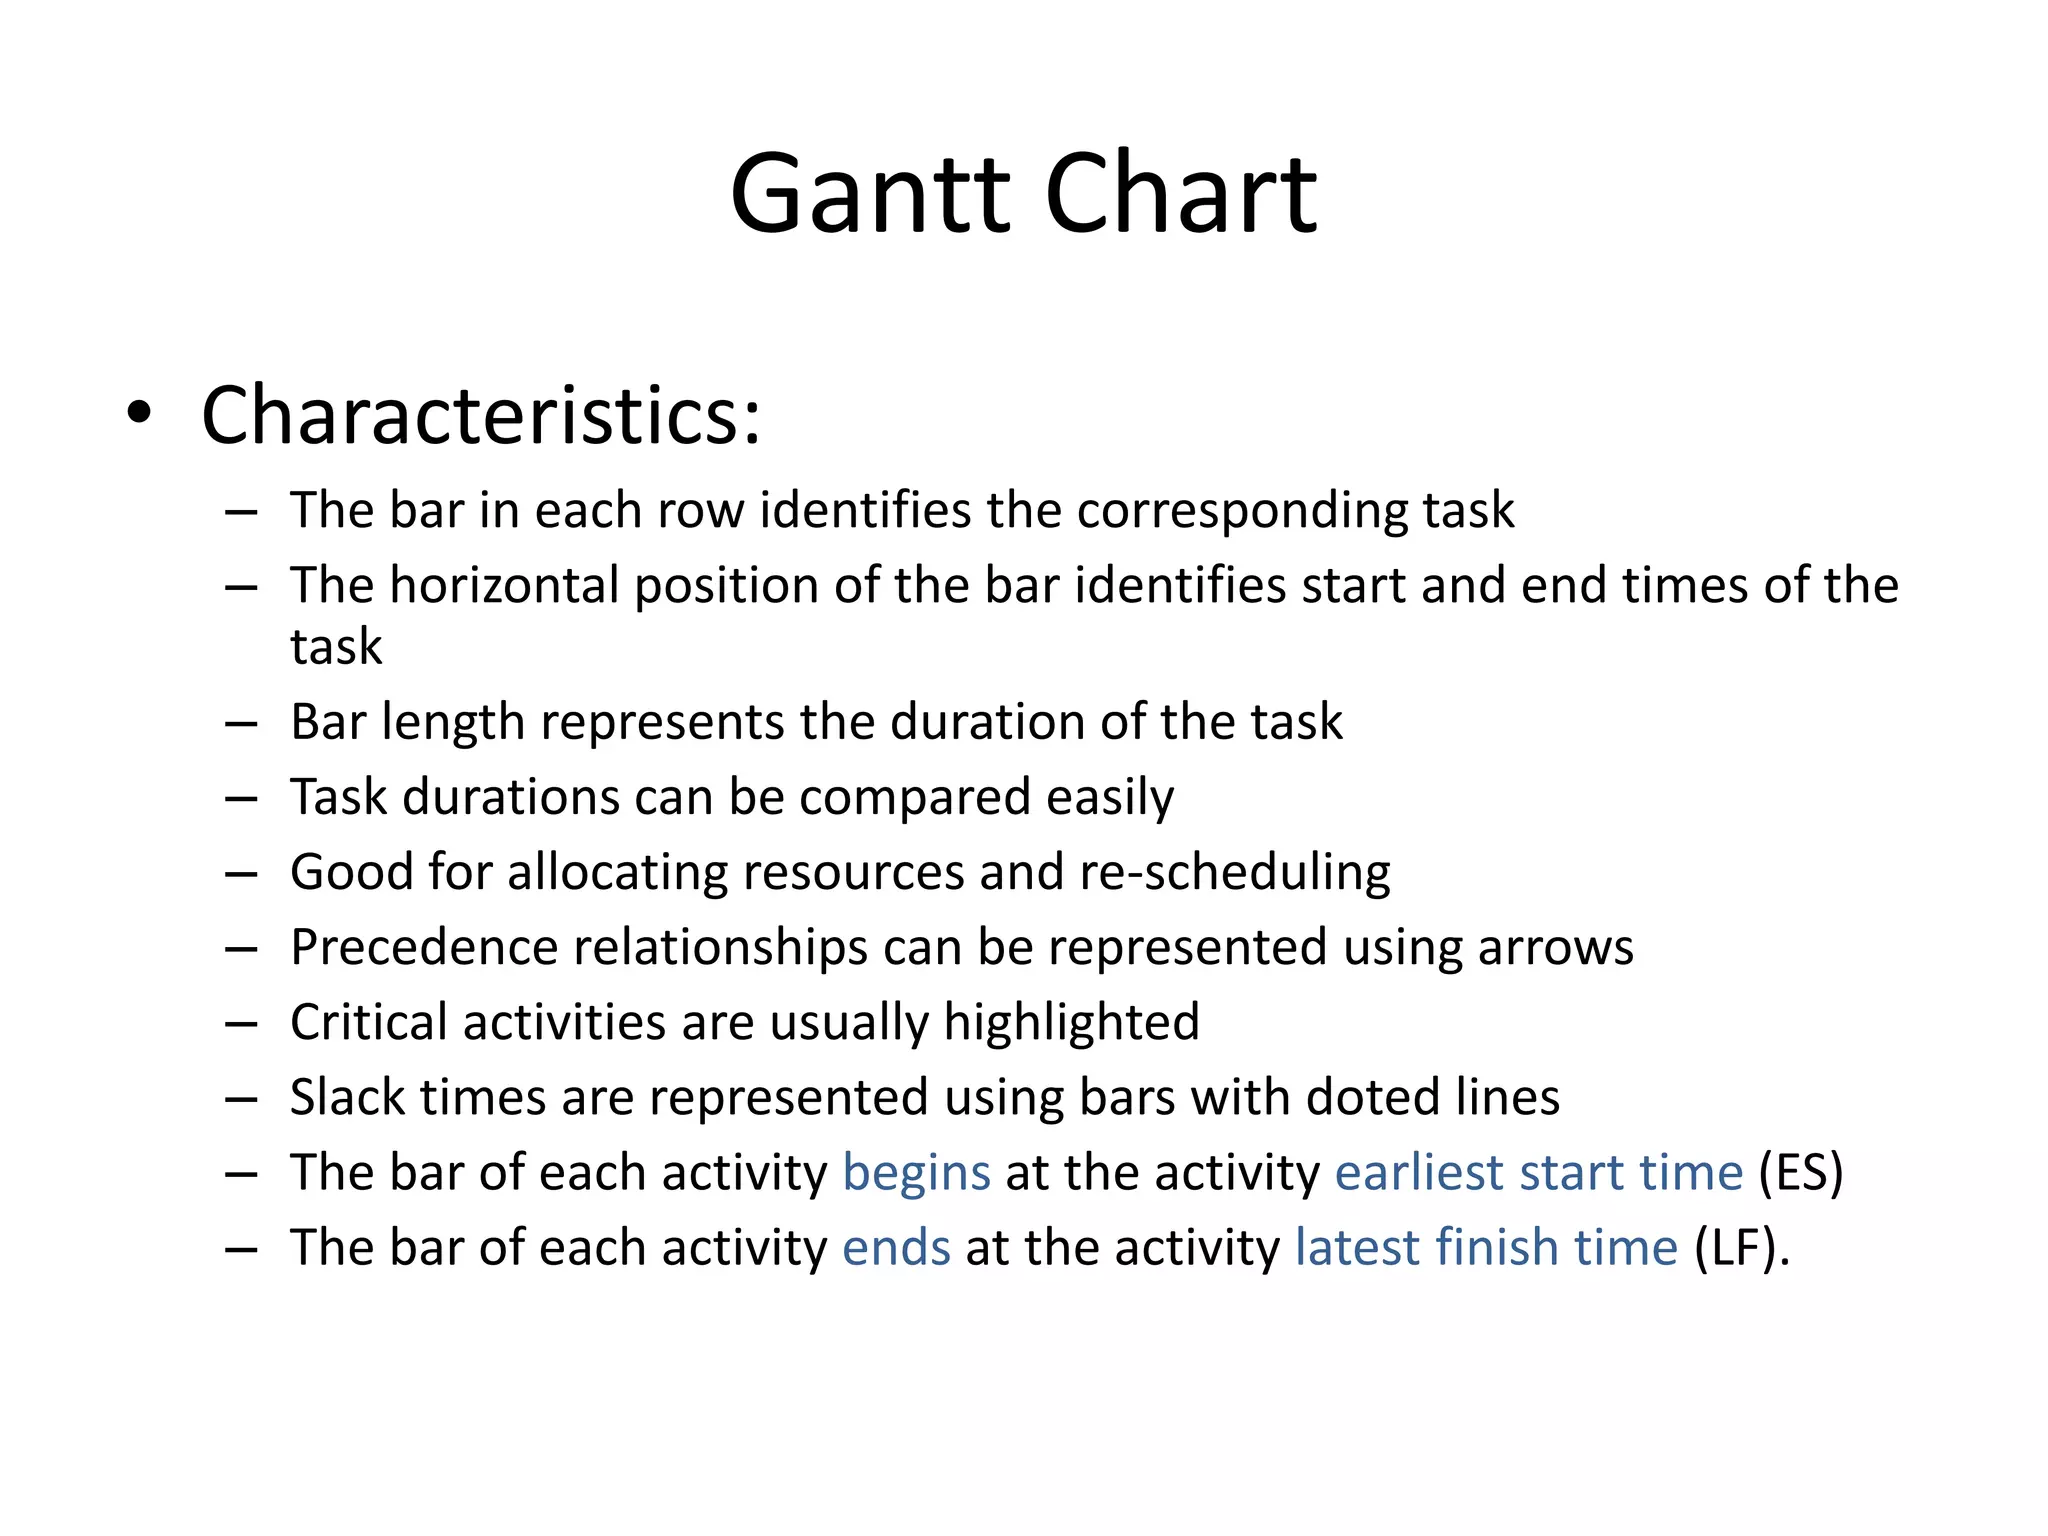
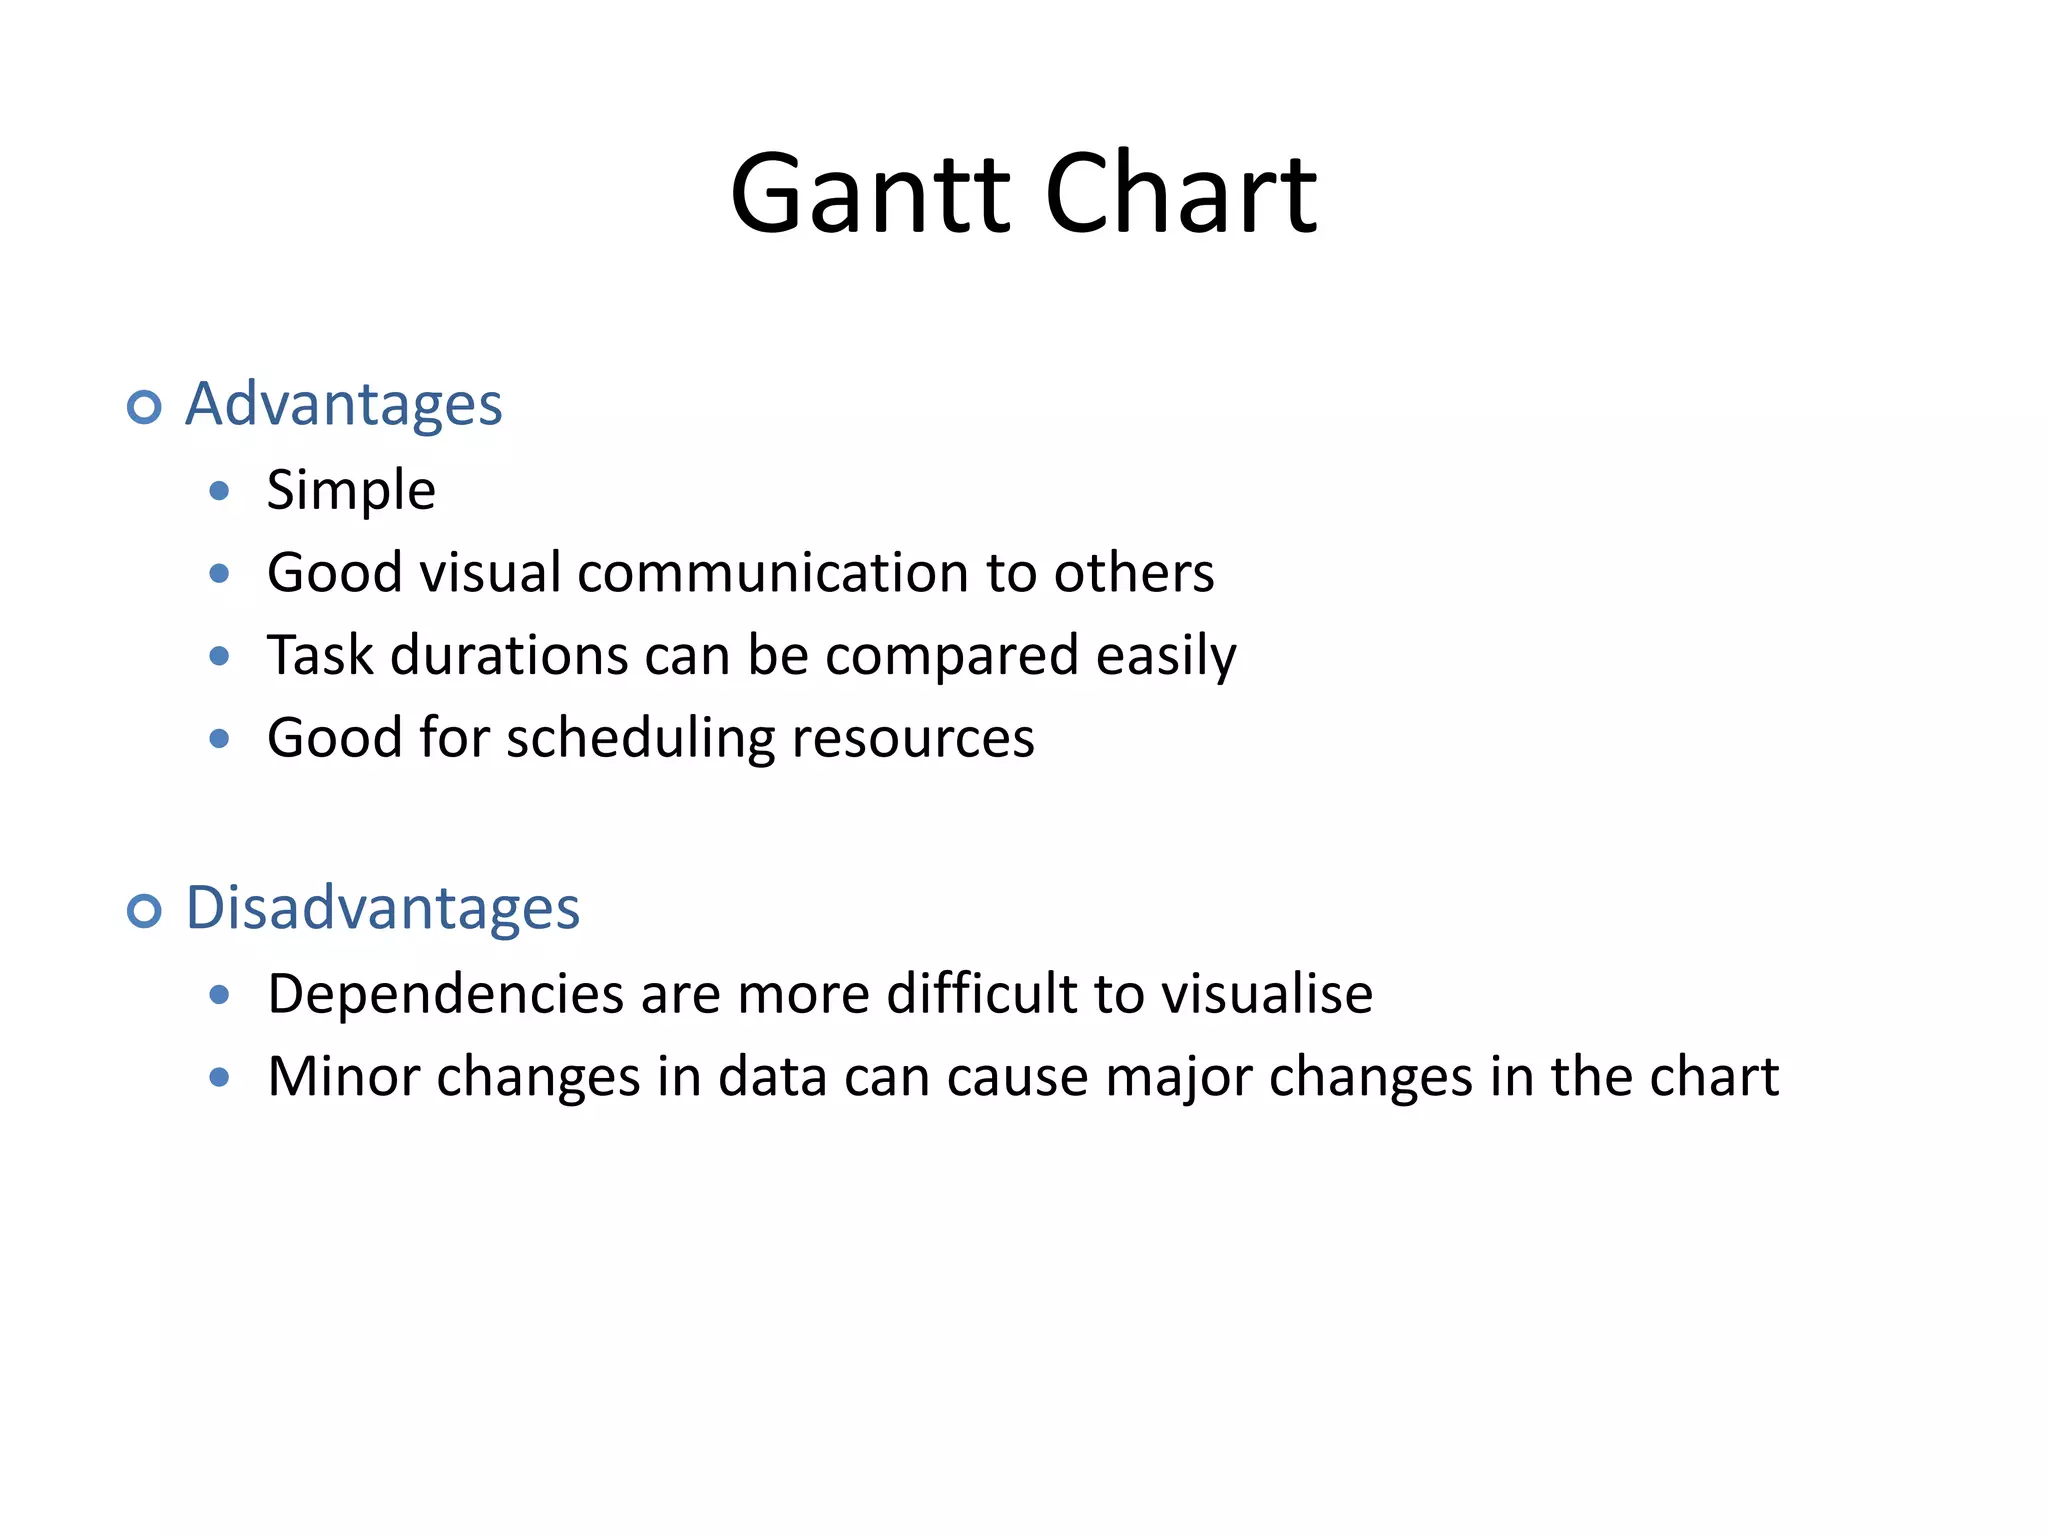
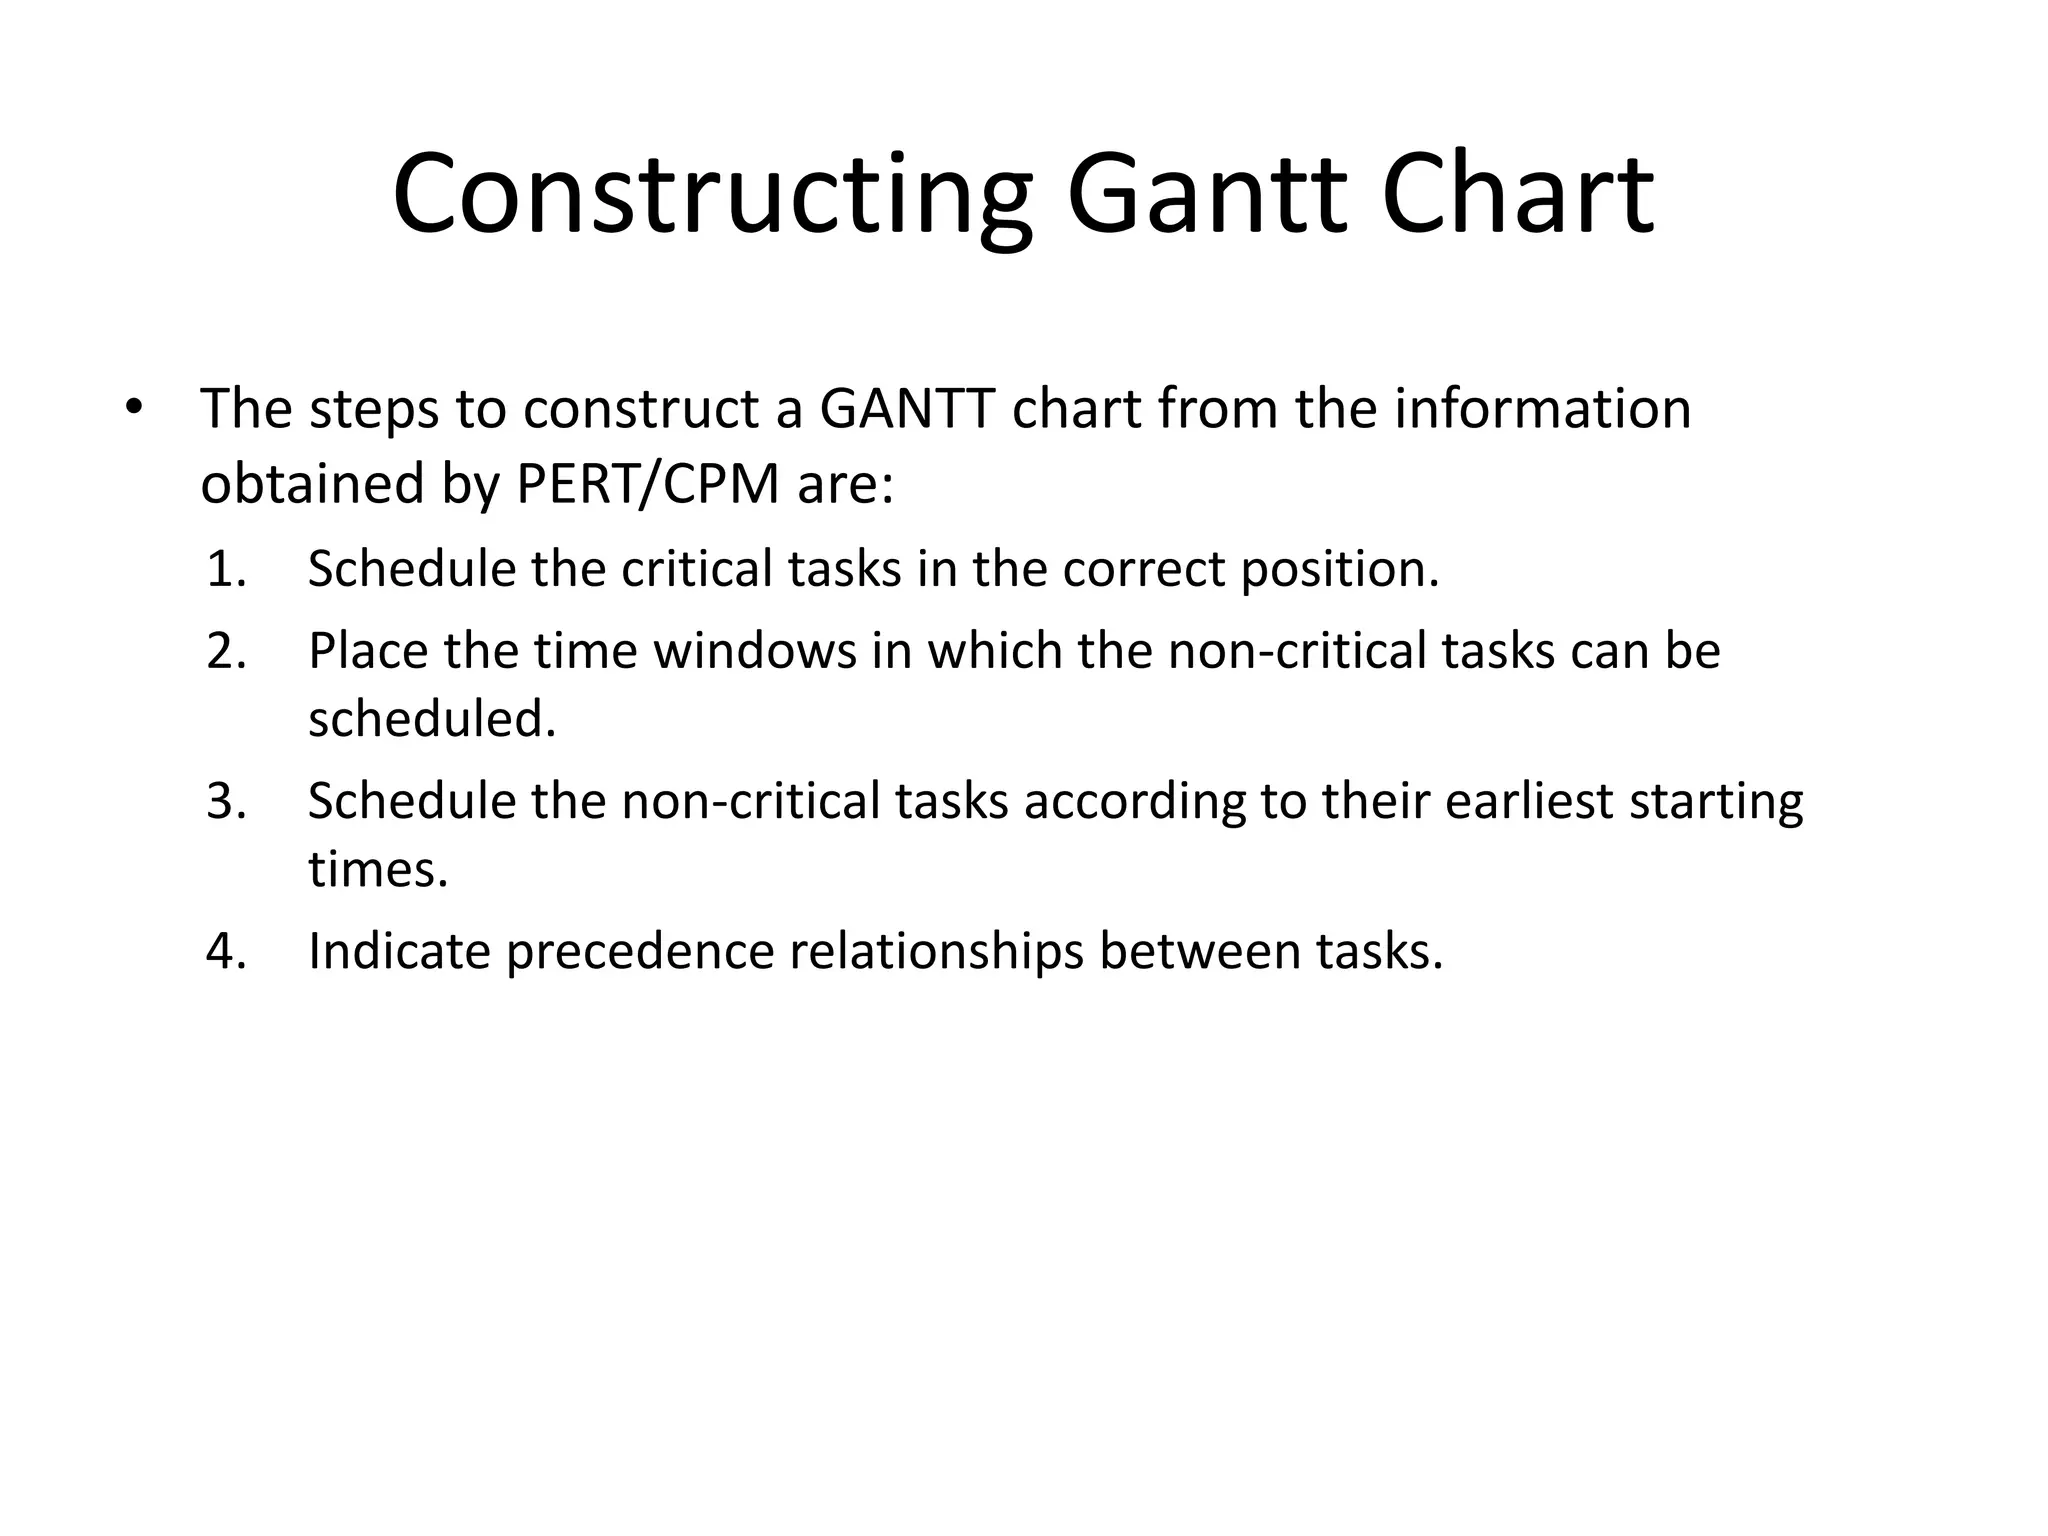
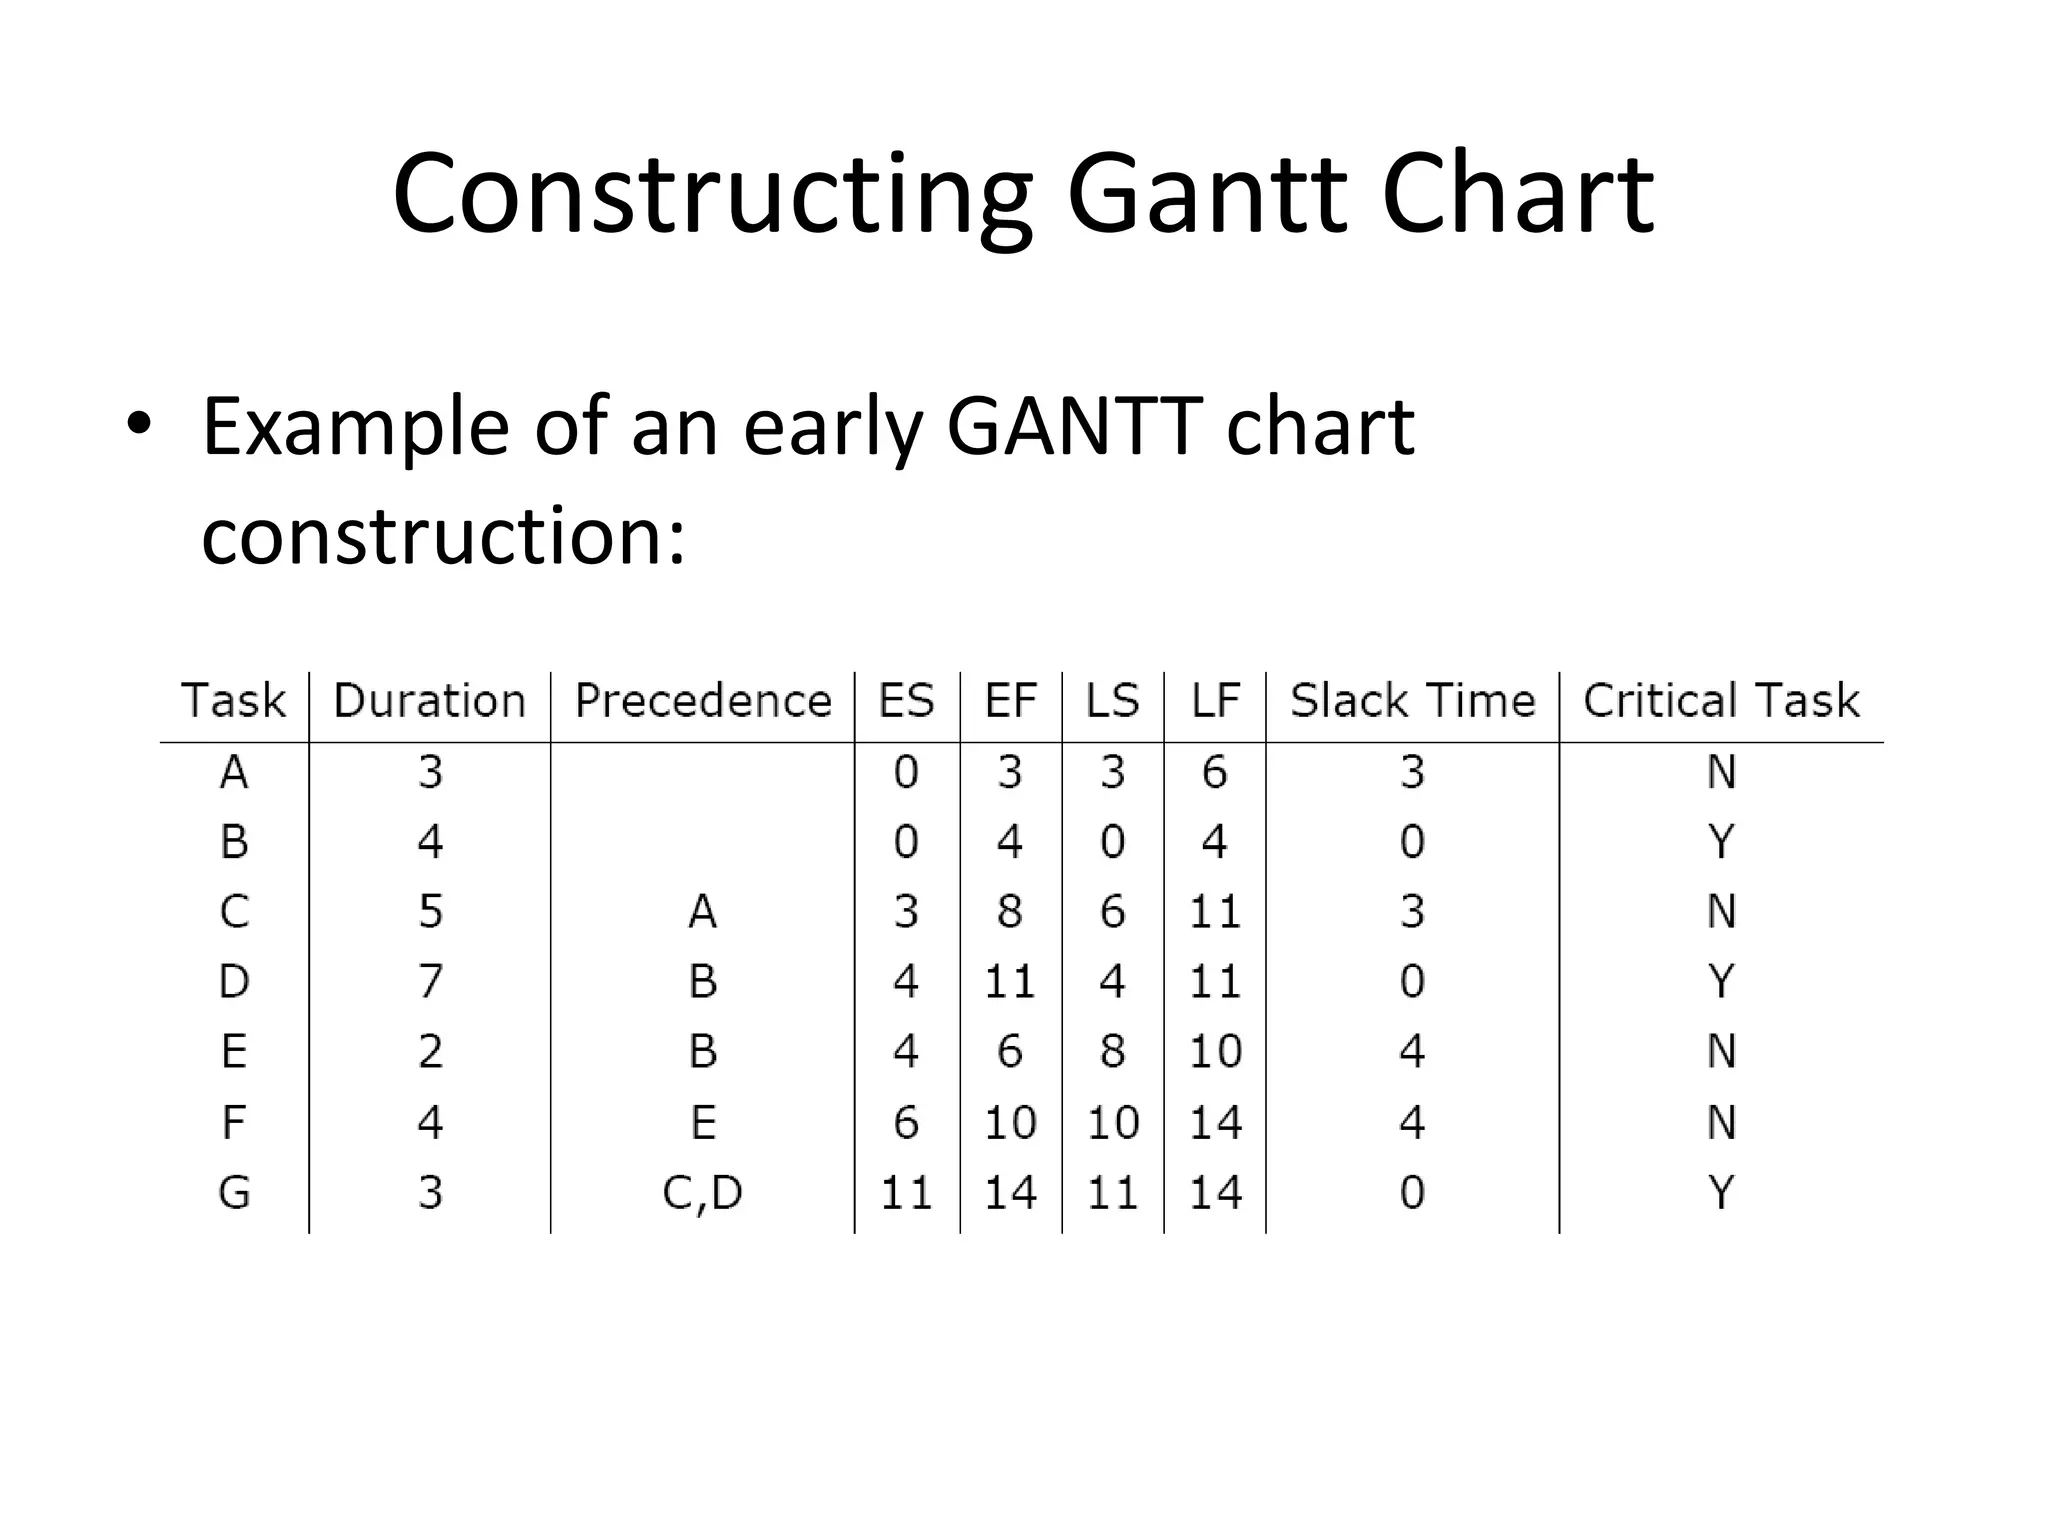
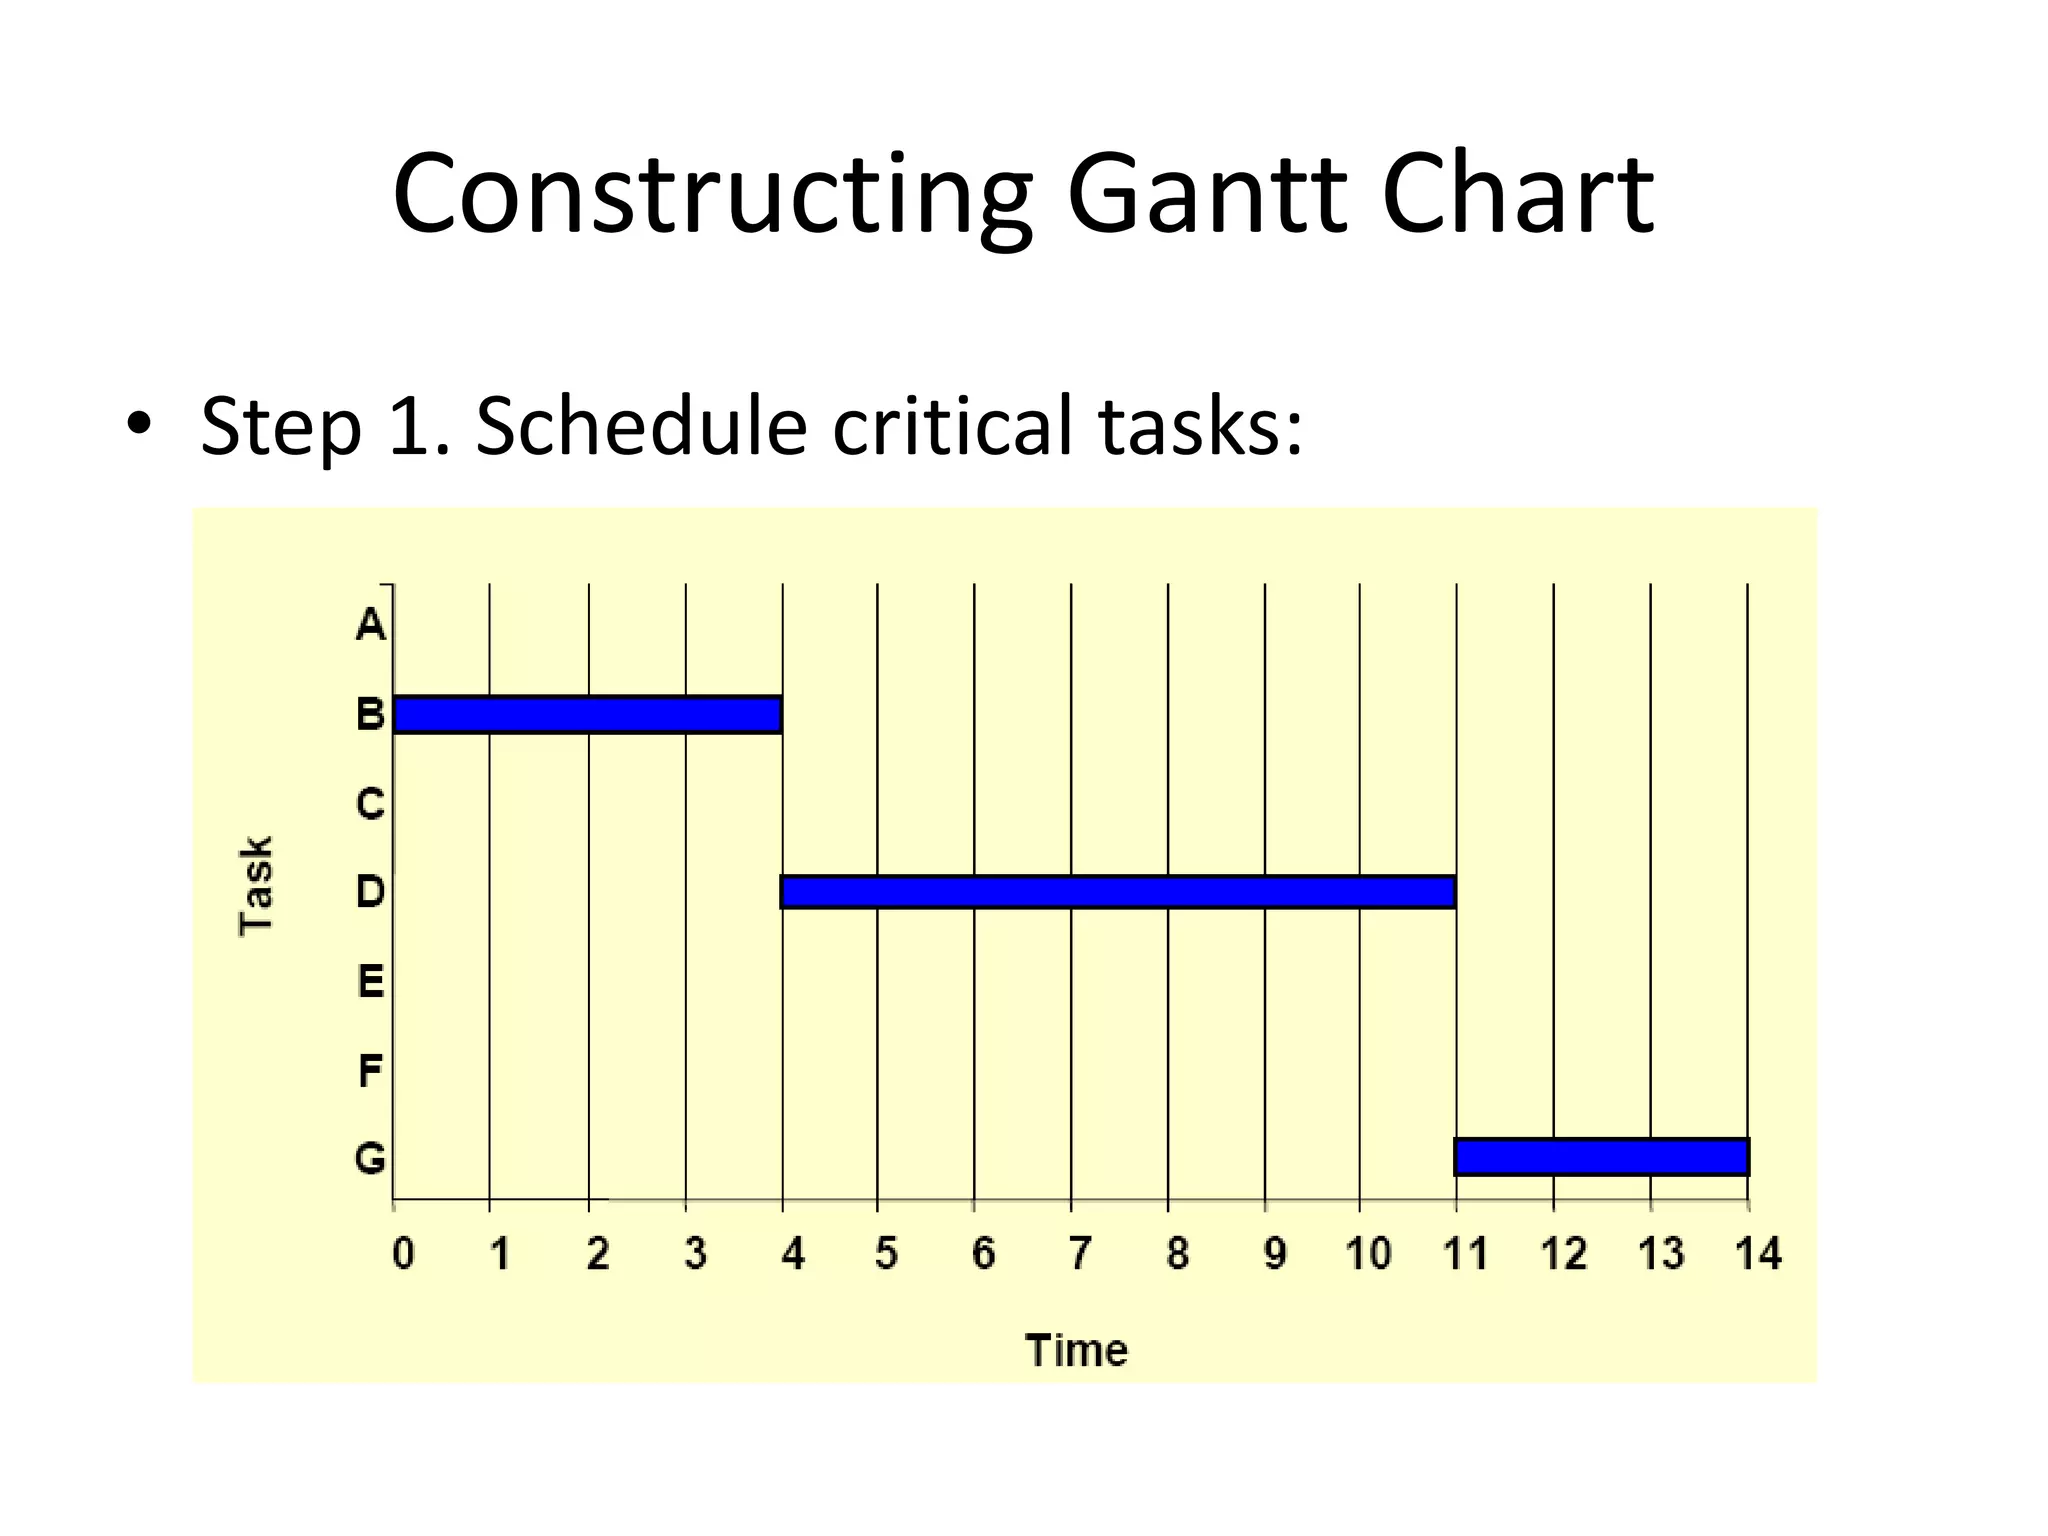
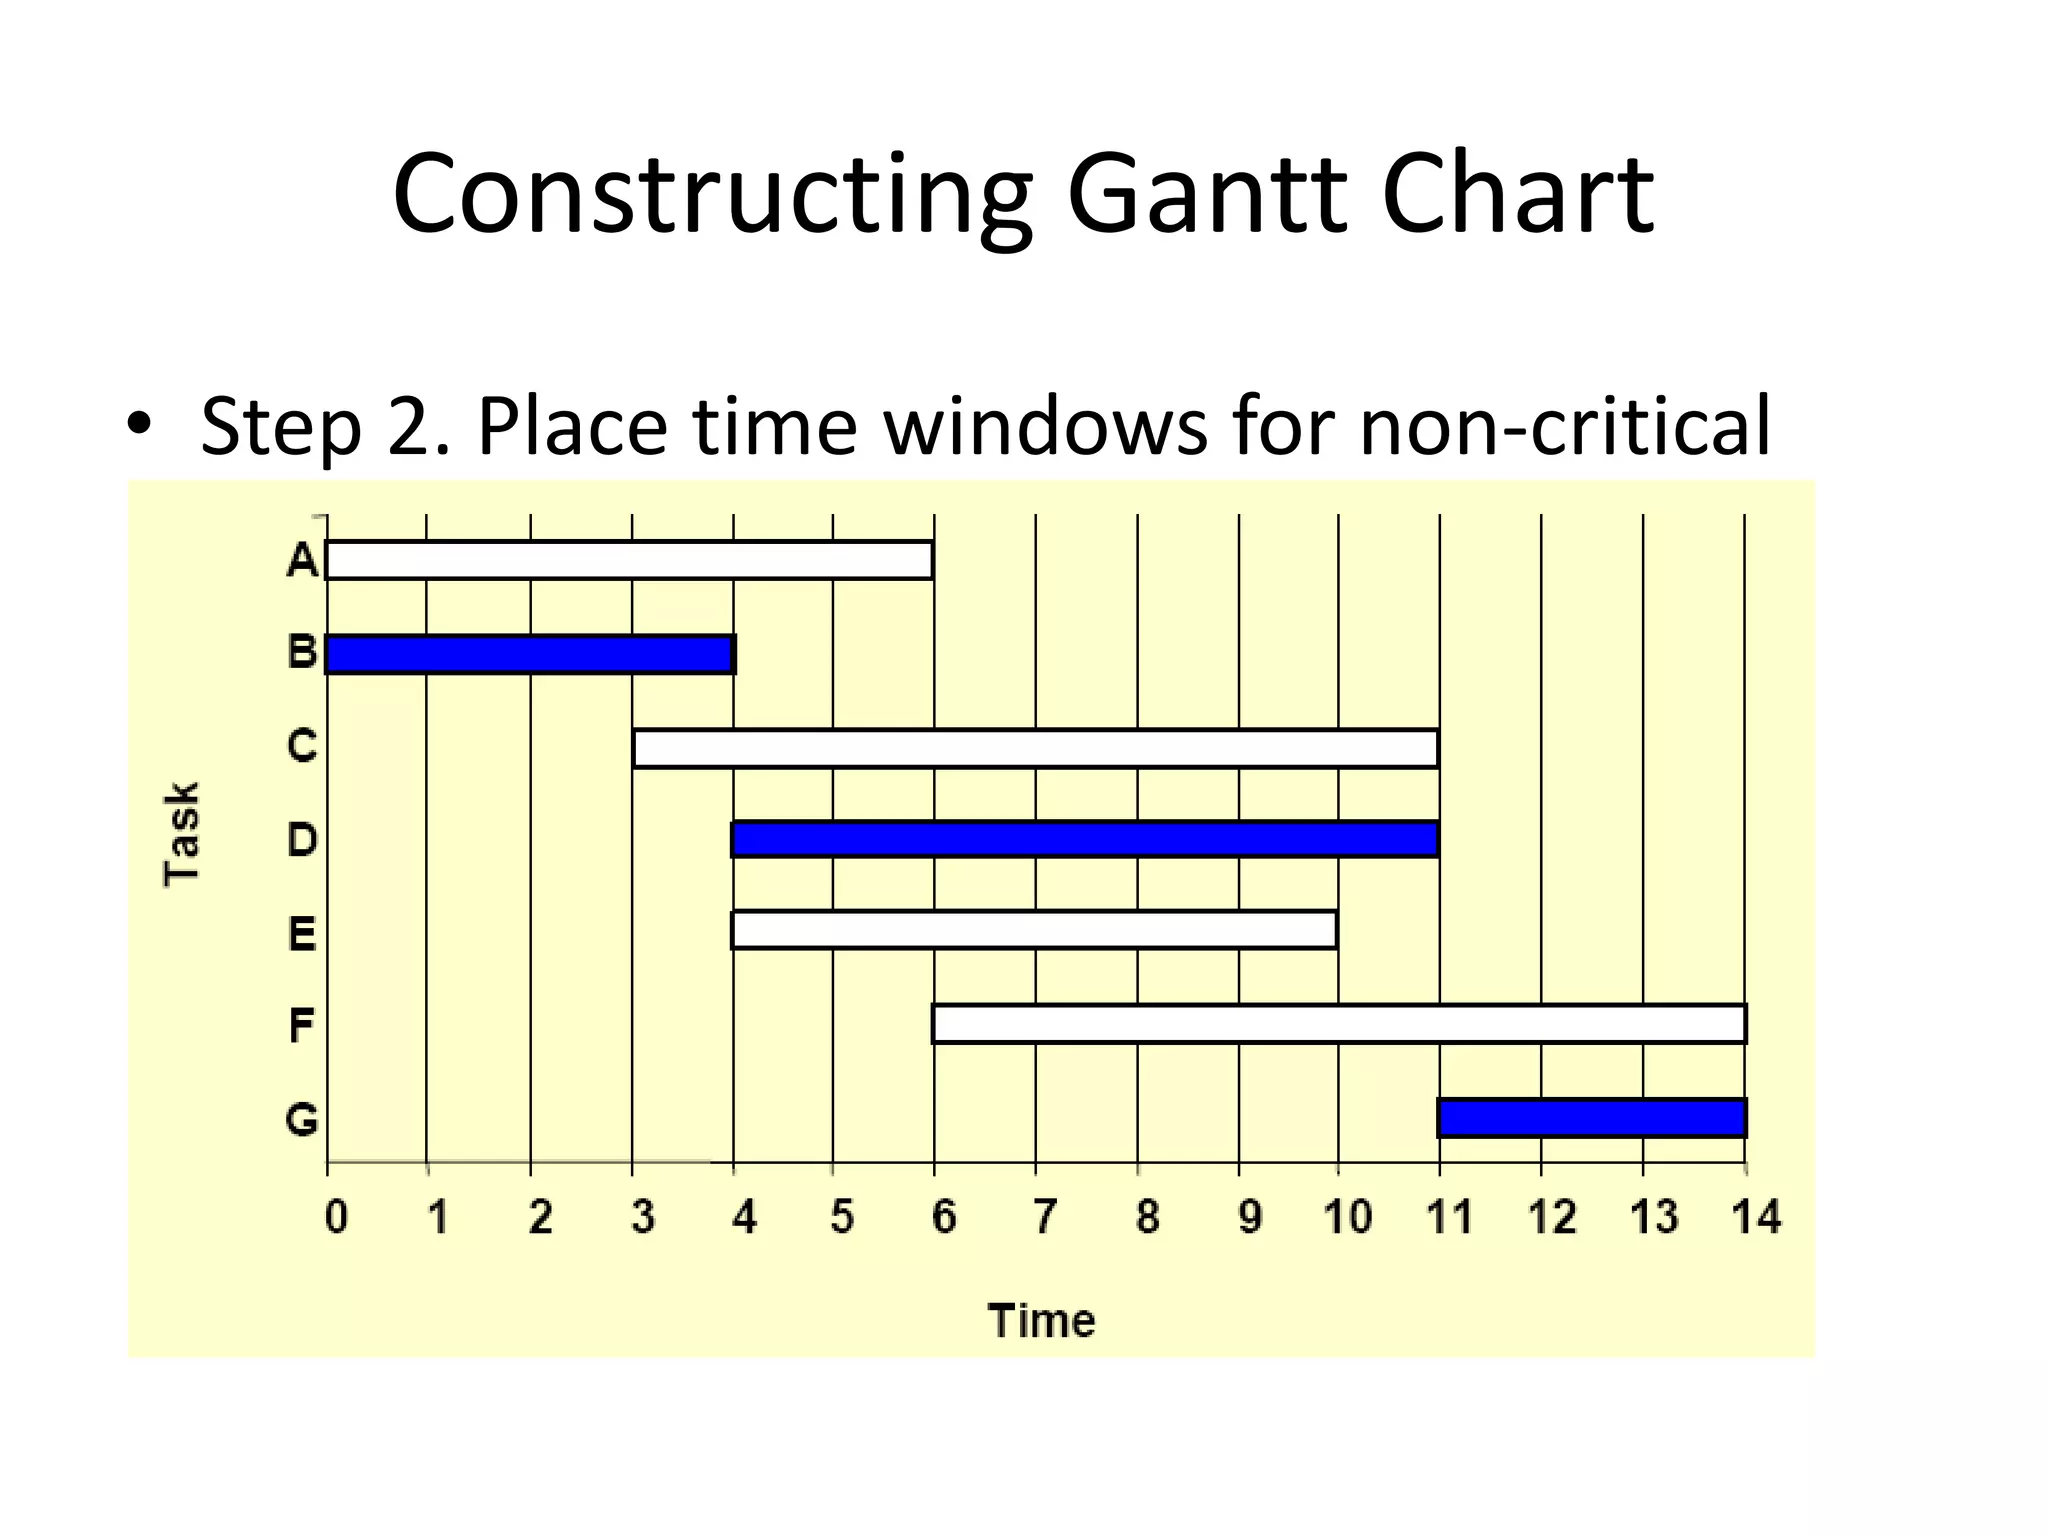
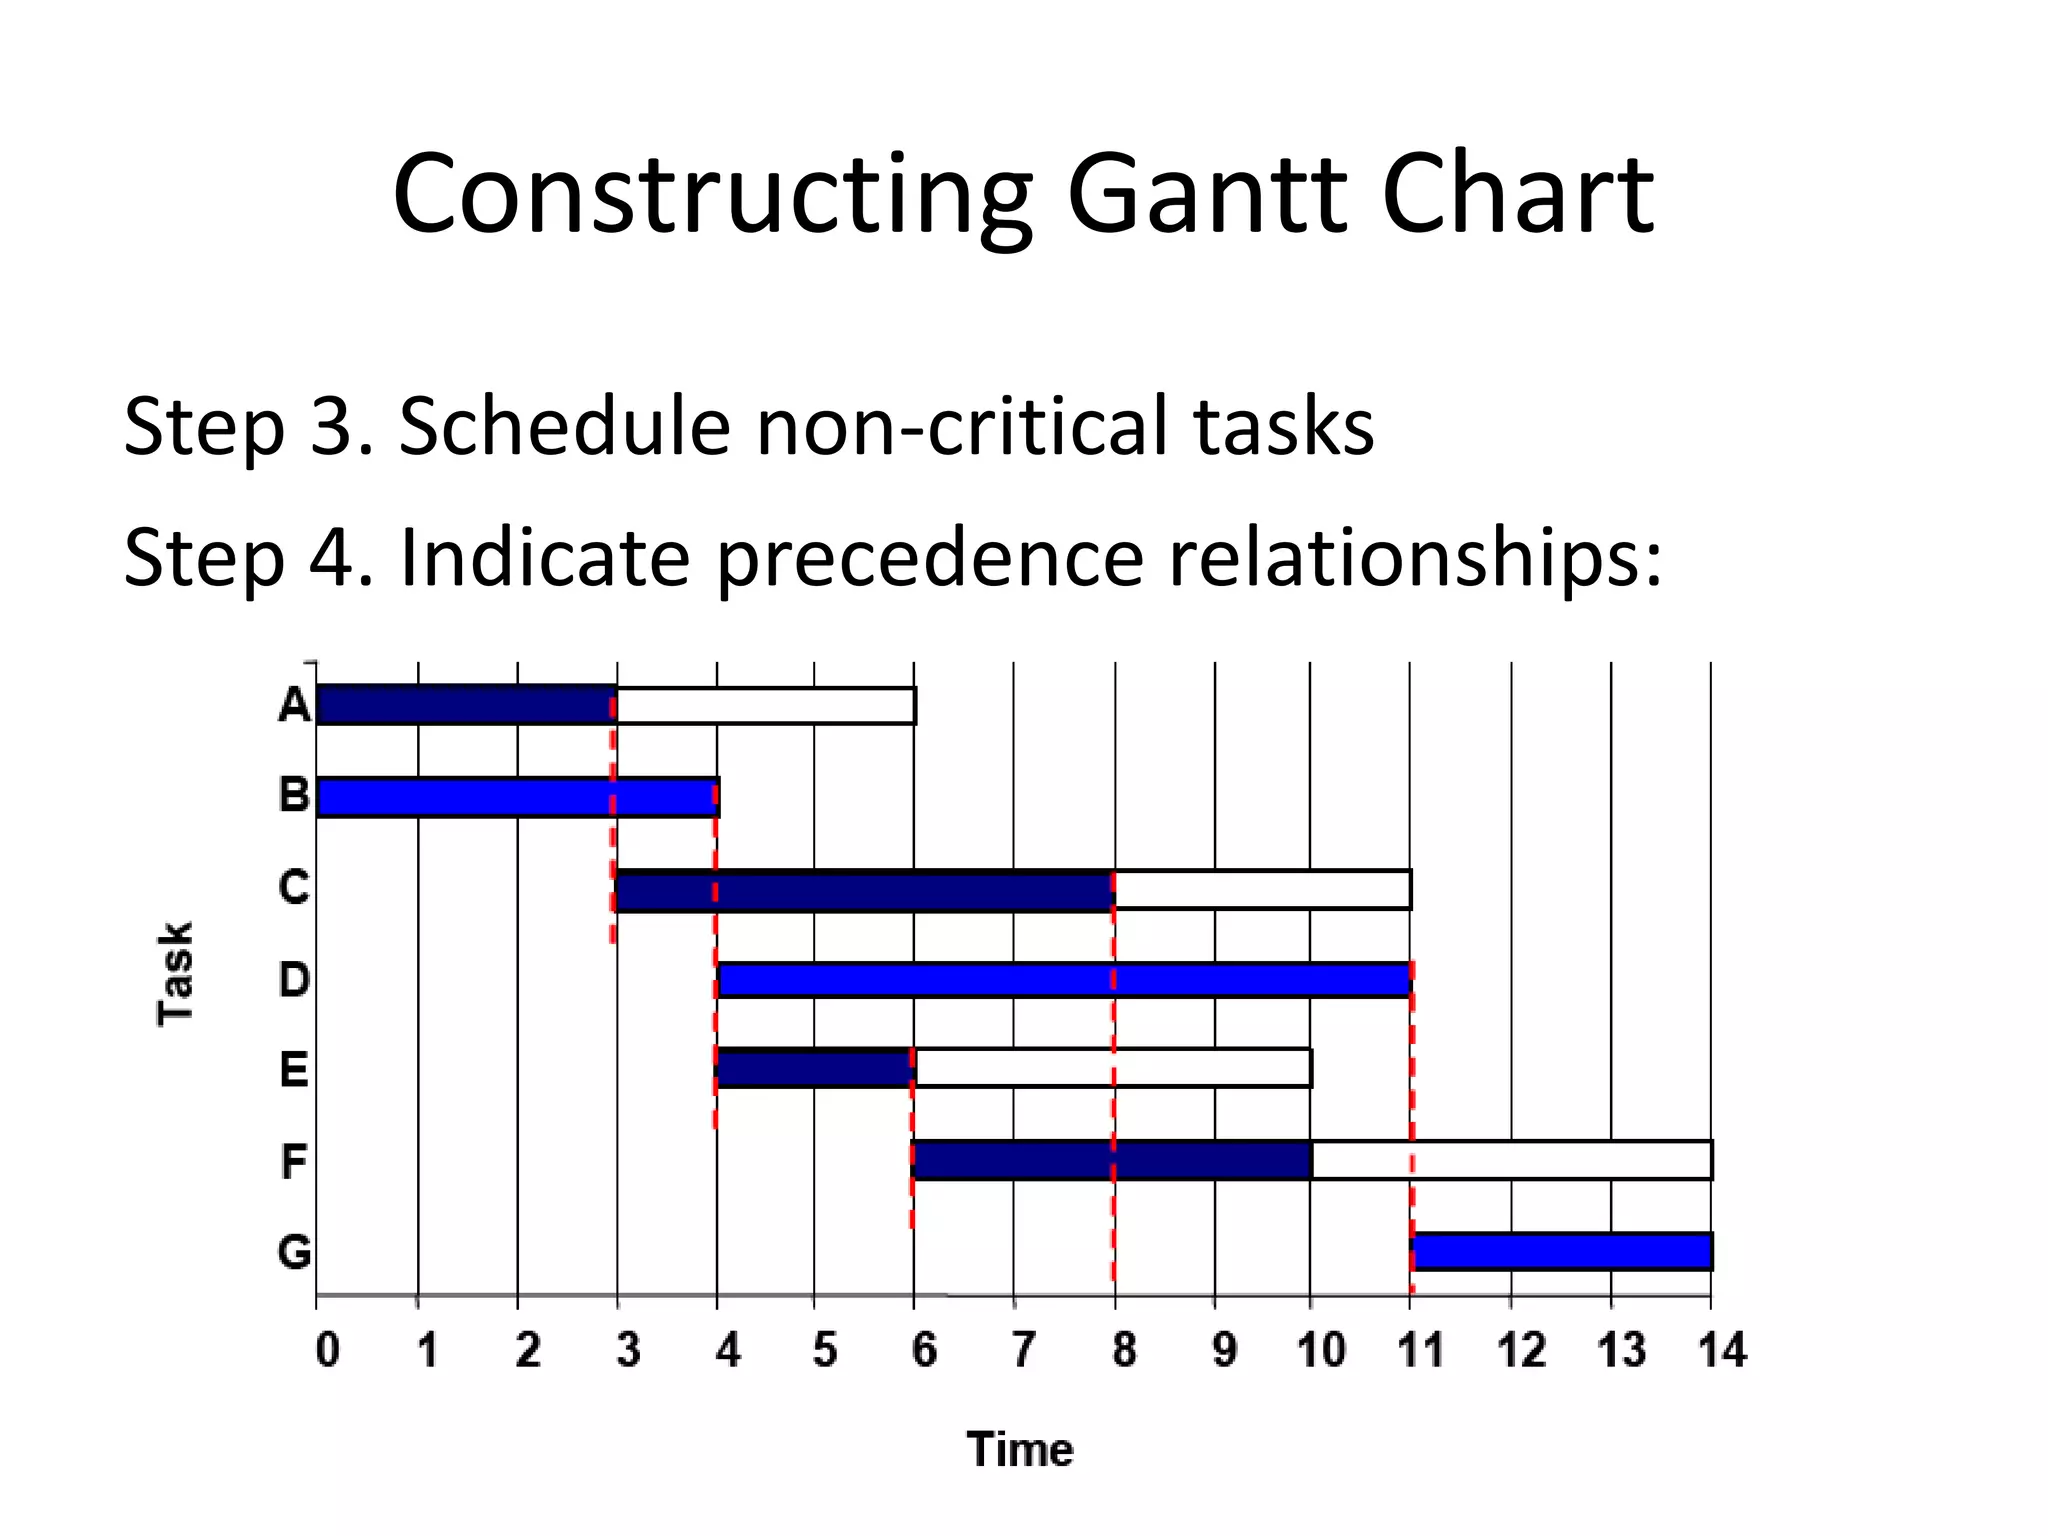
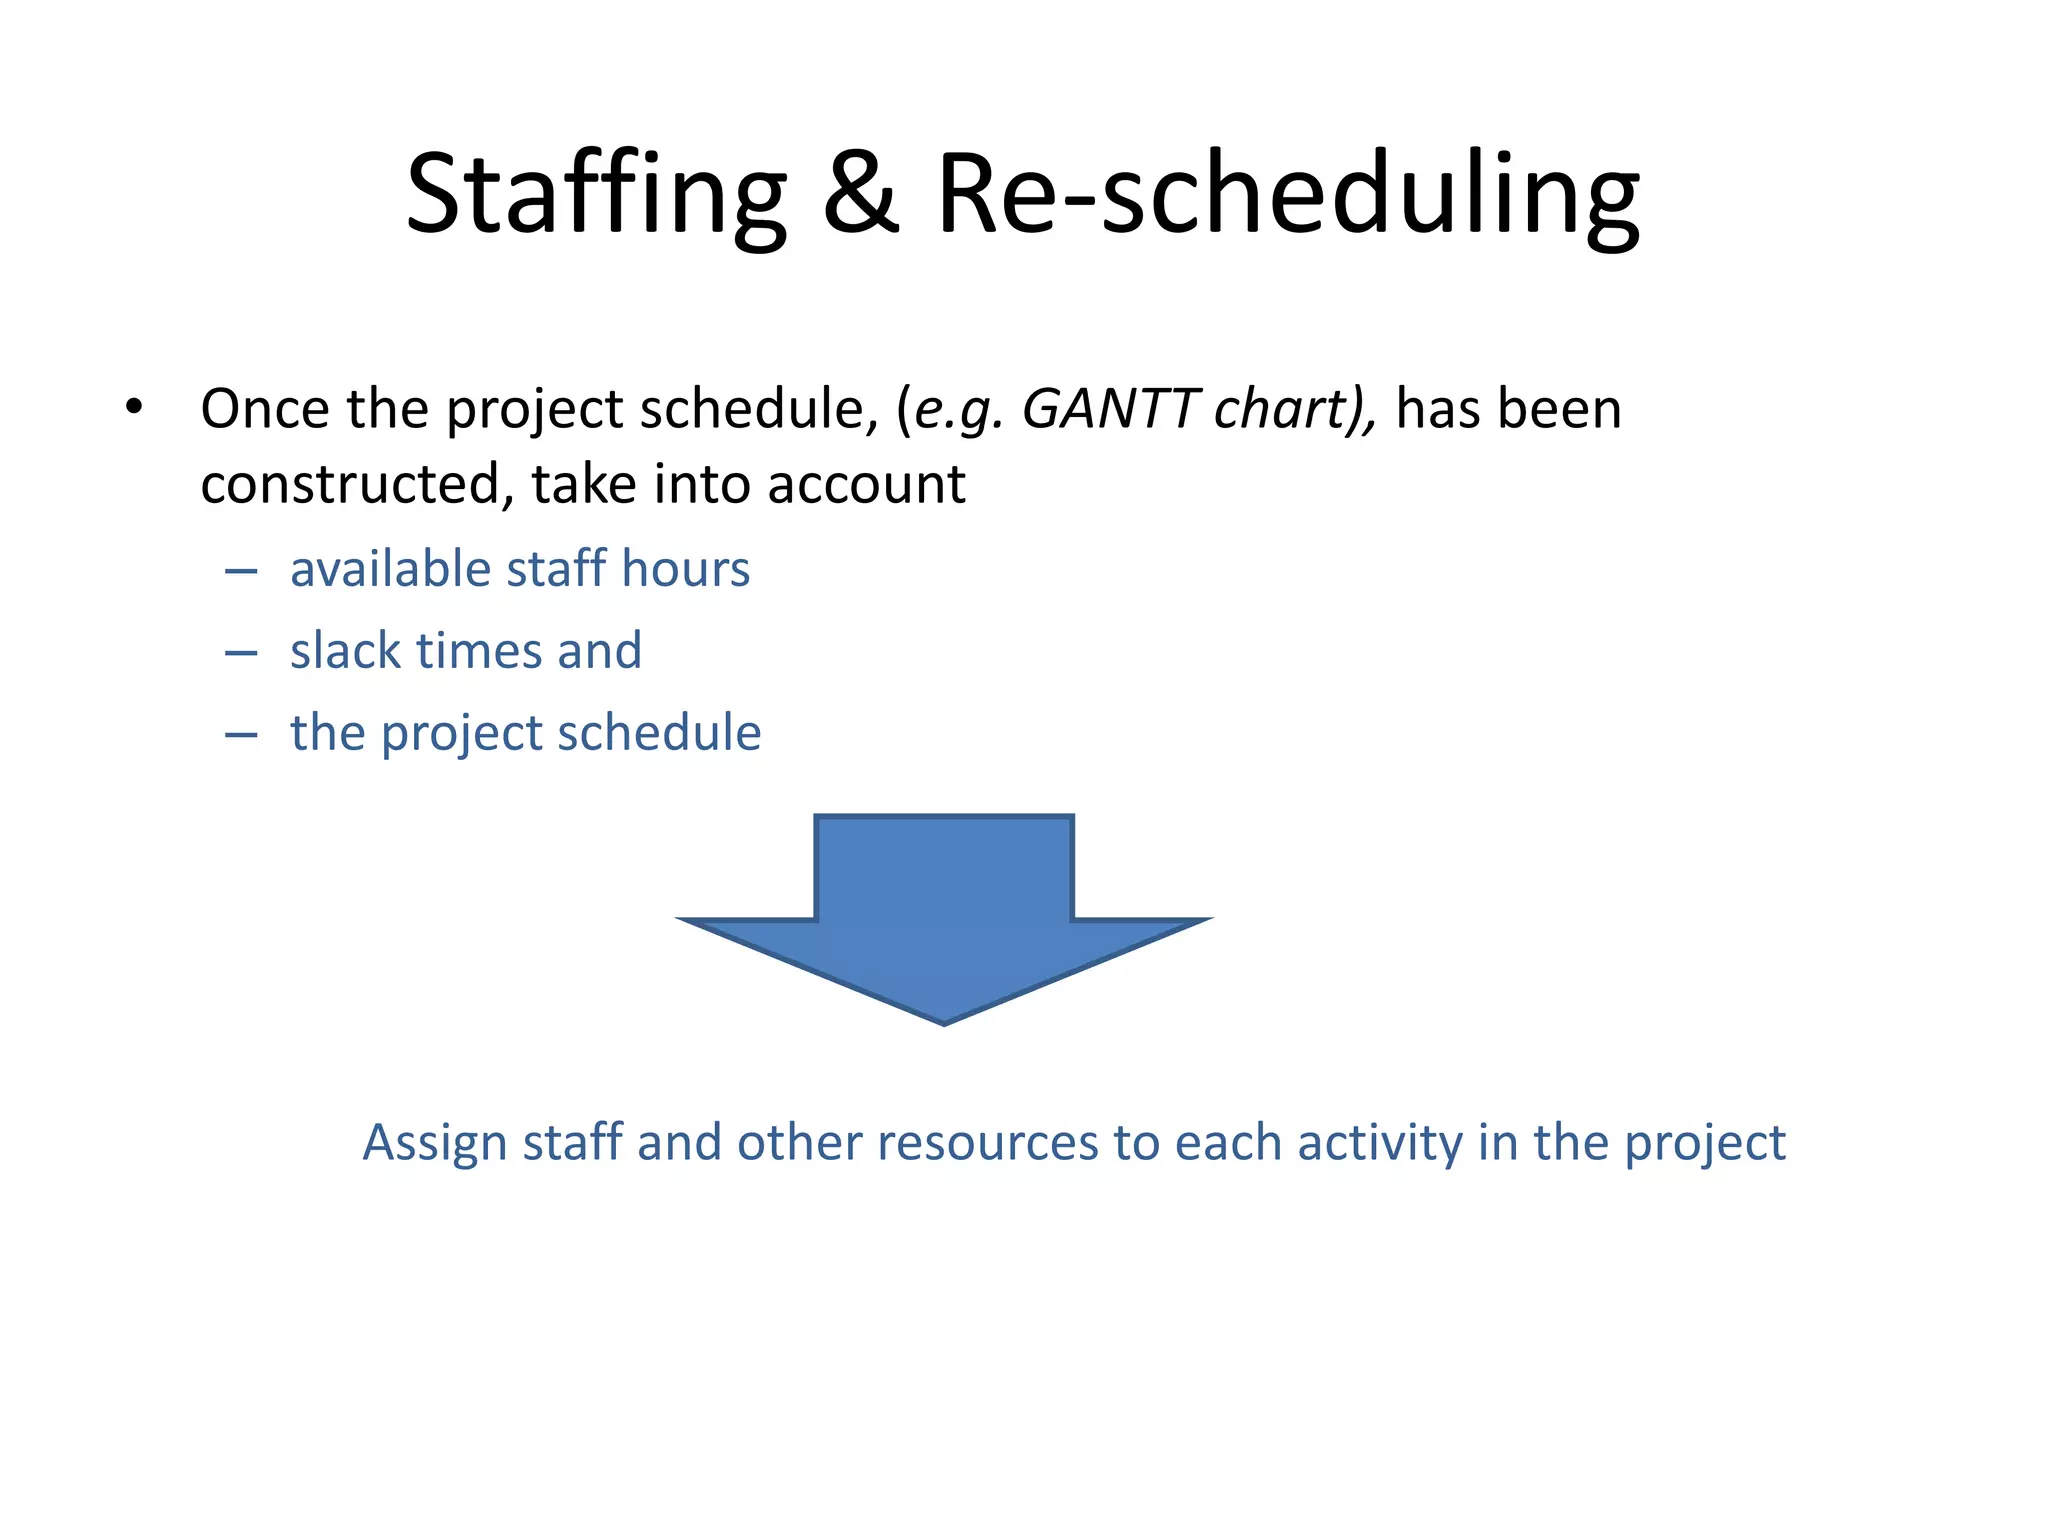
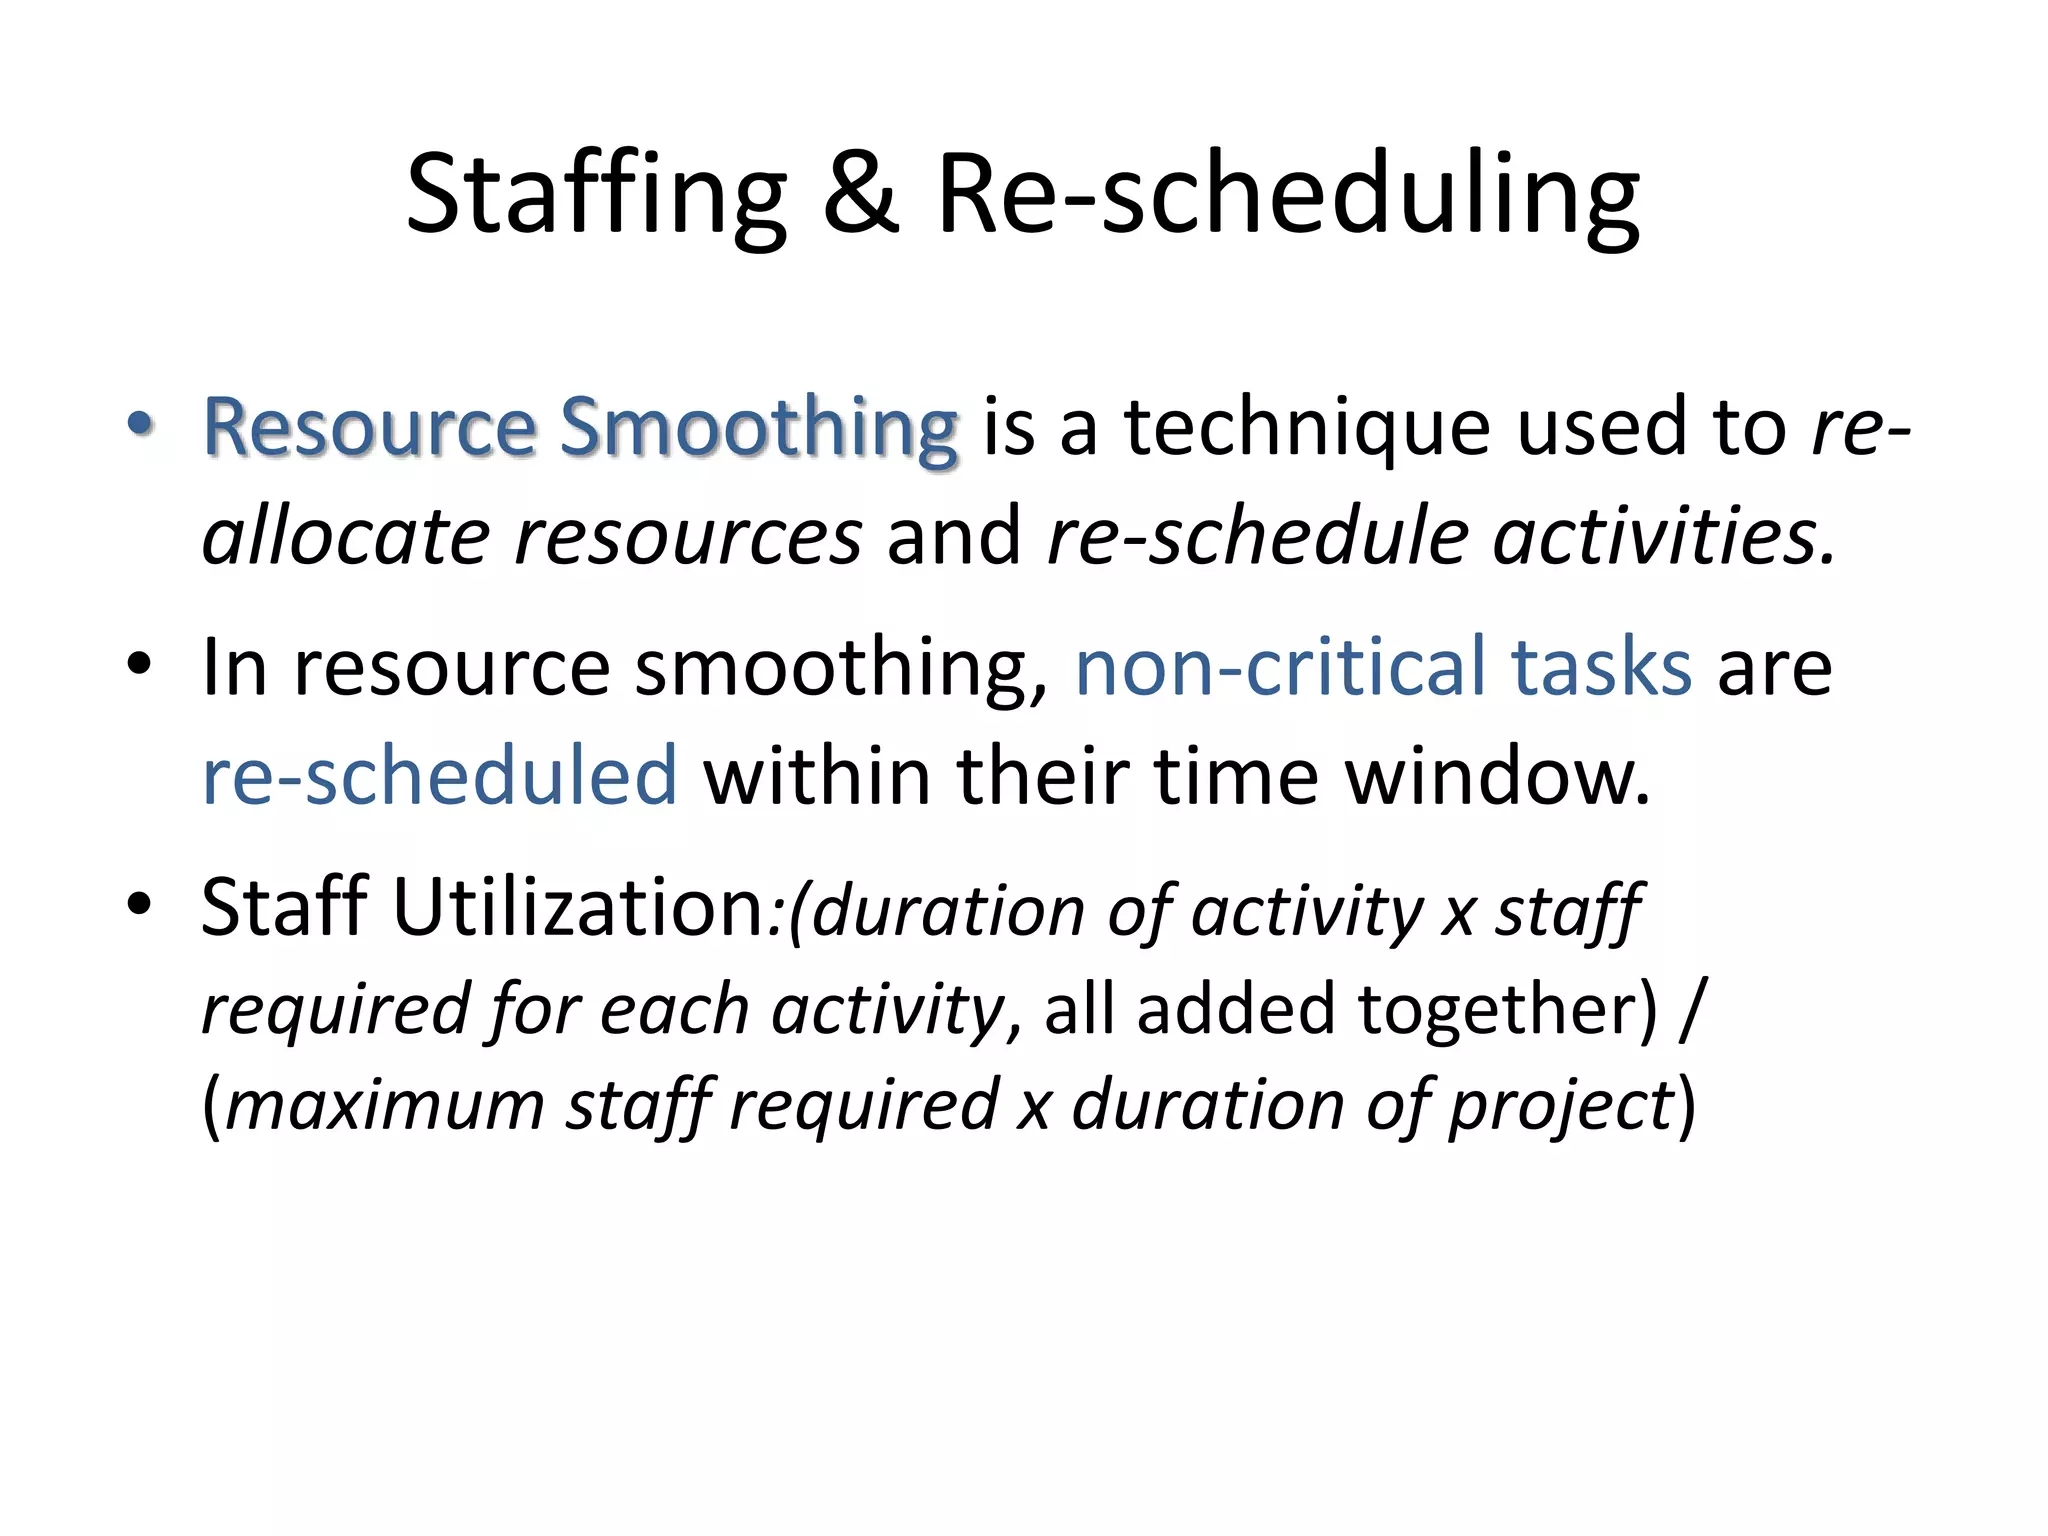
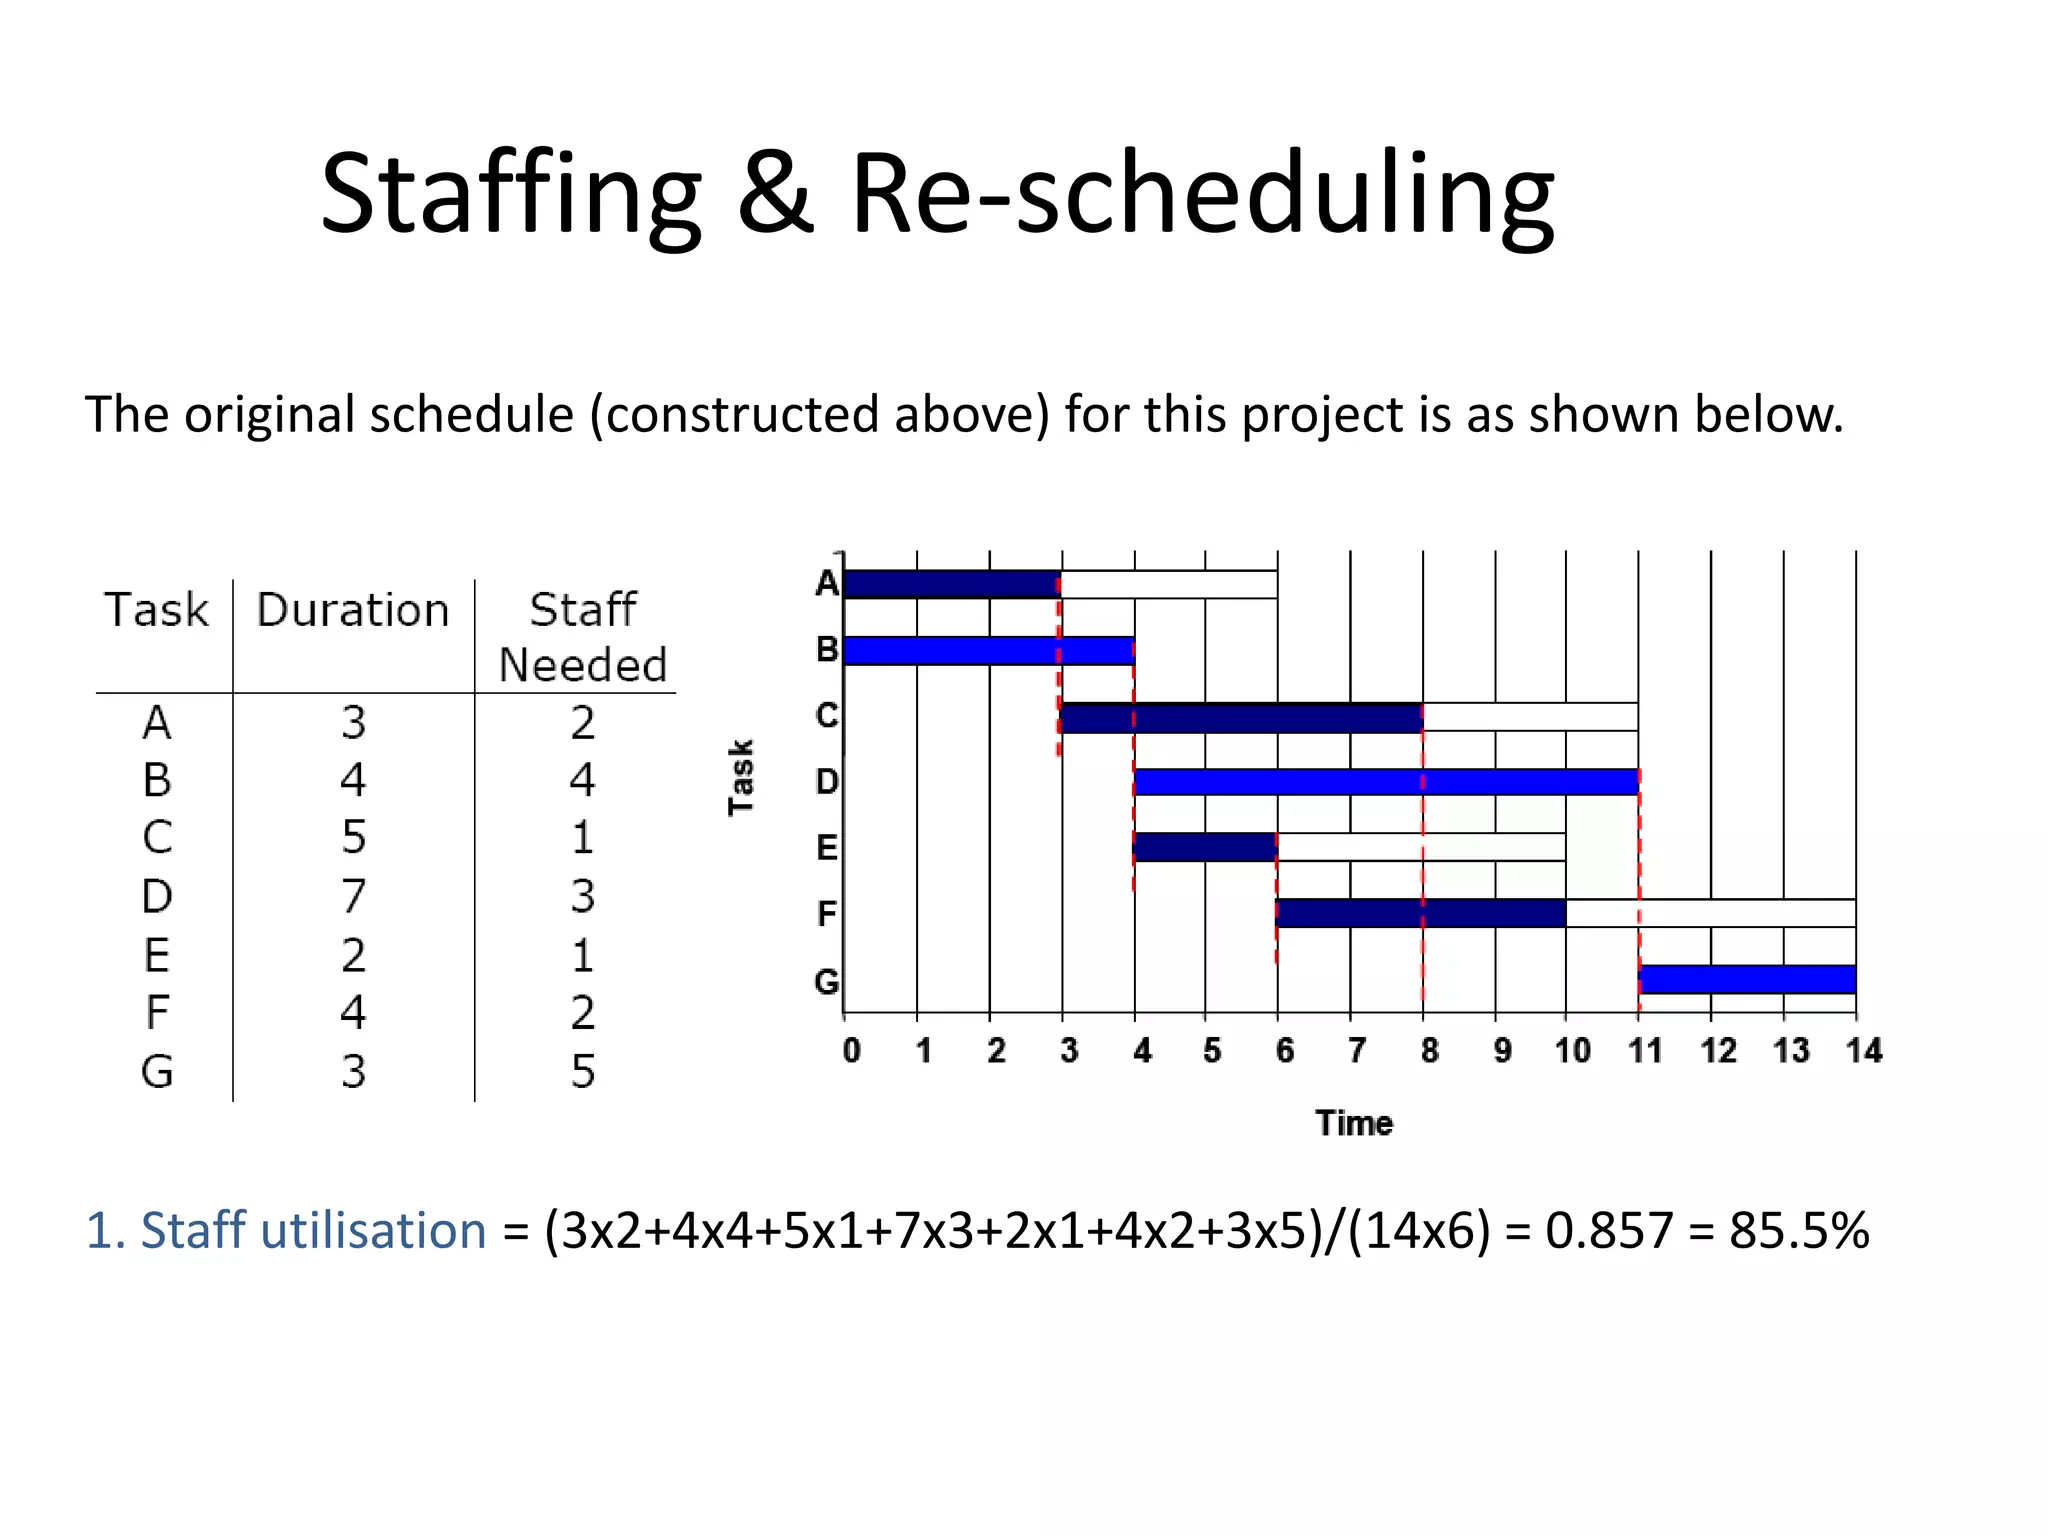
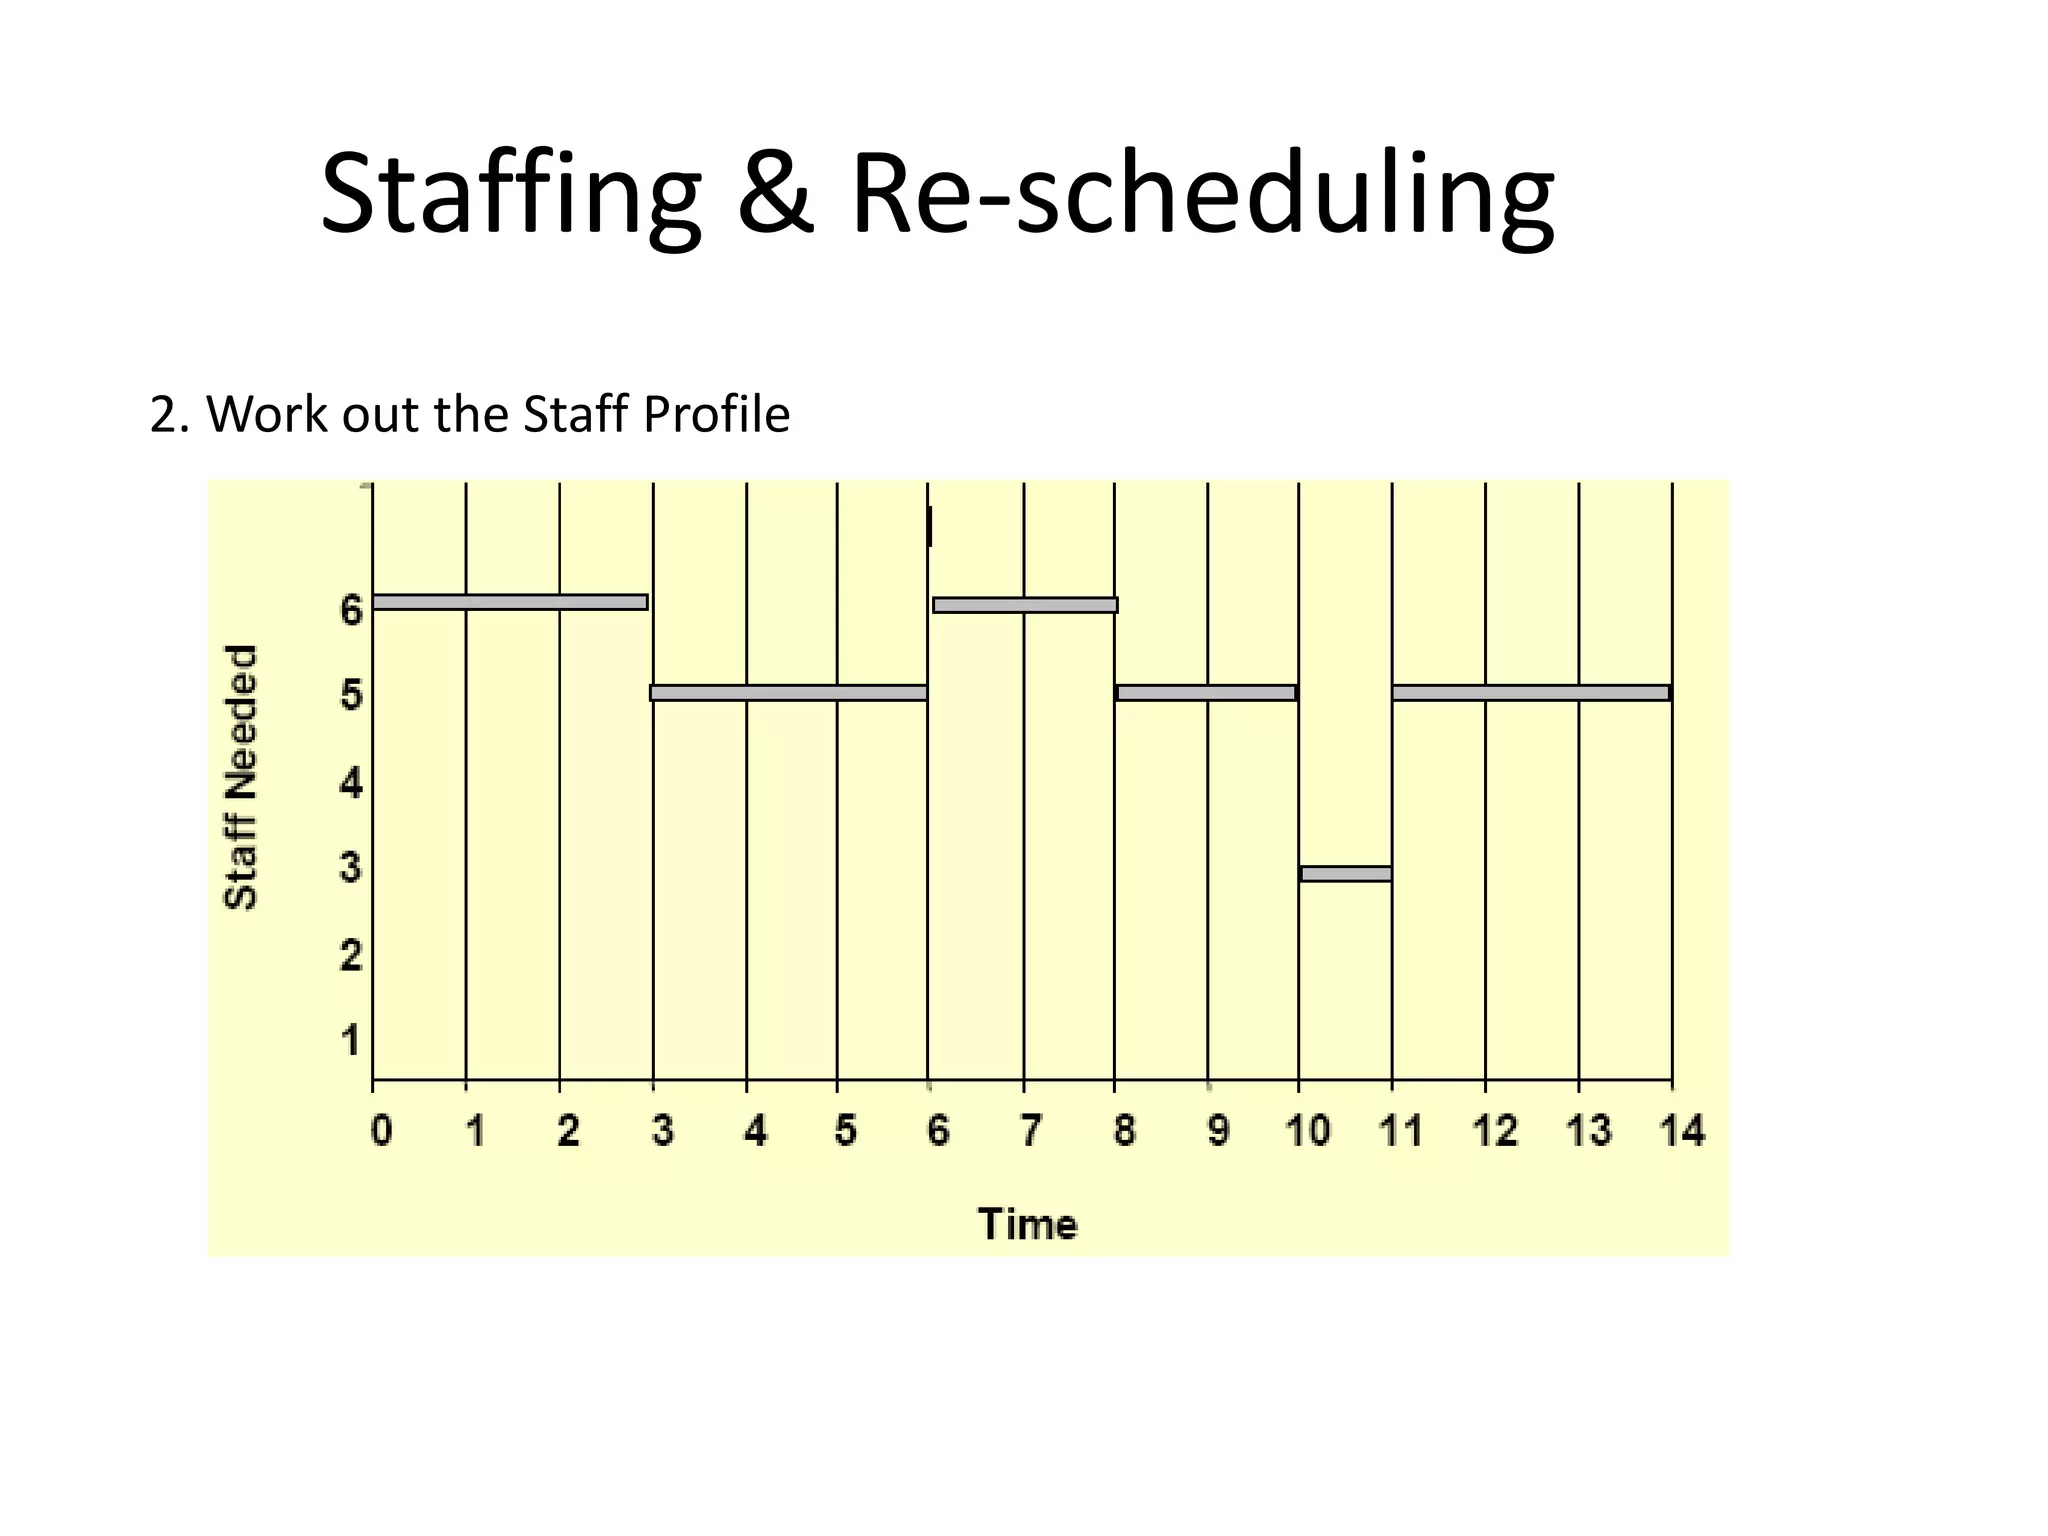
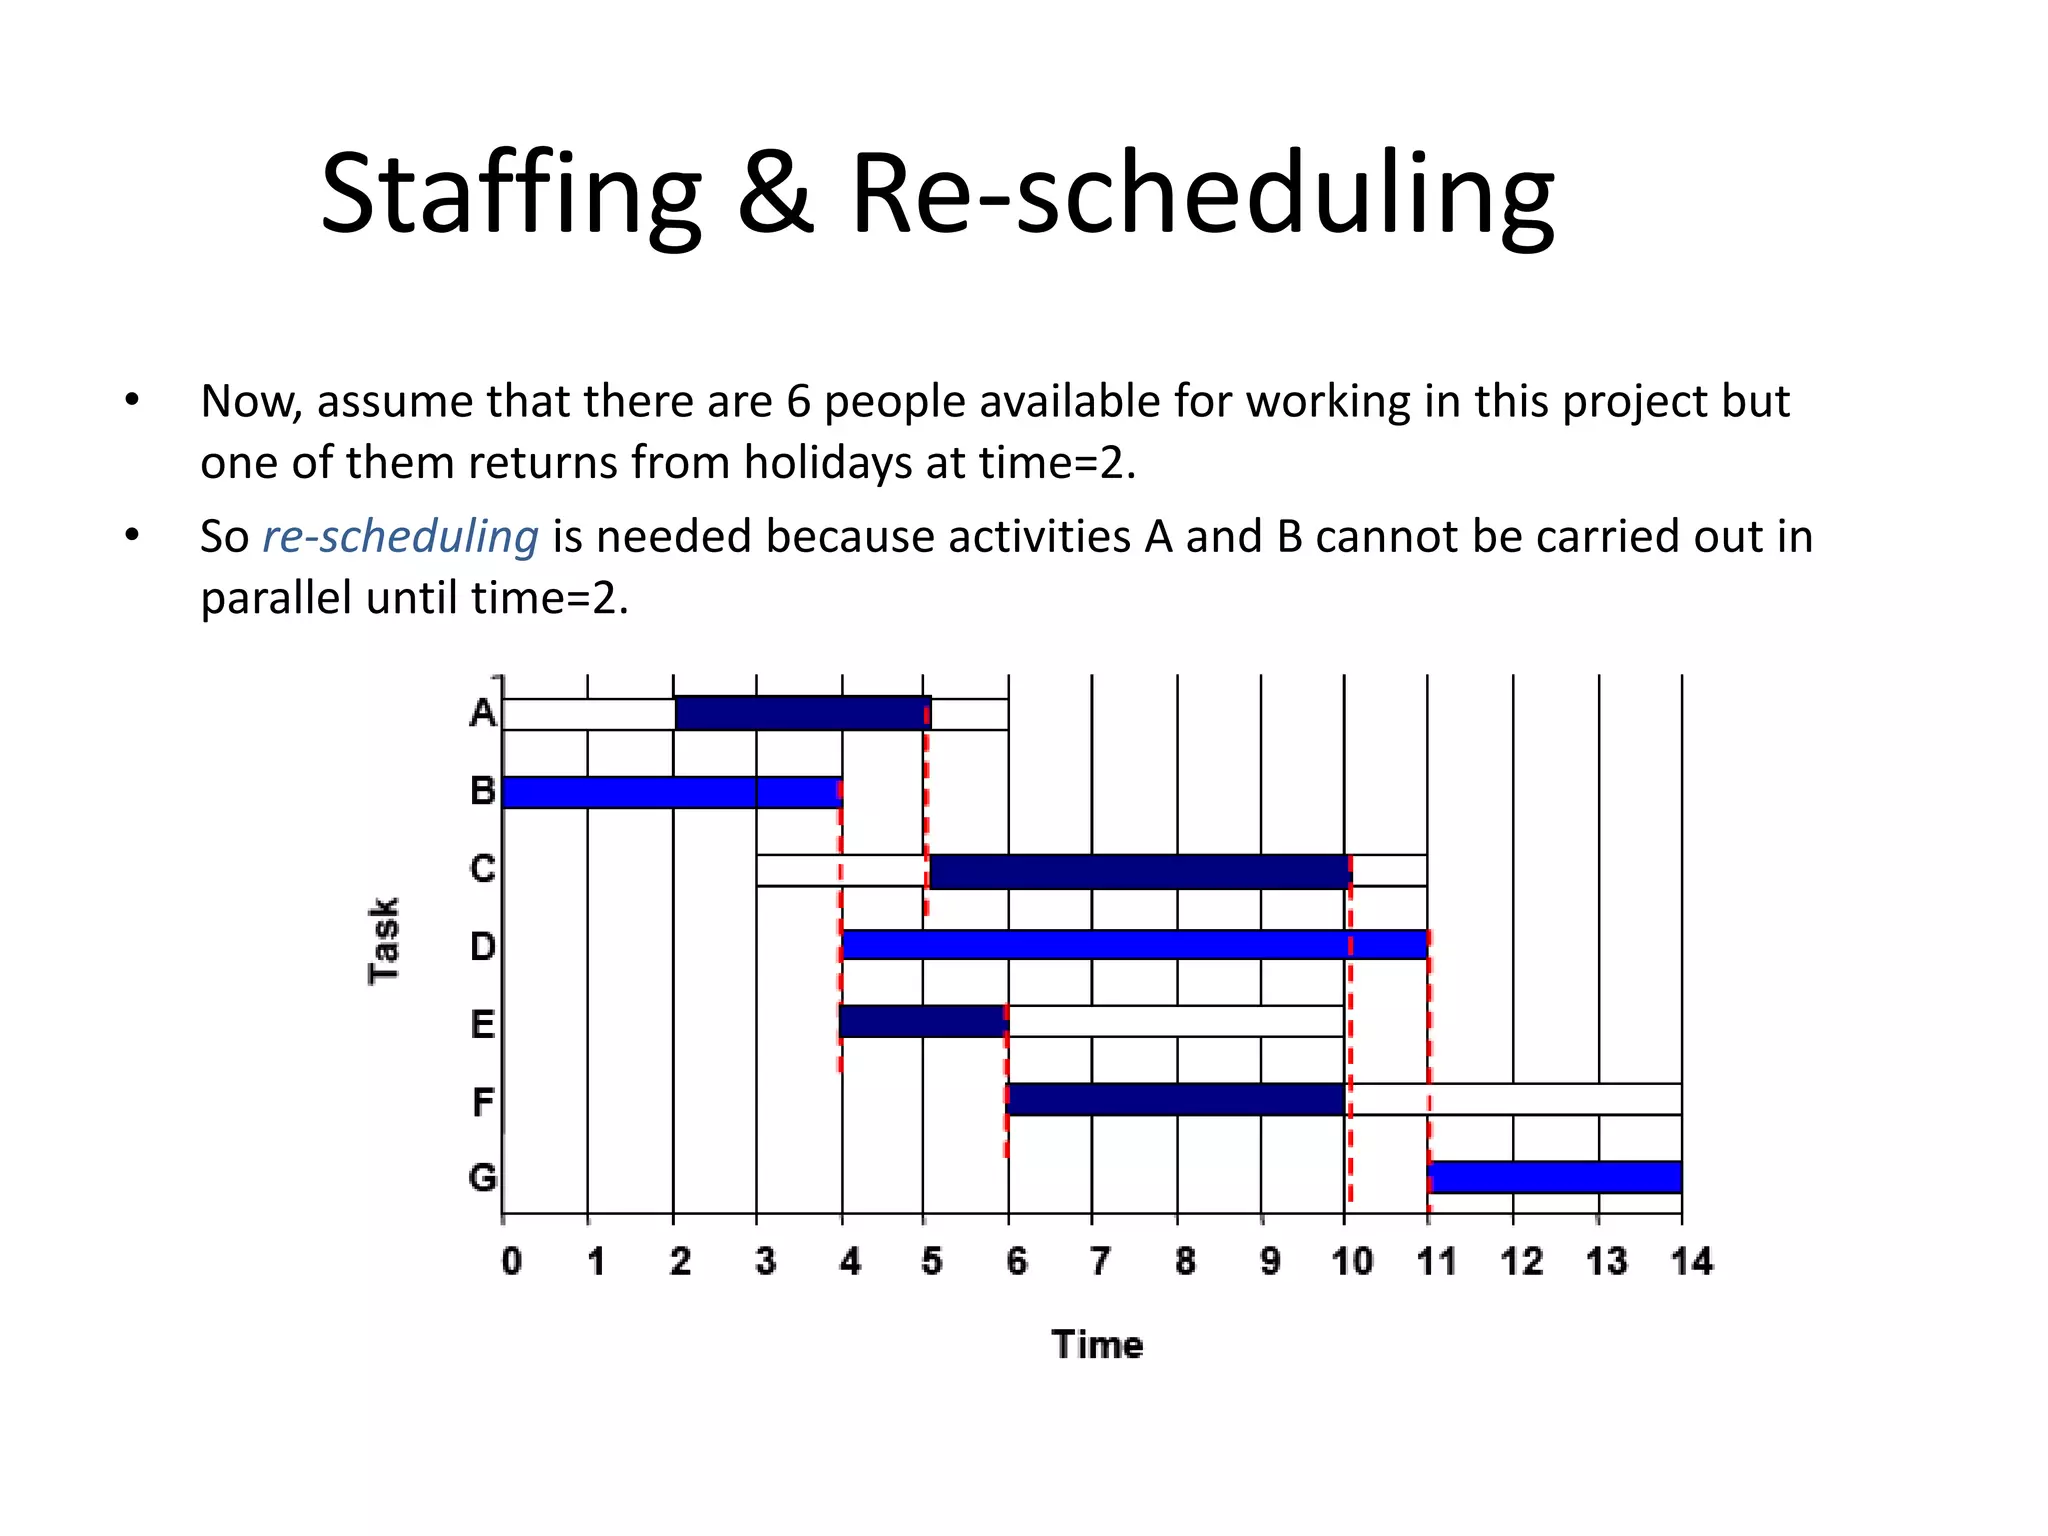
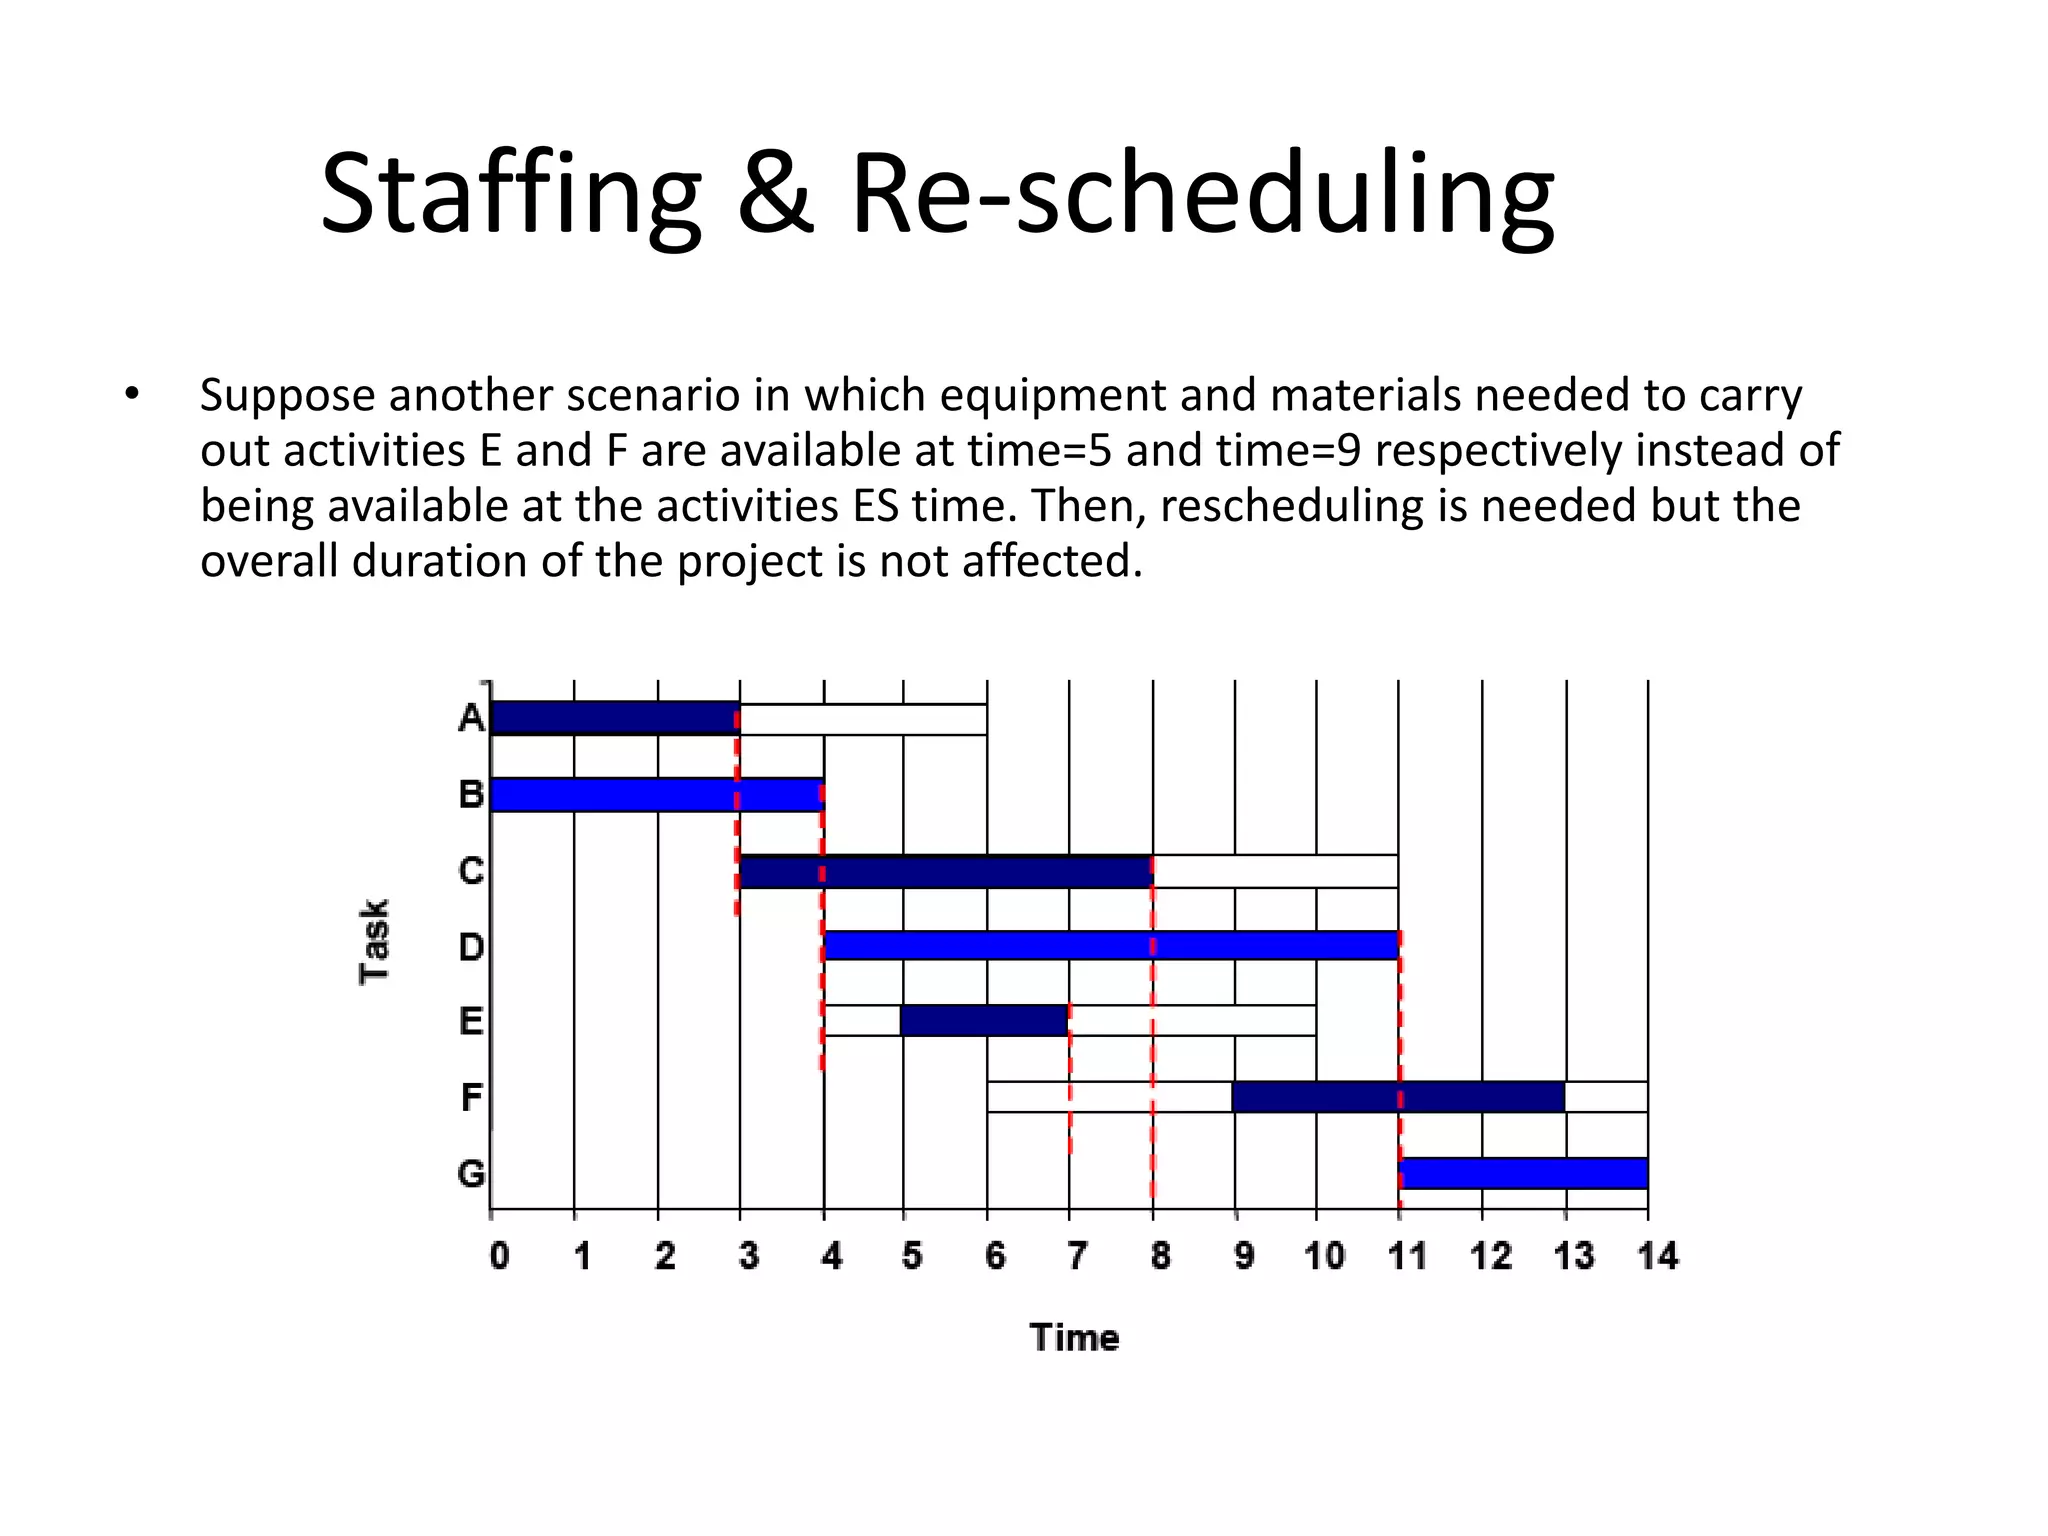

This document discusses Gantt charts, which are bar charts that illustrate project schedules. It describes how Gantt charts show the start and end times of tasks with bars, and how critical tasks are usually highlighted. The document outlines the steps to construct a Gantt chart from PERT/CPM analysis, including scheduling critical tasks, placing time windows for non-critical tasks, and indicating precedence relationships. It also discusses using Gantt charts for staffing and re-scheduling projects based on available resources.


![Daily lesson logs & subject allocation.pptx [autosaved]](https://cdn.slidesharecdn.com/ss_thumbnails/dailylessonlogssubjectallocation-161113031103-thumbnail.jpg?width=640&height=640&fit=bounds)


