
Recommended
More Related Content
What's hot
What's hot (20)
Similar to Gantt and PERT chart
Similar to Gantt and PERT chart (20)
More from Krishna Mohan Mishra
More from Krishna Mohan Mishra (20)
Recently uploaded
Recently uploaded (20)
Gantt and PERT chart
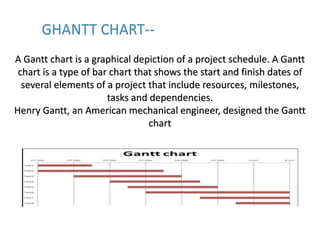
- 1. Day 1 03 05 10 15 20 25 30 35 40 42 45 GHANTT CHART-- A Gantt chart is a graphical depiction of a project schedule. A Gantt chart is a type of bar chart that shows the start and finish dates of several elements of a project that include resources, milestones, tasks and dependencies. Henry Gantt, an American mechanical engineer, designed the Gantt chart
- 2. Day 1 03 05 10 15 20 25 30 35 40 42 45NO. OF DAYS 05 days FEASIBILITY STUDY 08 days SRS 08 days DESIGN 03 days 05 days FLOW CHART ER DIAGRAM USE CASE ,ACTIVITY DIAGRAM 10 days 08 days IMPLEMENTATION TESTING GANTT CHART
- 3. PERT CHART -- A PERT chart is a project management tool that provides a graphical representation of a project's timeline. PERT, or Program Evaluation Review Technique, allows the tasks in a particular project to be analyzed. Although PERT charts are preferable to Gantt charts because they more clearly identify task dependencies, PERT charts are often more difficult to interpret.