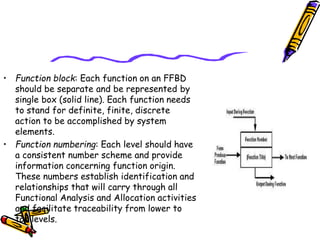
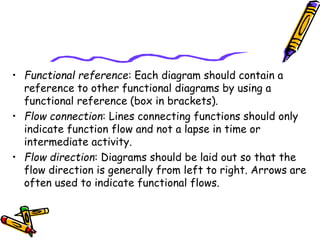
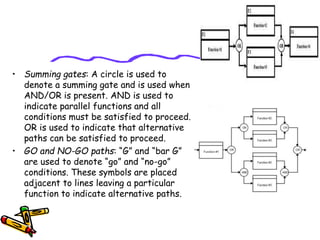
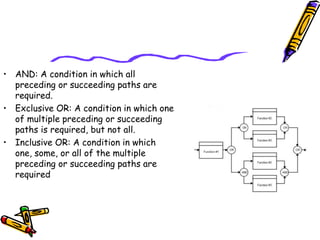
Functional Modeling
Preeti Mishra
Course Instructor
Introduction
• Functional Modelling gives the process perspective of
the object-oriented analysis model
• And an overview of what the system is supposed to do.
• It defines the function of the internal processes in
the system with the aid of Data Flow Diagrams (DFDs).
• It depicts the functional derivation of the data values
without indicating how they are derived when they are
computed, or why they need to be computed.
• A functional modelling perspective concentrates on
describing the dynamic process.
Various Functional Models
• One of the first well defined function models, was the
Functional Flow Block Diagram (FFBD) developed by the
defence-related TRW Incorporated in the 1950s.
• Data Flow Diagram
Function Flow Block
Diagram
Introduction
• The FFBD notation was developed in the 1950s, and is
widely used in classical systems engineering.
• FFBDs are one of the classic business process modelling
methodologies, along with :
– flow charts,
– data flow diagrams,
– control flow diagrams, etc
Function flow block
diagram
• A functional block diagram is a block diagram, that
describes the functions and interrelationships of a system.
The functional block diagram can picture:
– Functions of a system pictured by blocks
– Input and output elements of a block pictured with lines, and
– Relationships between the functions
– Functional sequences and paths for matter and or signals
– The block diagram can use additional schematic symbols to show
particular properties.
– Specific function block diagram are the classic Functional Flow
Block Diagram, and the Function Block Diagram (FBD) used in the
design of programmable logic controllers.
• Function block: Each function on an FFBD
should be separate and be represented by
single box (solid line). Each function needs
to stand for definite, finite, discrete
action to be accomplished by system
elements.
• Function numbering: Each level should have
a consistent number scheme and provide
information concerning function origin.
These numbers establish identification and
relationships that will carry through all
Functional Analysis and Allocation activities
and facilitate traceability from lower to
top levels.
• Functional reference: Each diagram should contain a
reference to other functional diagrams by using a
functional reference (box in brackets).
• Flow connection: Lines connecting functions should only
indicate function flow and not a lapse in time or
intermediate activity.
• Flow direction: Diagrams should be laid out so that the
flow direction is generally from left to right. Arrows are
often used to indicate functional flows.
• Summing gates: A circle is used to
denote a summing gate and is used when
AND/OR is present. AND is used to
indicate parallel functions and all
conditions must be satisfied to proceed.
OR is used to indicate that alternative
paths can be satisfied to proceed.
• GO and NO-GO paths: “G” and “bar G”
are used to denote “go” and “no-go”
conditions. These symbols are placed
adjacent to lines leaving a particular
function to indicate alternative paths.
• AND: A condition in which all
preceding or succeeding paths are
required.
• Exclusive OR: A condition in which one
of multiple preceding or succeeding
paths is required, but not all.
• Inclusive OR: A condition in which
one, some, or all of the multiple
preceding or succeeding paths are
required
Data Flow Diagram
Already Discussed
Refer to DFD PPTs
Problems with Functional
Modeling
• Functional Modeling is not about modeling real things. It is
about writing expressions which describe the relationship
between things. Also, one tends to model what the
program does, not what it does it to.
• Functional Programming encourages writing pure, generic
functions which allow making decisions at the top level of
the call hierarchy. This is the opposite philosophy to
Object-oriented design, which encourages deferring actual
behaviour to decisions taken low down by overriding class
methods.

Functional modeling

  • 1.
  • 2.
    Introduction • Functional Modellinggives the process perspective of the object-oriented analysis model • And an overview of what the system is supposed to do. • It defines the function of the internal processes in the system with the aid of Data Flow Diagrams (DFDs). • It depicts the functional derivation of the data values without indicating how they are derived when they are computed, or why they need to be computed. • A functional modelling perspective concentrates on describing the dynamic process.
  • 3.
    Various Functional Models •One of the first well defined function models, was the Functional Flow Block Diagram (FFBD) developed by the defence-related TRW Incorporated in the 1950s. • Data Flow Diagram
  • 4.
  • 5.
    Introduction • The FFBDnotation was developed in the 1950s, and is widely used in classical systems engineering. • FFBDs are one of the classic business process modelling methodologies, along with : – flow charts, – data flow diagrams, – control flow diagrams, etc
  • 6.
    Function flow block diagram •A functional block diagram is a block diagram, that describes the functions and interrelationships of a system. The functional block diagram can picture: – Functions of a system pictured by blocks – Input and output elements of a block pictured with lines, and – Relationships between the functions – Functional sequences and paths for matter and or signals – The block diagram can use additional schematic symbols to show particular properties. – Specific function block diagram are the classic Functional Flow Block Diagram, and the Function Block Diagram (FBD) used in the design of programmable logic controllers.
  • 7.
    • Function block:Each function on an FFBD should be separate and be represented by single box (solid line). Each function needs to stand for definite, finite, discrete action to be accomplished by system elements. • Function numbering: Each level should have a consistent number scheme and provide information concerning function origin. These numbers establish identification and relationships that will carry through all Functional Analysis and Allocation activities and facilitate traceability from lower to top levels.
  • 8.
    • Functional reference:Each diagram should contain a reference to other functional diagrams by using a functional reference (box in brackets). • Flow connection: Lines connecting functions should only indicate function flow and not a lapse in time or intermediate activity. • Flow direction: Diagrams should be laid out so that the flow direction is generally from left to right. Arrows are often used to indicate functional flows.
  • 9.
    • Summing gates:A circle is used to denote a summing gate and is used when AND/OR is present. AND is used to indicate parallel functions and all conditions must be satisfied to proceed. OR is used to indicate that alternative paths can be satisfied to proceed. • GO and NO-GO paths: “G” and “bar G” are used to denote “go” and “no-go” conditions. These symbols are placed adjacent to lines leaving a particular function to indicate alternative paths.
  • 10.
    • AND: Acondition in which all preceding or succeeding paths are required. • Exclusive OR: A condition in which one of multiple preceding or succeeding paths is required, but not all. • Inclusive OR: A condition in which one, some, or all of the multiple preceding or succeeding paths are required
  • 11.
    Data Flow Diagram AlreadyDiscussed Refer to DFD PPTs
  • 12.
    Problems with Functional Modeling •Functional Modeling is not about modeling real things. It is about writing expressions which describe the relationship between things. Also, one tends to model what the program does, not what it does it to. • Functional Programming encourages writing pure, generic functions which allow making decisions at the top level of the call hierarchy. This is the opposite philosophy to Object-oriented design, which encourages deferring actual behaviour to decisions taken low down by overriding class methods.