Downloaded 598 times


![Example of Activity Diagram…
Fill-in
form
Check
form
[Incorrect]
[Correct]
Display student
screen
Input student
information Search for Student
selection list
Verify the
applications
Regret message
Create record
Regret
registration
[No Match]
[Match]
[Not Found]
[Found]
1
StudentRegistrarSystem
2/19/2015 16
Lokendra Prajapati (MCA) Acropolis
Institute of Technology & Research](https://image.slidesharecdn.com/activitydiagram1-150219083243-conversion-gate02/85/Activity-diagram-16-320.jpg)
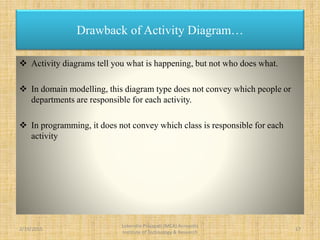


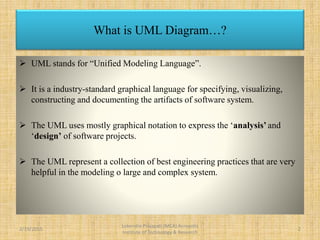
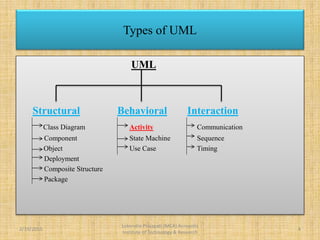
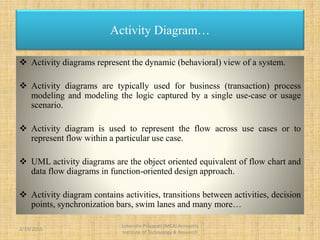
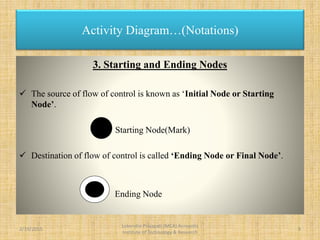
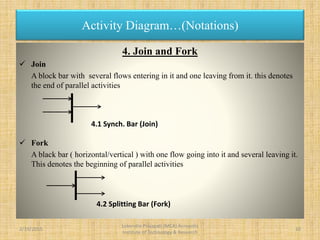
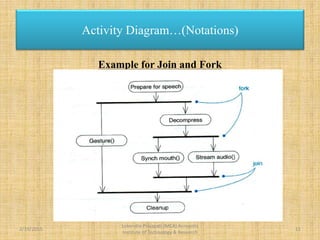
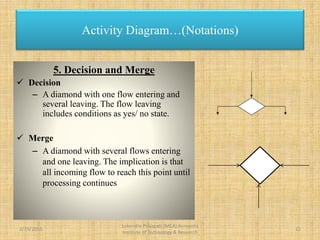
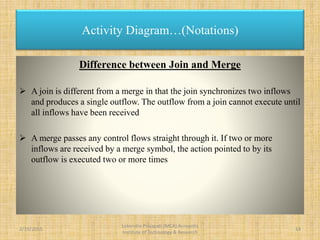
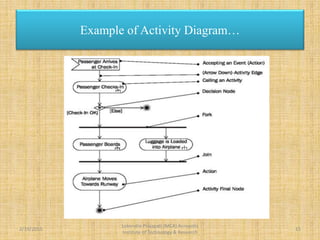
The document presents an overview of UML (Unified Modeling Language) and its significance in modeling software systems, highlighting the importance of activity diagrams in representing dynamic behaviors and workflows. It explains various notations used in activity diagrams, including activities, flows, start and end nodes, joins, forks, and decisions. The document also discusses the limitations of activity diagrams regarding responsibility attribution in domain modeling and programming.