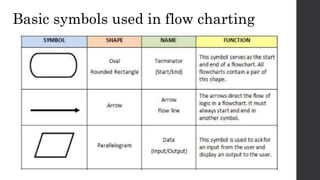
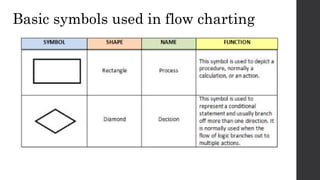
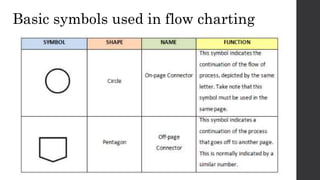
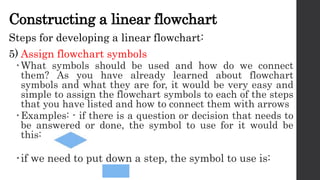
Prepare and
Interpret Technical
Drawing
Prepare and Interpret Technical Drawing
• Basic Symbols Used in Technical Drawing
• Selection of Technical Drawing in Accordance with the
Job Requirement
• Interpreting the Symbols Used in Flow Charting
Basic Symbols Used
in Technical Drawing
Objectives
At the end of the lesson, you will be able to
a. identify basic symbols used in technical drawing.
What is technical drawing?
Technical drawing, also known as drafting, is a
technique used to visually illustrate the processes
involved in a project. It uses a set of symbols, visual
styles and page layout to make it easier to
comprehend. A technical drawing can either be created
using the traditional free-hand method or by using a
Computer Aided Design (CAD) software. Either way,
both method must produce an accurate illustration, for
this will be the primary basis for the completion of the
project.
What is technical drawing?
One of the basic form of a technical drawing is a
flowchart. A flowchart is a type of diagram that
normally used to illustrate an algorithm, a set of steps
in a process, or phases in solving a particular problem.
Using a flowchart is an effective way of showing a
technical process into a more people-friendly form.
Flowcharts are usually formed using different symbols
represented by shapes. The most common symbols are
enumerated below:
Flow Chart Symbols
• Terminator
– this symbol is
represented by an oval or
rectangle with curved
corners. It always appears
at the start and end of a
flowchart.
Flow Chart Symbols
Input/Output
– this symbol is
represented by a
parallelogram. It is used to
ask an input from the user
and display and output.
The contents of this
symbol are usually
represented by a variable,
a value that always
changes.
Flow Chart Symbols
Process
– this symbol is
represented by a rectangle.
It may refer to a certain
action, activity, or a
computation. The contents
of this symbol must always
be accurate so as not to
mislead the person
viewing the flowchart.
Words or equations can be
contained in this symbol.
Flow Chart Symbols
Subprocess
– this symbol is
represented by a rectangle
with double lines on both
sides. This is part of a
major process that can
further be broken down to
be a flowchart of its own.
The contents of this
symbol also follows the
characteristics of the
process symbol.
Flow Chart Symbols
Decision
– this symbol is
represented by a diamond.
It is used for a conditional
statement that will yield
more than one direction. It
is normally used when the
flow of logic branches out
to multiple actions.
Flow Chart Symbols
Arrow Lines or Flow Lines
– this symbol is
represented by an arrow
with a single direction.
The arrows direct the flow
of logic in a flowchart. It
must always start and end
in another symbol.
Flow Chart Symbols
Connector
– this symbol connects two
points of a flowchart in
case it reaches the edge of
the page. A circle labeled
by a letter is used if the
flowchart continues on the
same page. A pentagon
labeled with a number is
used if the flowchart
continues in a different
page.
Basic symbols used in flow charting
Other Flow Chart Symbols
Flow Chart Symbols
The use of technical drawings such as a flowchart will
help in promoting a common understanding on
processes and projects. It may also replace pages of
explanations into a more concise and simple
illustration. Lastly, it is a helpful tool in standardizing
processes and procedures.
Selection of Technical
Drawing in
Accordance with the
Job Requirement
Objectives
At the end of the lesson, you will be able to
a. select technical drawing in accordance with the job
requirement.
A technical drawing serves as an important factor in the
completion of any project because shows the different
processes and procedures in completing it. It must
always adhere to a specific set of standards so that
everyone can interpret it as the same. An example of a
technical drawing that is used to interpret a set of
processes and procedures is called a flowchart.
Flow Chart Symbols
A flowchart is made up of different symbols that
signifies a unique activity. A different type of flowchart
is needed to illustrate a project with different job
requirements. Some of these types are listed below:
Type of Flowchart
Basic – this is often used
to define and document
basic work and data flows,
financial, production and
quality management
processes to increase
efficiency.
Type of Flowchart
Cross Functional – this is
often used to show the
relationship between a
business process and the
functional units
responsible for that
process.
Type of Flowchart
Data Flow Diagram – this
shows how the data is
processed. It is convenient
to use when you want to
design or examine a
system. Although most
often used for software, it
can be used to analyze any
type of information flow.
Type of Flowchart
Procedural – this involves
creating a flowchart model
that illustrates and
analyzes the overall flow of
activities in producing a
product or service.
Type of Flowchart
Process Flow – this type is
commonly used to depict
the major processes within
a project and shows their
relationship with one
another. It can be used for
mapping out roles and
responsibilities within an
organization to gain clarity
or for drawing up a
proposal for a new process
or project.
Program – this a graphic
representation of an
algorithm, often used in
the design phase of
programming to work out
the logical flow of a
program. It demonstrates
how a program works
within a system.
Type of Flowchart
Work Flow Diagram – this
is used to create diagrams
of information flow. A work
flow diagram illustrates
the way a business or
process functions.
Other Types of Flowchart
Linear Flowchart – a
diagram that shows the
sequence of steps that are
included in a process. This
can help identify rework
and unnecessary steps in a
process.
Other Types of Flowchart
Deployment Flowchart
– shows actual process
flow and identifies the
people involved in each
step. Horizontal lines
define customer-supplier
relationships. This type of
flowchart shows where the
people fit in the steps
included and how they
relate to one another
throughout the procedure.
Constructing a linear flowchart
Below are the
steps for
developing a
linear flowchart:
Constructing a linear flowchart
Steps for developing a linear flowchart:
1) Define the procedure that needs to be flowcharted
 Think about the process that you need to create a flow chart
on.
 Examples: how to create a PowerPoint presentation; cleaning
parts of the computer
2) Gather the right people to develop the flowchart
 Who do you think will be the best people to do the task that
needs to be done?
 Examples: troubleshooting a network problem will be best
done by computer technicians; building a cement post for a
house will be best done by construction workers
Constructing a linear flowchart
Steps for developing a linear flowchart:
3) Establish boundaries in the process
Think about what should be the starting and ending point
of the task.
Example: in CPU disassembly, we do not need to include
steps that pertain to disassembly of the automatic voltage
regulator
Constructing a linear flowchart
Steps for developing a linear flowchart:
4) List the steps, activities, and decisions
Think about the steps or activities that need to be done.
Try to foresee what decisions might come up that needs to
be resolved.
Examples: if the task to be done is cleaning parts of the
computer, we can say that one of the steps to list down is
preparing the tools needed for cleaning; a decision or
problem that might need solving could be something about
insufficient cleaning solution
Constructing a linear flowchart
Steps for developing a linear flowchart:
5) Assign flowchart symbols
What symbols should be used and how do we connect
them? As you have already learned about flowchart
symbols and what they are for, it would be very easy and
simple to assign the flowchart symbols to each of the steps
that you have listed and how to connect them with arrows
Examples: - if there is a question or decision that needs to
be answered or done, the symbol to use for it would be
this:
if we need to put down a step, the symbol to use is:
Constructing a linear flowchart
Steps for developing a linear flowchart:
6) Analyze and name the flowchart
Looking at all the steps that you have listed, think about
what title would best suit the flowchart.
Examples: steps that include ‘wipe the LCD screen’ would
best be titled as “Cleaning Computer Parts”; while steps
that include ‘twist screw off from the unit’ may be titled as
“Disassembling the CPU”
Type of Flowchart
It is important to determine the job requirements first
before figuring out what type of technical drawing
should be used. Careful consideration on these
requirements will not only result in a richer illustration,
but will also help the viewers to understand it clearly.
Interpreting the
Symbols Used in
Flow Charting
Objectives
At the end of the lesson, you will be able to
a. interpret the symbols used in flow charting.
• Having a flowchart will help one in understanding a
process as well as aid in finding ways to help improve
the steps involved in a task. By examining or
interpreting a flowchart you will be able to:
 find out who is involved in the task
 form theories about root causes
 help make the steps more efficient
 find out how to apply changes to the process
 locate steps that only add cost
 conduct or provide training on how the process or task is
done
Steps on how to analyze a flowchart.
1) Examine Each Step
• bottlenecks – these are parts where the process is slowed down
example: unnecessary steps, rework, or other factors; a step
saying, “technicians will go to storage to get needed tools”
• weak links – these are steps where problems occur because of
insufficient knowledge or training example: assigning people
not trained well to do a specific task
• poorly defined step – these are steps that are not properly
worded which can be misunderstood and may lead to the step
being done in a different way or even incorrectly example: a
step saying “improvise what tool will help”
Steps on how to analyze a flowchart.
2) analyze each decision symbol
• check how often the “yes” or “no” answers in decision points
(diamond shaped symbol) always seem to go in one direction. If
this is the case, we can consider removing the decision point
that causes this
• example: a decision point asking “is the part free from dust?”: it
may be possible that where the person is cleaning the computer
part has a lot of dust where it may be difficult to eliminate all of
it, which may result to the decision point being answered “NO”
Steps on how to analyze a flowchart.
3) check each rework loop
• look for ways to shorten or eliminate the loop
• example: step/s that is making the process go back to a step
multiple times
4) examine each activity symbol
• consider eliminating steps that does not help with the quality of
result or end product or only add cost example: a step saying,
“wait until tool needed is available”

Prepare and Interpret Technical Drawing.pptx

  • 1.
  • 2.
    Prepare and InterpretTechnical Drawing • Basic Symbols Used in Technical Drawing • Selection of Technical Drawing in Accordance with the Job Requirement • Interpreting the Symbols Used in Flow Charting
  • 3.
    Basic Symbols Used inTechnical Drawing
  • 4.
    Objectives At the endof the lesson, you will be able to a. identify basic symbols used in technical drawing.
  • 5.
    What is technicaldrawing? Technical drawing, also known as drafting, is a technique used to visually illustrate the processes involved in a project. It uses a set of symbols, visual styles and page layout to make it easier to comprehend. A technical drawing can either be created using the traditional free-hand method or by using a Computer Aided Design (CAD) software. Either way, both method must produce an accurate illustration, for this will be the primary basis for the completion of the project.
  • 6.
    What is technicaldrawing? One of the basic form of a technical drawing is a flowchart. A flowchart is a type of diagram that normally used to illustrate an algorithm, a set of steps in a process, or phases in solving a particular problem. Using a flowchart is an effective way of showing a technical process into a more people-friendly form. Flowcharts are usually formed using different symbols represented by shapes. The most common symbols are enumerated below:
  • 7.
    Flow Chart Symbols •Terminator – this symbol is represented by an oval or rectangle with curved corners. It always appears at the start and end of a flowchart.
  • 8.
    Flow Chart Symbols Input/Output –this symbol is represented by a parallelogram. It is used to ask an input from the user and display and output. The contents of this symbol are usually represented by a variable, a value that always changes.
  • 9.
    Flow Chart Symbols Process –this symbol is represented by a rectangle. It may refer to a certain action, activity, or a computation. The contents of this symbol must always be accurate so as not to mislead the person viewing the flowchart. Words or equations can be contained in this symbol.
  • 10.
    Flow Chart Symbols Subprocess –this symbol is represented by a rectangle with double lines on both sides. This is part of a major process that can further be broken down to be a flowchart of its own. The contents of this symbol also follows the characteristics of the process symbol.
  • 11.
    Flow Chart Symbols Decision –this symbol is represented by a diamond. It is used for a conditional statement that will yield more than one direction. It is normally used when the flow of logic branches out to multiple actions.
  • 12.
    Flow Chart Symbols ArrowLines or Flow Lines – this symbol is represented by an arrow with a single direction. The arrows direct the flow of logic in a flowchart. It must always start and end in another symbol.
  • 13.
    Flow Chart Symbols Connector –this symbol connects two points of a flowchart in case it reaches the edge of the page. A circle labeled by a letter is used if the flowchart continues on the same page. A pentagon labeled with a number is used if the flowchart continues in a different page.
  • 14.
    Basic symbols usedin flow charting
  • 15.
    Basic symbols usedin flow charting
  • 16.
    Basic symbols usedin flow charting
  • 17.
  • 18.
  • 19.
  • 20.
  • 21.
    Flow Chart Symbols Theuse of technical drawings such as a flowchart will help in promoting a common understanding on processes and projects. It may also replace pages of explanations into a more concise and simple illustration. Lastly, it is a helpful tool in standardizing processes and procedures.
  • 22.
    Selection of Technical Drawingin Accordance with the Job Requirement
  • 23.
    Objectives At the endof the lesson, you will be able to a. select technical drawing in accordance with the job requirement.
  • 24.
    A technical drawingserves as an important factor in the completion of any project because shows the different processes and procedures in completing it. It must always adhere to a specific set of standards so that everyone can interpret it as the same. An example of a technical drawing that is used to interpret a set of processes and procedures is called a flowchart.
  • 25.
    Flow Chart Symbols Aflowchart is made up of different symbols that signifies a unique activity. A different type of flowchart is needed to illustrate a project with different job requirements. Some of these types are listed below:
  • 26.
    Type of Flowchart Basic– this is often used to define and document basic work and data flows, financial, production and quality management processes to increase efficiency.
  • 27.
    Type of Flowchart CrossFunctional – this is often used to show the relationship between a business process and the functional units responsible for that process.
  • 28.
    Type of Flowchart DataFlow Diagram – this shows how the data is processed. It is convenient to use when you want to design or examine a system. Although most often used for software, it can be used to analyze any type of information flow.
  • 29.
    Type of Flowchart Procedural– this involves creating a flowchart model that illustrates and analyzes the overall flow of activities in producing a product or service.
  • 30.
    Type of Flowchart ProcessFlow – this type is commonly used to depict the major processes within a project and shows their relationship with one another. It can be used for mapping out roles and responsibilities within an organization to gain clarity or for drawing up a proposal for a new process or project.
  • 31.
    Program – thisa graphic representation of an algorithm, often used in the design phase of programming to work out the logical flow of a program. It demonstrates how a program works within a system.
  • 32.
    Type of Flowchart WorkFlow Diagram – this is used to create diagrams of information flow. A work flow diagram illustrates the way a business or process functions.
  • 33.
    Other Types ofFlowchart Linear Flowchart – a diagram that shows the sequence of steps that are included in a process. This can help identify rework and unnecessary steps in a process.
  • 34.
    Other Types ofFlowchart Deployment Flowchart – shows actual process flow and identifies the people involved in each step. Horizontal lines define customer-supplier relationships. This type of flowchart shows where the people fit in the steps included and how they relate to one another throughout the procedure.
  • 35.
    Constructing a linearflowchart Below are the steps for developing a linear flowchart:
  • 36.
    Constructing a linearflowchart Steps for developing a linear flowchart: 1) Define the procedure that needs to be flowcharted  Think about the process that you need to create a flow chart on.  Examples: how to create a PowerPoint presentation; cleaning parts of the computer 2) Gather the right people to develop the flowchart  Who do you think will be the best people to do the task that needs to be done?  Examples: troubleshooting a network problem will be best done by computer technicians; building a cement post for a house will be best done by construction workers
  • 37.
    Constructing a linearflowchart Steps for developing a linear flowchart: 3) Establish boundaries in the process Think about what should be the starting and ending point of the task. Example: in CPU disassembly, we do not need to include steps that pertain to disassembly of the automatic voltage regulator
  • 38.
    Constructing a linearflowchart Steps for developing a linear flowchart: 4) List the steps, activities, and decisions Think about the steps or activities that need to be done. Try to foresee what decisions might come up that needs to be resolved. Examples: if the task to be done is cleaning parts of the computer, we can say that one of the steps to list down is preparing the tools needed for cleaning; a decision or problem that might need solving could be something about insufficient cleaning solution
  • 39.
    Constructing a linearflowchart Steps for developing a linear flowchart: 5) Assign flowchart symbols What symbols should be used and how do we connect them? As you have already learned about flowchart symbols and what they are for, it would be very easy and simple to assign the flowchart symbols to each of the steps that you have listed and how to connect them with arrows Examples: - if there is a question or decision that needs to be answered or done, the symbol to use for it would be this: if we need to put down a step, the symbol to use is:
  • 40.
    Constructing a linearflowchart Steps for developing a linear flowchart: 6) Analyze and name the flowchart Looking at all the steps that you have listed, think about what title would best suit the flowchart. Examples: steps that include ‘wipe the LCD screen’ would best be titled as “Cleaning Computer Parts”; while steps that include ‘twist screw off from the unit’ may be titled as “Disassembling the CPU”
  • 41.
    Type of Flowchart Itis important to determine the job requirements first before figuring out what type of technical drawing should be used. Careful consideration on these requirements will not only result in a richer illustration, but will also help the viewers to understand it clearly.
  • 42.
  • 43.
    Objectives At the endof the lesson, you will be able to a. interpret the symbols used in flow charting.
  • 44.
    • Having aflowchart will help one in understanding a process as well as aid in finding ways to help improve the steps involved in a task. By examining or interpreting a flowchart you will be able to:  find out who is involved in the task  form theories about root causes  help make the steps more efficient  find out how to apply changes to the process  locate steps that only add cost  conduct or provide training on how the process or task is done
  • 45.
    Steps on howto analyze a flowchart. 1) Examine Each Step • bottlenecks – these are parts where the process is slowed down example: unnecessary steps, rework, or other factors; a step saying, “technicians will go to storage to get needed tools” • weak links – these are steps where problems occur because of insufficient knowledge or training example: assigning people not trained well to do a specific task • poorly defined step – these are steps that are not properly worded which can be misunderstood and may lead to the step being done in a different way or even incorrectly example: a step saying “improvise what tool will help”
  • 46.
    Steps on howto analyze a flowchart. 2) analyze each decision symbol • check how often the “yes” or “no” answers in decision points (diamond shaped symbol) always seem to go in one direction. If this is the case, we can consider removing the decision point that causes this • example: a decision point asking “is the part free from dust?”: it may be possible that where the person is cleaning the computer part has a lot of dust where it may be difficult to eliminate all of it, which may result to the decision point being answered “NO”
  • 47.
    Steps on howto analyze a flowchart. 3) check each rework loop • look for ways to shorten or eliminate the loop • example: step/s that is making the process go back to a step multiple times 4) examine each activity symbol • consider eliminating steps that does not help with the quality of result or end product or only add cost example: a step saying, “wait until tool needed is available”