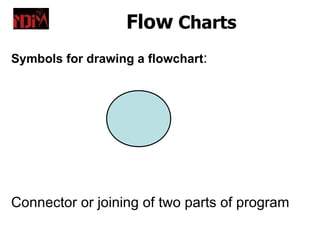
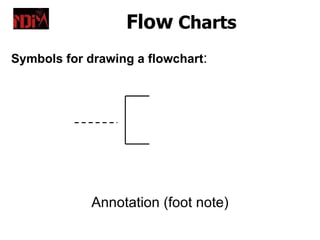
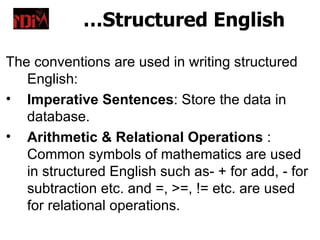
Flow charts are diagrams that represent a sequence of steps to solve a problem. They use standard symbols to visually depict the logic and processes within a program or system. Flow charts facilitate communication between programmers and non-technical stakeholders. Guidelines for effective flow charts include using a logical structure, clear symbols, and ensuring the chart has a defined start and end. Pseudocode and structured English are additional tools to represent programming logic at a higher level before implementation in a specific coding language.
To understand algorithm and flowchart, it is better to refer this Slideshare that I have created. I have thoroughly presented the key points that make easy in remembering what algorithm and flowchart is. The slide is really simple and wonderful to use it for a quick reference.
Paper presentation at the Workshop on Visual Analytics in Healthcare in conjunction with the IEEE VisWeek 2011, Providence, RI, 2011.
Abstract:
Electronic Medical Record (EMR) databases contain a large amount of temporal events
such as diagnosis dates for various symptoms.
Analyzing disease progression pathways in terms of these observed events
can provide important insights into how diseases evolve over time.
Moreover, connecting these pathways to the eventual outcomes of the corresponding patients
can help clinicians understand how certain progression paths may lead to better or worse outcomes.
In this paper, we describe the Outflow visualization technique,
designed to summarize temporal event data that has been extracted from the EMRs of a cohort of patients.
We include sample analyses to show examples of the insights that can be learned from this visualization.
Computer programming:Know How to FlowchartAngelo Tomboc
This topic guides you how to flowchart...What are the symbols. Some mathematical symbols are included to especially equal,more than, less than, not equal, more than or equal to, and less than or equal to. Flowcharting...what is that???Flowcharting is just a building house using your bricks, tools in carpenter, and a blueprint...So, [G]LHF ([G]OOD LUCK HAVE FUN) ^_^
Determining Requirements In System Analysis And DsignAsaduzzaman Kanok
Requirements determination and requirements structuring are two core components of system analysis. Traditionally, interviewing, questionnaires, directly observing and analyzing documents are four main methods adopted by system analysts to collect information. JAD and prototyping are two modern requirements determination methodologies, which are developed and based on the previous traditional methods. A well-structured representation of system requirements can dramatically improve the communication among analysts, designers, users, and programmers. DFD, structured English, decision tables, decision trees, and E-R diagrams are traditional primary requirements structuring tools. Nowadays, RAD and OOA are emerging to help streamline and shorten the total SDLC. While RAD SDLC packs traditional analysis phase and part of design phase into one step, OOA tries to make the outcomes of analysis phase can be reused by the following developing phases
Check out this guide for flowchart symbols meaning explained. If you need to know which flowchart symbols to use, all standard shapes and their definitions are explained on this page.
Alt. GDG Cloud Southlake #33: Boule & Rebala: Effective AppSec in SDLC using ...James Anderson
Effective Application Security in Software Delivery lifecycle using Deployment Firewall and DBOM
The modern software delivery process (or the CI/CD process) includes many tools, distributed teams, open-source code, and cloud platforms. Constant focus on speed to release software to market, along with the traditional slow and manual security checks has caused gaps in continuous security as an important piece in the software supply chain. Today organizations feel more susceptible to external and internal cyber threats due to the vast attack surface in their applications supply chain and the lack of end-to-end governance and risk management.
The software team must secure its software delivery process to avoid vulnerability and security breaches. This needs to be achieved with existing tool chains and without extensive rework of the delivery processes. This talk will present strategies and techniques for providing visibility into the true risk of the existing vulnerabilities, preventing the introduction of security issues in the software, resolving vulnerabilities in production environments quickly, and capturing the deployment bill of materials (DBOM).
Speakers:
Bob Boule
Robert Boule is a technology enthusiast with PASSION for technology and making things work along with a knack for helping others understand how things work. He comes with around 20 years of solution engineering experience in application security, software continuous delivery, and SaaS platforms. He is known for his dynamic presentations in CI/CD and application security integrated in software delivery lifecycle.
Gopinath Rebala
Gopinath Rebala is the CTO of OpsMx, where he has overall responsibility for the machine learning and data processing architectures for Secure Software Delivery. Gopi also has a strong connection with our customers, leading design and architecture for strategic implementations. Gopi is a frequent speaker and well-known leader in continuous delivery and integrating security into software delivery.
Generative AI Deep Dive: Advancing from Proof of Concept to ProductionAggregage
Join Maher Hanafi, VP of Engineering at Betterworks, in this new session where he'll share a practical framework to transform Gen AI prototypes into impactful products! He'll delve into the complexities of data collection and management, model selection and optimization, and ensuring security, scalability, and responsible use.
Unlocking Productivity: Leveraging the Potential of Copilot in Microsoft 365, a presentation by Christoforos Vlachos, Senior Solutions Manager – Modern Workplace, Uni Systems
Securing your Kubernetes cluster_ a step-by-step guide to success !KatiaHIMEUR1
Today, after several years of existence, an extremely active community and an ultra-dynamic ecosystem, Kubernetes has established itself as the de facto standard in container orchestration. Thanks to a wide range of managed services, it has never been so easy to set up a ready-to-use Kubernetes cluster.
However, this ease of use means that the subject of security in Kubernetes is often left for later, or even neglected. This exposes companies to significant risks.
In this talk, I'll show you step-by-step how to secure your Kubernetes cluster for greater peace of mind and reliability.
GraphRAG is All You need? LLM & Knowledge GraphGuy Korland
Guy Korland, CEO and Co-founder of FalkorDB, will review two articles on the integration of language models with knowledge graphs.
1. Unifying Large Language Models and Knowledge Graphs: A Roadmap.
https://arxiv.org/abs/2306.08302
2. Microsoft Research's GraphRAG paper and a review paper on various uses of knowledge graphs:
https://www.microsoft.com/en-us/research/blog/graphrag-unlocking-llm-discovery-on-narrative-private-data/
GraphSummit Singapore | The Art of the Possible with Graph - Q2 2024Neo4j
Neha Bajwa, Vice President of Product Marketing, Neo4j
Join us as we explore breakthrough innovations enabled by interconnected data and AI. Discover firsthand how organizations use relationships in data to uncover contextual insights and solve our most pressing challenges – from optimizing supply chains, detecting fraud, and improving customer experiences to accelerating drug discoveries.
Transcript: Selling digital books in 2024: Insights from industry leaders - T...BookNet Canada
The publishing industry has been selling digital audiobooks and ebooks for over a decade and has found its groove. What’s changed? What has stayed the same? Where do we go from here? Join a group of leading sales peers from across the industry for a conversation about the lessons learned since the popularization of digital books, best practices, digital book supply chain management, and more.
Link to video recording: https://bnctechforum.ca/sessions/selling-digital-books-in-2024-insights-from-industry-leaders/
Presented by BookNet Canada on May 28, 2024, with support from the Department of Canadian Heritage.
Epistemic Interaction - tuning interfaces to provide information for AI supportAlan Dix
Paper presented at SYNERGY workshop at AVI 2024, Genoa, Italy. 3rd June 2024
https://alandix.com/academic/papers/synergy2024-epistemic/
As machine learning integrates deeper into human-computer interactions, the concept of epistemic interaction emerges, aiming to refine these interactions to enhance system adaptability. This approach encourages minor, intentional adjustments in user behaviour to enrich the data available for system learning. This paper introduces epistemic interaction within the context of human-system communication, illustrating how deliberate interaction design can improve system understanding and adaptation. Through concrete examples, we demonstrate the potential of epistemic interaction to significantly advance human-computer interaction by leveraging intuitive human communication strategies to inform system design and functionality, offering a novel pathway for enriching user-system engagements.
In his public lecture, Christian Timmerer provides insights into the fascinating history of video streaming, starting from its humble beginnings before YouTube to the groundbreaking technologies that now dominate platforms like Netflix and ORF ON. Timmerer also presents provocative contributions of his own that have significantly influenced the industry. He concludes by looking at future challenges and invites the audience to join in a discussion.
A tale of scale & speed: How the US Navy is enabling software delivery from l...sonjaschweigert1
Rapid and secure feature delivery is a goal across every application team and every branch of the DoD. The Navy’s DevSecOps platform, Party Barge, has achieved:
- Reduction in onboarding time from 5 weeks to 1 day
- Improved developer experience and productivity through actionable findings and reduction of false positives
- Maintenance of superior security standards and inherent policy enforcement with Authorization to Operate (ATO)
Development teams can ship efficiently and ensure applications are cyber ready for Navy Authorizing Officials (AOs). In this webinar, Sigma Defense and Anchore will give attendees a look behind the scenes and demo secure pipeline automation and security artifacts that speed up application ATO and time to production.
We will cover:
- How to remove silos in DevSecOps
- How to build efficient development pipeline roles and component templates
- How to deliver security artifacts that matter for ATO’s (SBOMs, vulnerability reports, and policy evidence)
- How to streamline operations with automated policy checks on container images
The Art of the Pitch: WordPress Relationships and SalesLaura Byrne
Clients don’t know what they don’t know. What web solutions are right for them? How does WordPress come into the picture? How do you make sure you understand scope and timeline? What do you do if sometime changes?
All these questions and more will be explored as we talk about matching clients’ needs with what your agency offers without pulling teeth or pulling your hair out. Practical tips, and strategies for successful relationship building that leads to closing the deal.
Dr. Sean Tan, Head of Data Science, Changi Airport Group
Discover how Changi Airport Group (CAG) leverages graph technologies and generative AI to revolutionize their search capabilities. This session delves into the unique search needs of CAG’s diverse passengers and customers, showcasing how graph data structures enhance the accuracy and relevance of AI-generated search results, mitigating the risk of “hallucinations” and improving the overall customer journey.
Observability Concepts EVERY Developer Should Know -- DeveloperWeek Europe.pdfPaige Cruz
Monitoring and observability aren’t traditionally found in software curriculums and many of us cobble this knowledge together from whatever vendor or ecosystem we were first introduced to and whatever is a part of your current company’s observability stack.
While the dev and ops silo continues to crumble….many organizations still relegate monitoring & observability as the purview of ops, infra and SRE teams. This is a mistake - achieving a highly observable system requires collaboration up and down the stack.
I, a former op, would like to extend an invitation to all application developers to join the observability party will share these foundational concepts to build on:
Sudheer Mechineni, Head of Application Frameworks, Standard Chartered Bank
Discover how Standard Chartered Bank harnessed the power of Neo4j to transform complex data access challenges into a dynamic, scalable graph database solution. This keynote will cover their journey from initial adoption to deploying a fully automated, enterprise-grade causal cluster, highlighting key strategies for modelling organisational changes and ensuring robust disaster recovery. Learn how these innovations have not only enhanced Standard Chartered Bank’s data infrastructure but also positioned them as pioneers in the banking sector’s adoption of graph technology.
2. Flow Charts
•A diagrammatic representation that illustrates the
sequence of operations to be performed to get the solution
of a problem.
• Generally drawn in the early stages of formulating
computer solutions.
• Facilitate communication between programmers and
business people.
• Play a vital role in the programming of a problem and are
quite helpful in understanding the logic of complicated and
lengthy problems.
• Once the flowchart is drawn, it becomes easy to write the
program in any high level language.
• Must for the better documentation of a complex program.
3. Flow Charts
A flow chart can be used to:
• Define and analyse processes.
• Build a step-by-step picture of the process
for analysis, discussion, or communication.
• Define, standardise or find areas for
improvement in a process.
15. Flow Charts
Guidelines in flowcharting -
• In drawing a proper flowchart, all necessary
requirements should be listed out in logical order.
• The flowchart should be clear, neat and easy to
follow. There should not be any room for
ambiguity in understanding the flowchart.
• The usual direction of the flow of a procedure or
system is from left to right or top to bottom.
16. Flow Charts
…Guidelines in flowcharting -
• Only one flow line should come out from a
process symbol.
OR
17. Flow Charts
…Guidelines in flowcharting -
• Only one flow line should enter a decision
symbol, but two or three flow lines, one for
each possible answer, should leave the
decision symbol.
18. Flow Charts
…Guidelines in flowcharting –
Only one flow line is used in conjunction
with terminal symbol.
19. Flow Charts
…Guidelines in flowcharting –
Write within standard symbols briefly. As
necessary, you can use the annotation
symbol to describe data or computational
steps more clearly.
This is confidential data
20. Flow Charts
…Guidelines in flowcharting –
• In case of complex flowchart, it is better to use
connector symbols to reduce the number of flow
lines. Avoid the intersection of flow lines.
• Ensure that the flowchart has a logical start and
finish.
• It is useful to test the validity of the flowchart by
passing through it with a simple test data.
21. Flow Charts
Advantages Of Using Flowcharts :
• Effective communication
• Effective analysis
• Proper documentation
• Efficient Coding
• Proper Debugging
• Efficient Program Maintenance
22. Flow Charts
Limitations of using Flowcharts :
• Complex logic: Sometimes, the program
logic is quite complicated.
• Alterations and Modifications:
Alterations may require re-drawing
completely.
• Reproduction: As the flowchart symbols
cannot be typed, reproduction of flowchart
becomes a problem.
29. Assignment
Fill in the blanks-
2. A program flowchart indicates the_________ to be performed and
the __________ in which they occur.
3. A program flowchart is generally read from _____________ to
________________
4. Flowcharting symbols are connected together by means of
___________________
5. A decision symbol may be used in determining the ____________ or
___________ of two data items.
6. __________ are used to join remote portions of a flowchart
7. ____________ connectors are used when a flowchart ends on one
page and begins again on other page
8. A ________ symbol is used at the beginning and end of a flowchart.
9. The flowchart is one of the best ways of ________ a program..
10. To construct a flowchart, one must adhere to prescribed symbols
provided by the __________ .
11. The program uses a ____________ to aid it in drawing flowchart
symbols.
30. Answers
• Operations, sequence
• Top, down
• Flow line
• Equality, inequality
• connectors
• Off -page
• Terminal
• documenting
• ANSI (American National Standards Institute)
• Flowcharting template
32. Structured English
• Structured English is a tool used to represent
process logic.
• Syntax rules are not very strict & an English
statement is used to specify an action.
• The main aim is to allow easy readability, which
helps in documentation.
Two building blocks of Structured English:
6. Structured logic or instructions organized into
nested or grouped procedures
7. Simple English statements such as add, multiply,
move
33. Structured English
Four conventions to follow when using Structured
English:
• Express all logic in terms of sequential structures,
decision structures, or iterations.
• Use upper case for keywords such as: IF, THEN,
ELSE, DO, DO WHILE, DO UNTIL, PERFORM
• Indent blocks of statements to show their
hierarchy (nesting) clearly.
• When words or phrases have been defined,
underline those words or phrases to indicate that
they have a specialised, reserved meaning.
34. The Flow of Structured English
Plain Structured Pseudocode Programs
English English
User Analyst Programmer
35. …Structured English
The conventions are used in writing structured
English:
• Imperative Sentences: Store the data in
database.
• Arithmetic & Relational Operations :
Common symbols of mathematics are used
in structured English such as- + for add, - for
subtraction etc. and =, >=, != etc. are used
for relational operations.
36. …Structured English
3. Decision Structures: If Then Else, Select
Case
4. Repetion: Loops
There are various forms in which structured
english can be implemented to solve the
problem. e.g. Algorithm, Flowchart,
pseudocode.
38. Writing Structured English
Repetition Conditions
IF … THEN …
DO
statements …
statements … ELSE
UNTIL end-condition statements …
END IF
or or
SELECT
CASE 1 (conditions)
DO WHILE
statements …
statements … CASE 2 …
END DO statements …
END SELECT
40. Pseudocode
• An outline of a program, written in a
form that can easily be converted into
real programming statements.
• Pseudocode cannot be compiled nor
executed, and there are no real
formatting or syntax rules.
41. …Pseudocode
• It enables the programmer to
concentrate on the algorithms without
worrying about all the syntactic details
of a particular programming language.
• Flowcharts can be thought of as a
graphical form of pseudocode.
42. Example of Pseudocode
Regular code (written in PHP):
<?php
if (is_valid($cc_number))
{ execute_transaction($cc_number, $order); }
else { show_failure(); }
?>
Pseudocode:
if credit card number is valid
execute transaction based on number and
order
else show a generic failure message
end if