Download to read offline


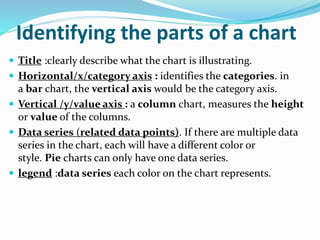
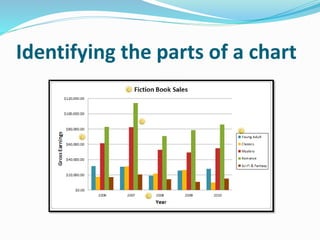
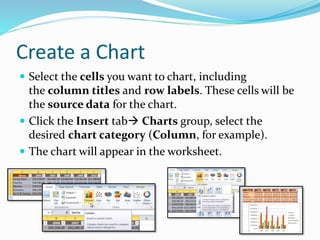
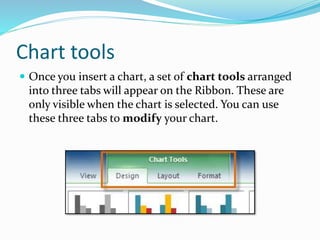
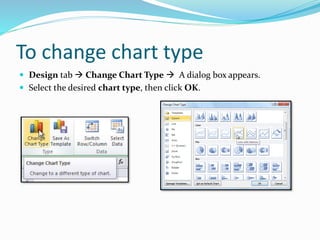
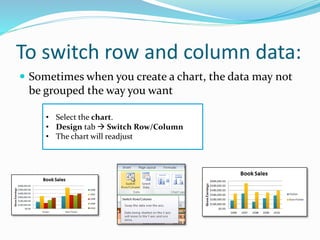

Microsoft Excel allows users to create charts to visualize data. Charts make it easier to see trends, comparisons, and outliers in data. A chart contains a title, axes, data series, and legend. To create a chart, select the data range and insert a chart type. Chart tools allow modification of the type, layout, style, and location of the chart. Charts are a useful tool for communicating insights from data in Excel workbooks.