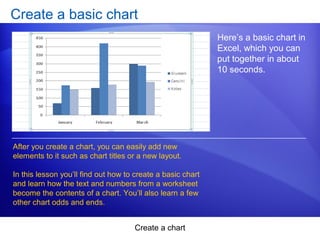
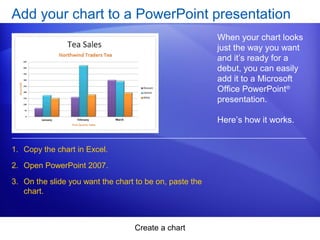
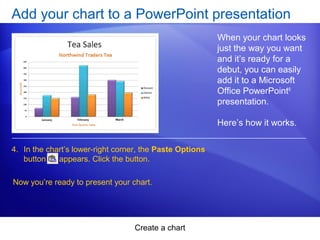
This document provides an overview and instructions for creating and customizing charts in Microsoft Excel 2007. It covers how to create a basic column chart from worksheet data in about 10 seconds. It also discusses how to customize charts by changing the chart type and view, adding titles, applying styles and formatting to change colors and effects, and formatting individual chart elements. Finally, it describes how to add a completed Excel chart to a PowerPoint presentation by copying and pasting it between the applications.