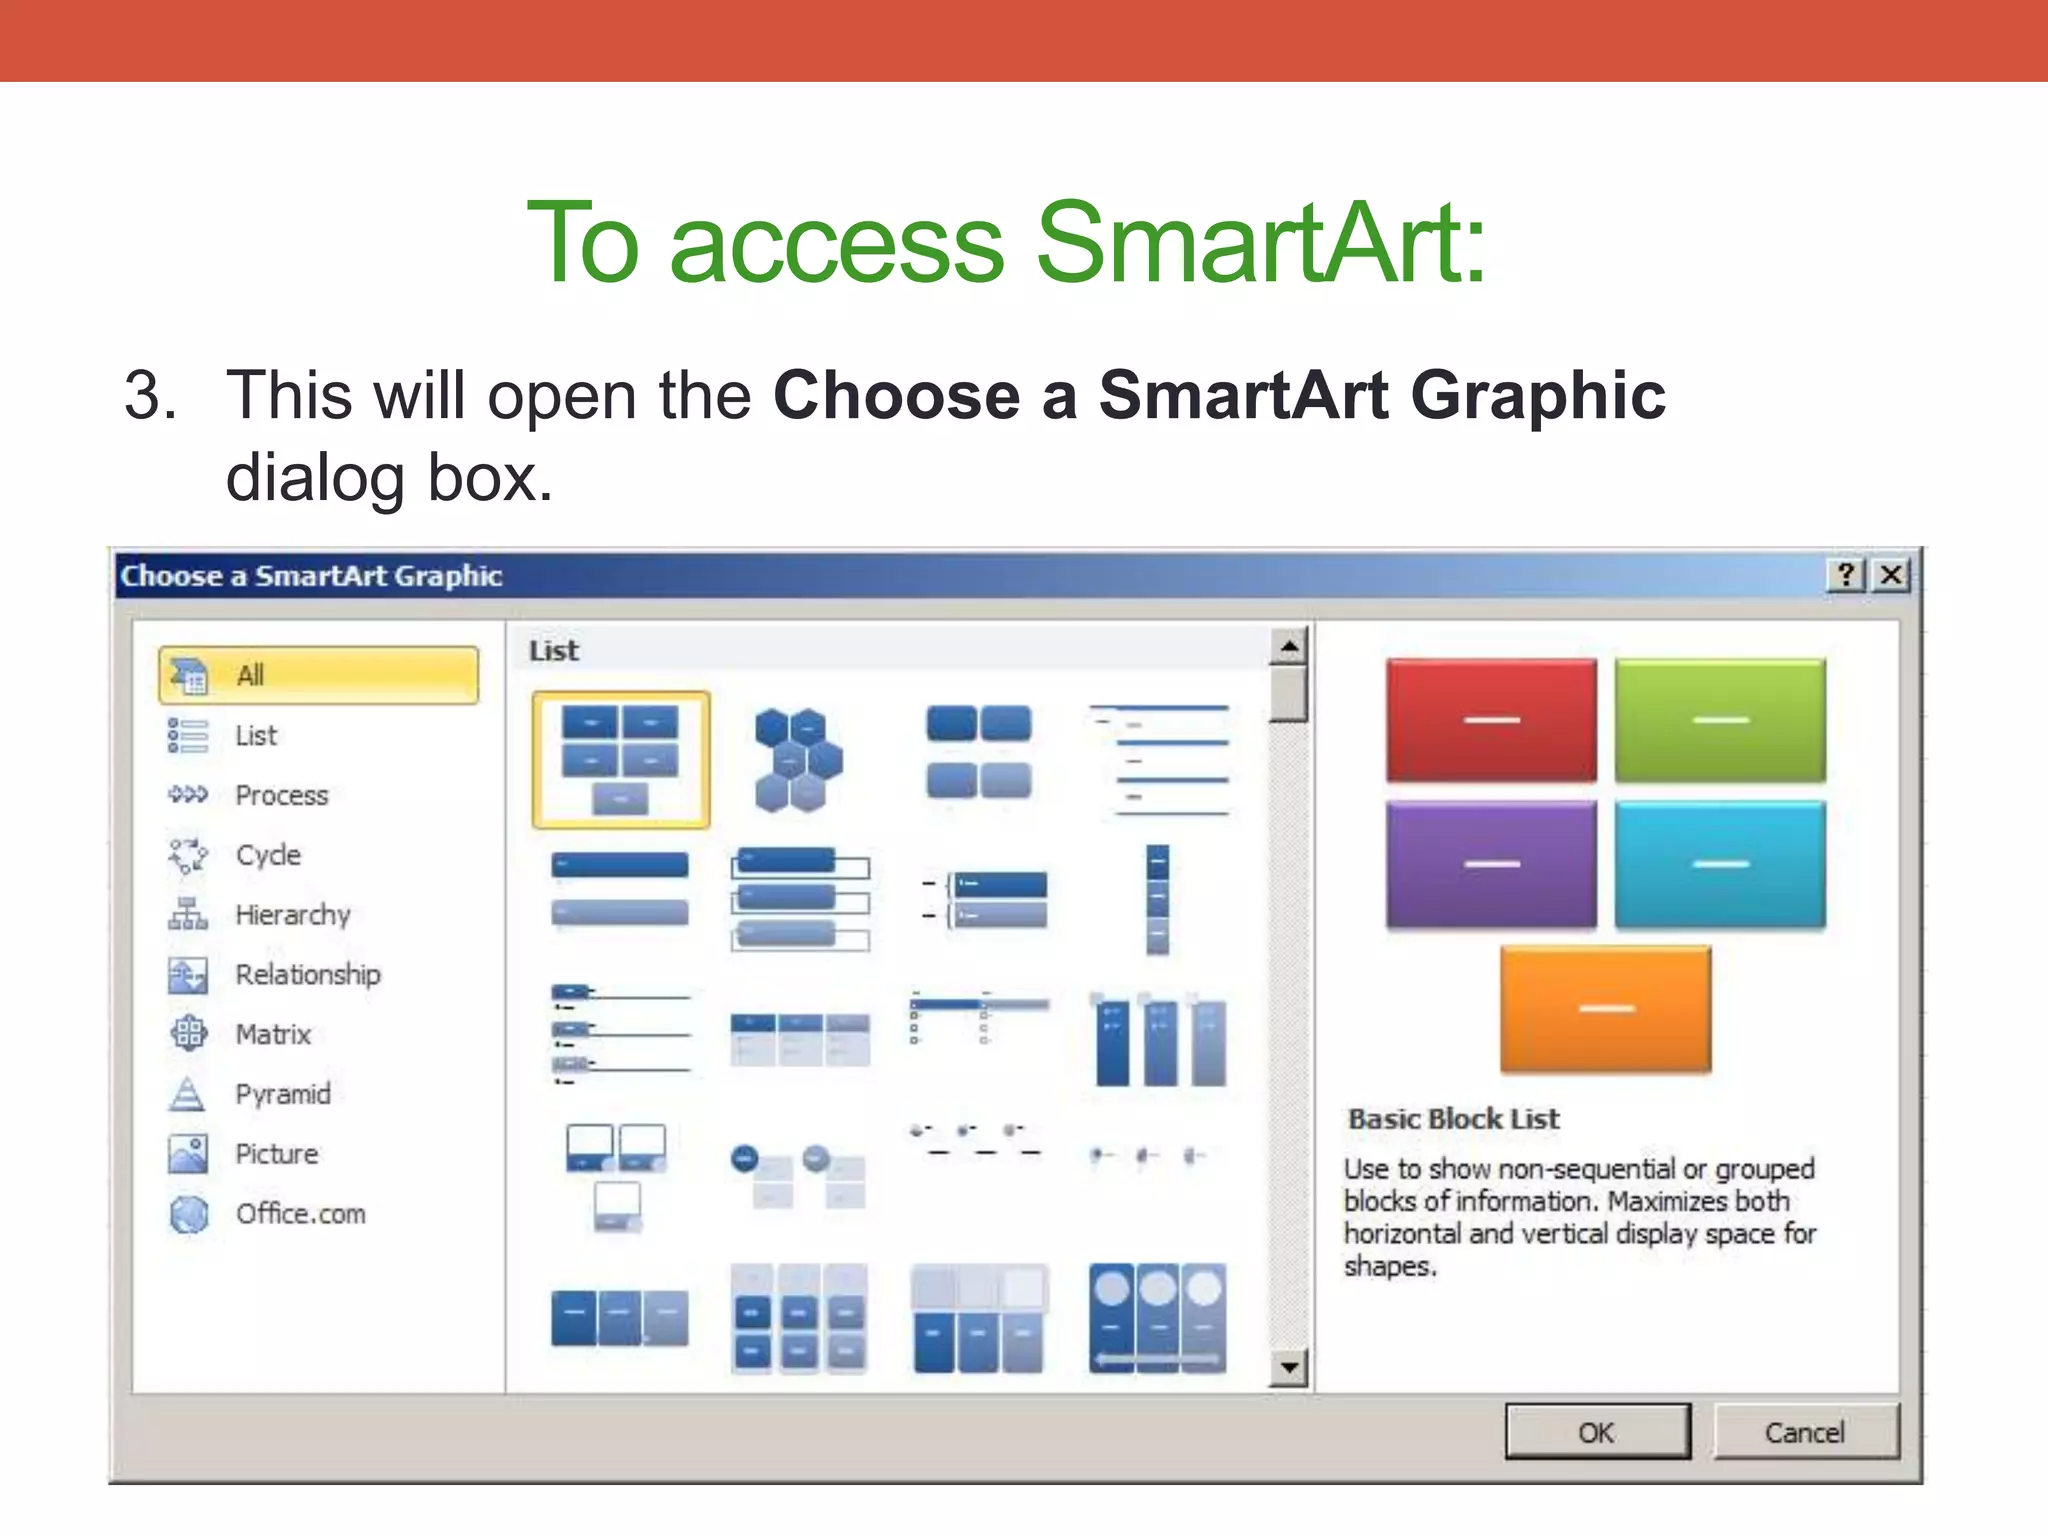
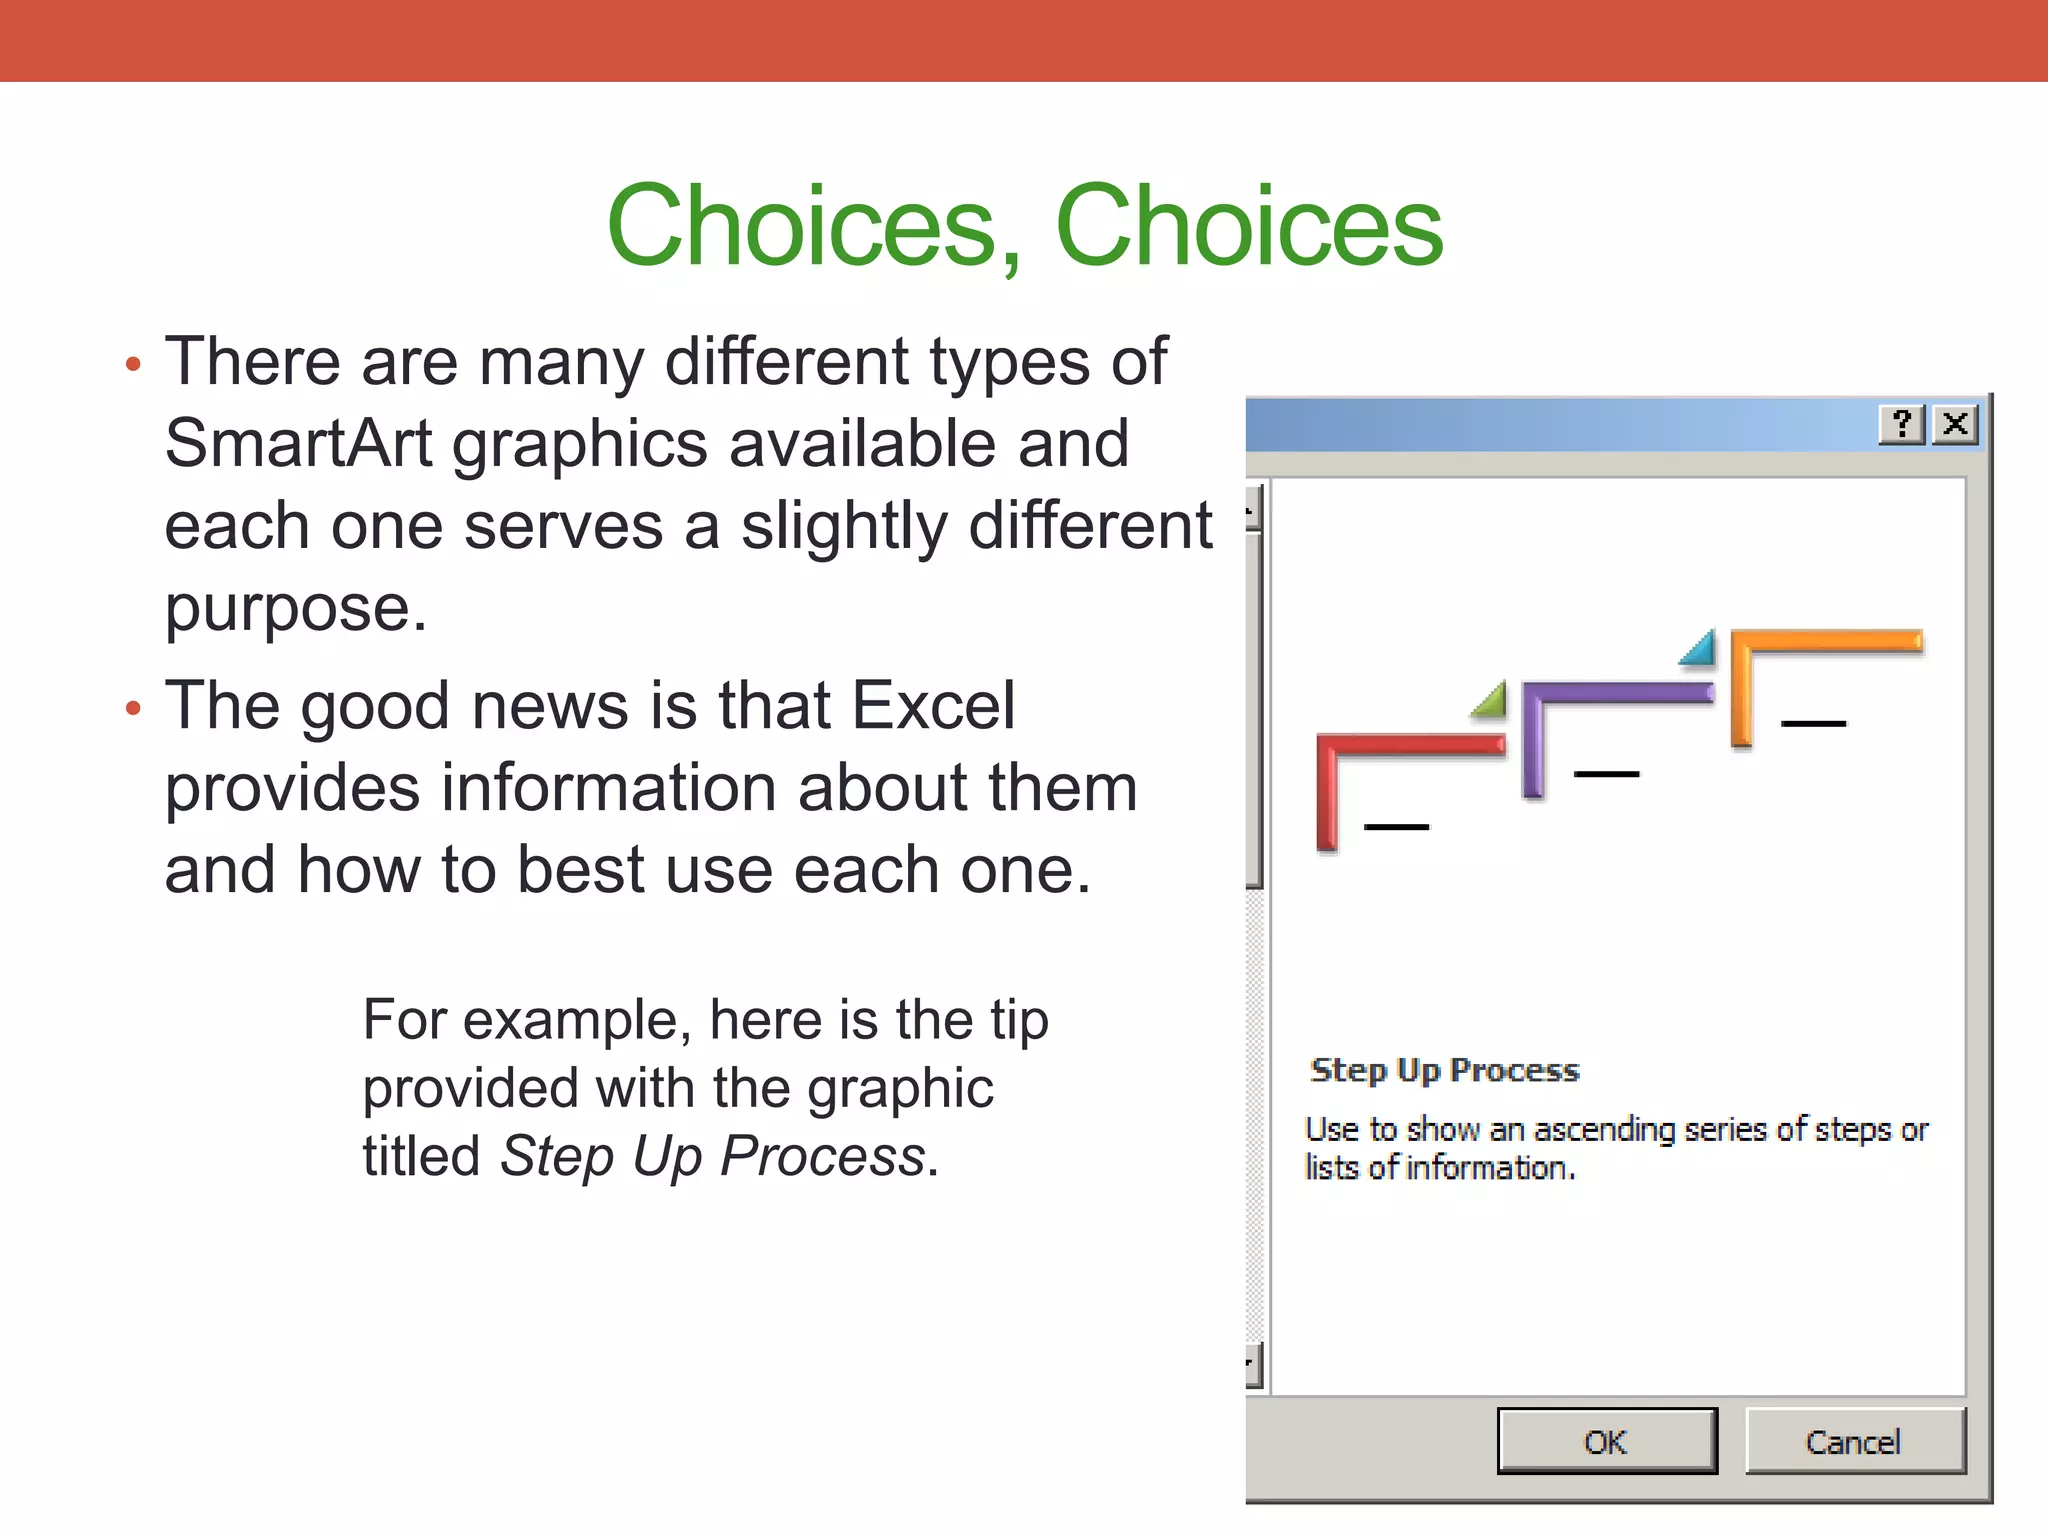
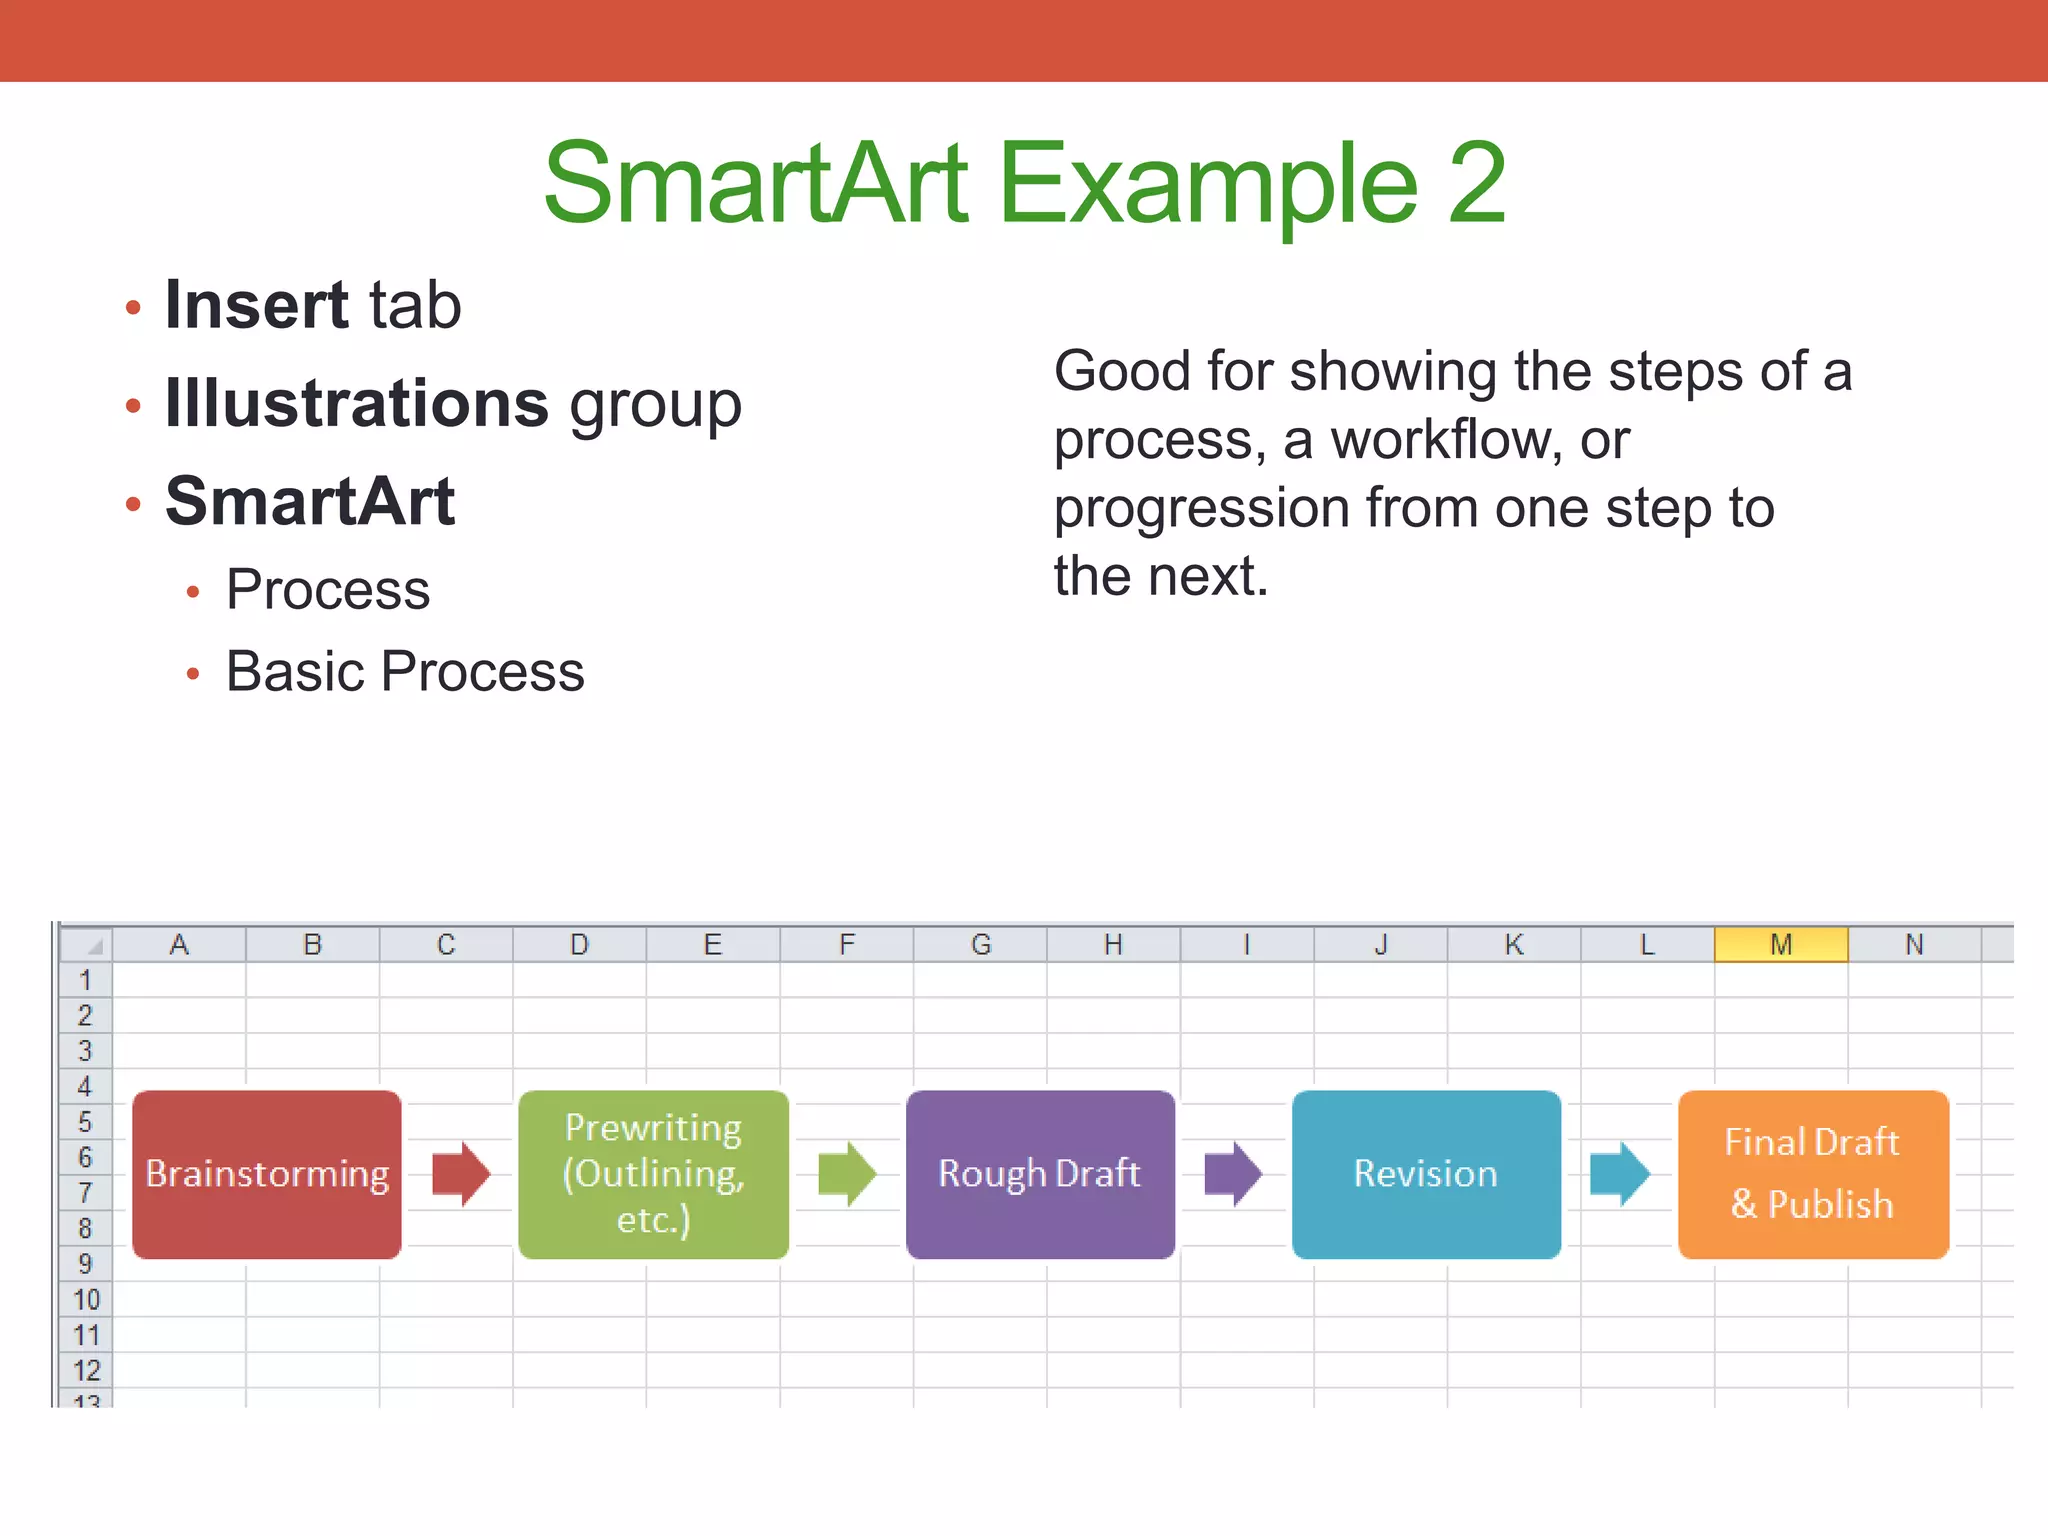
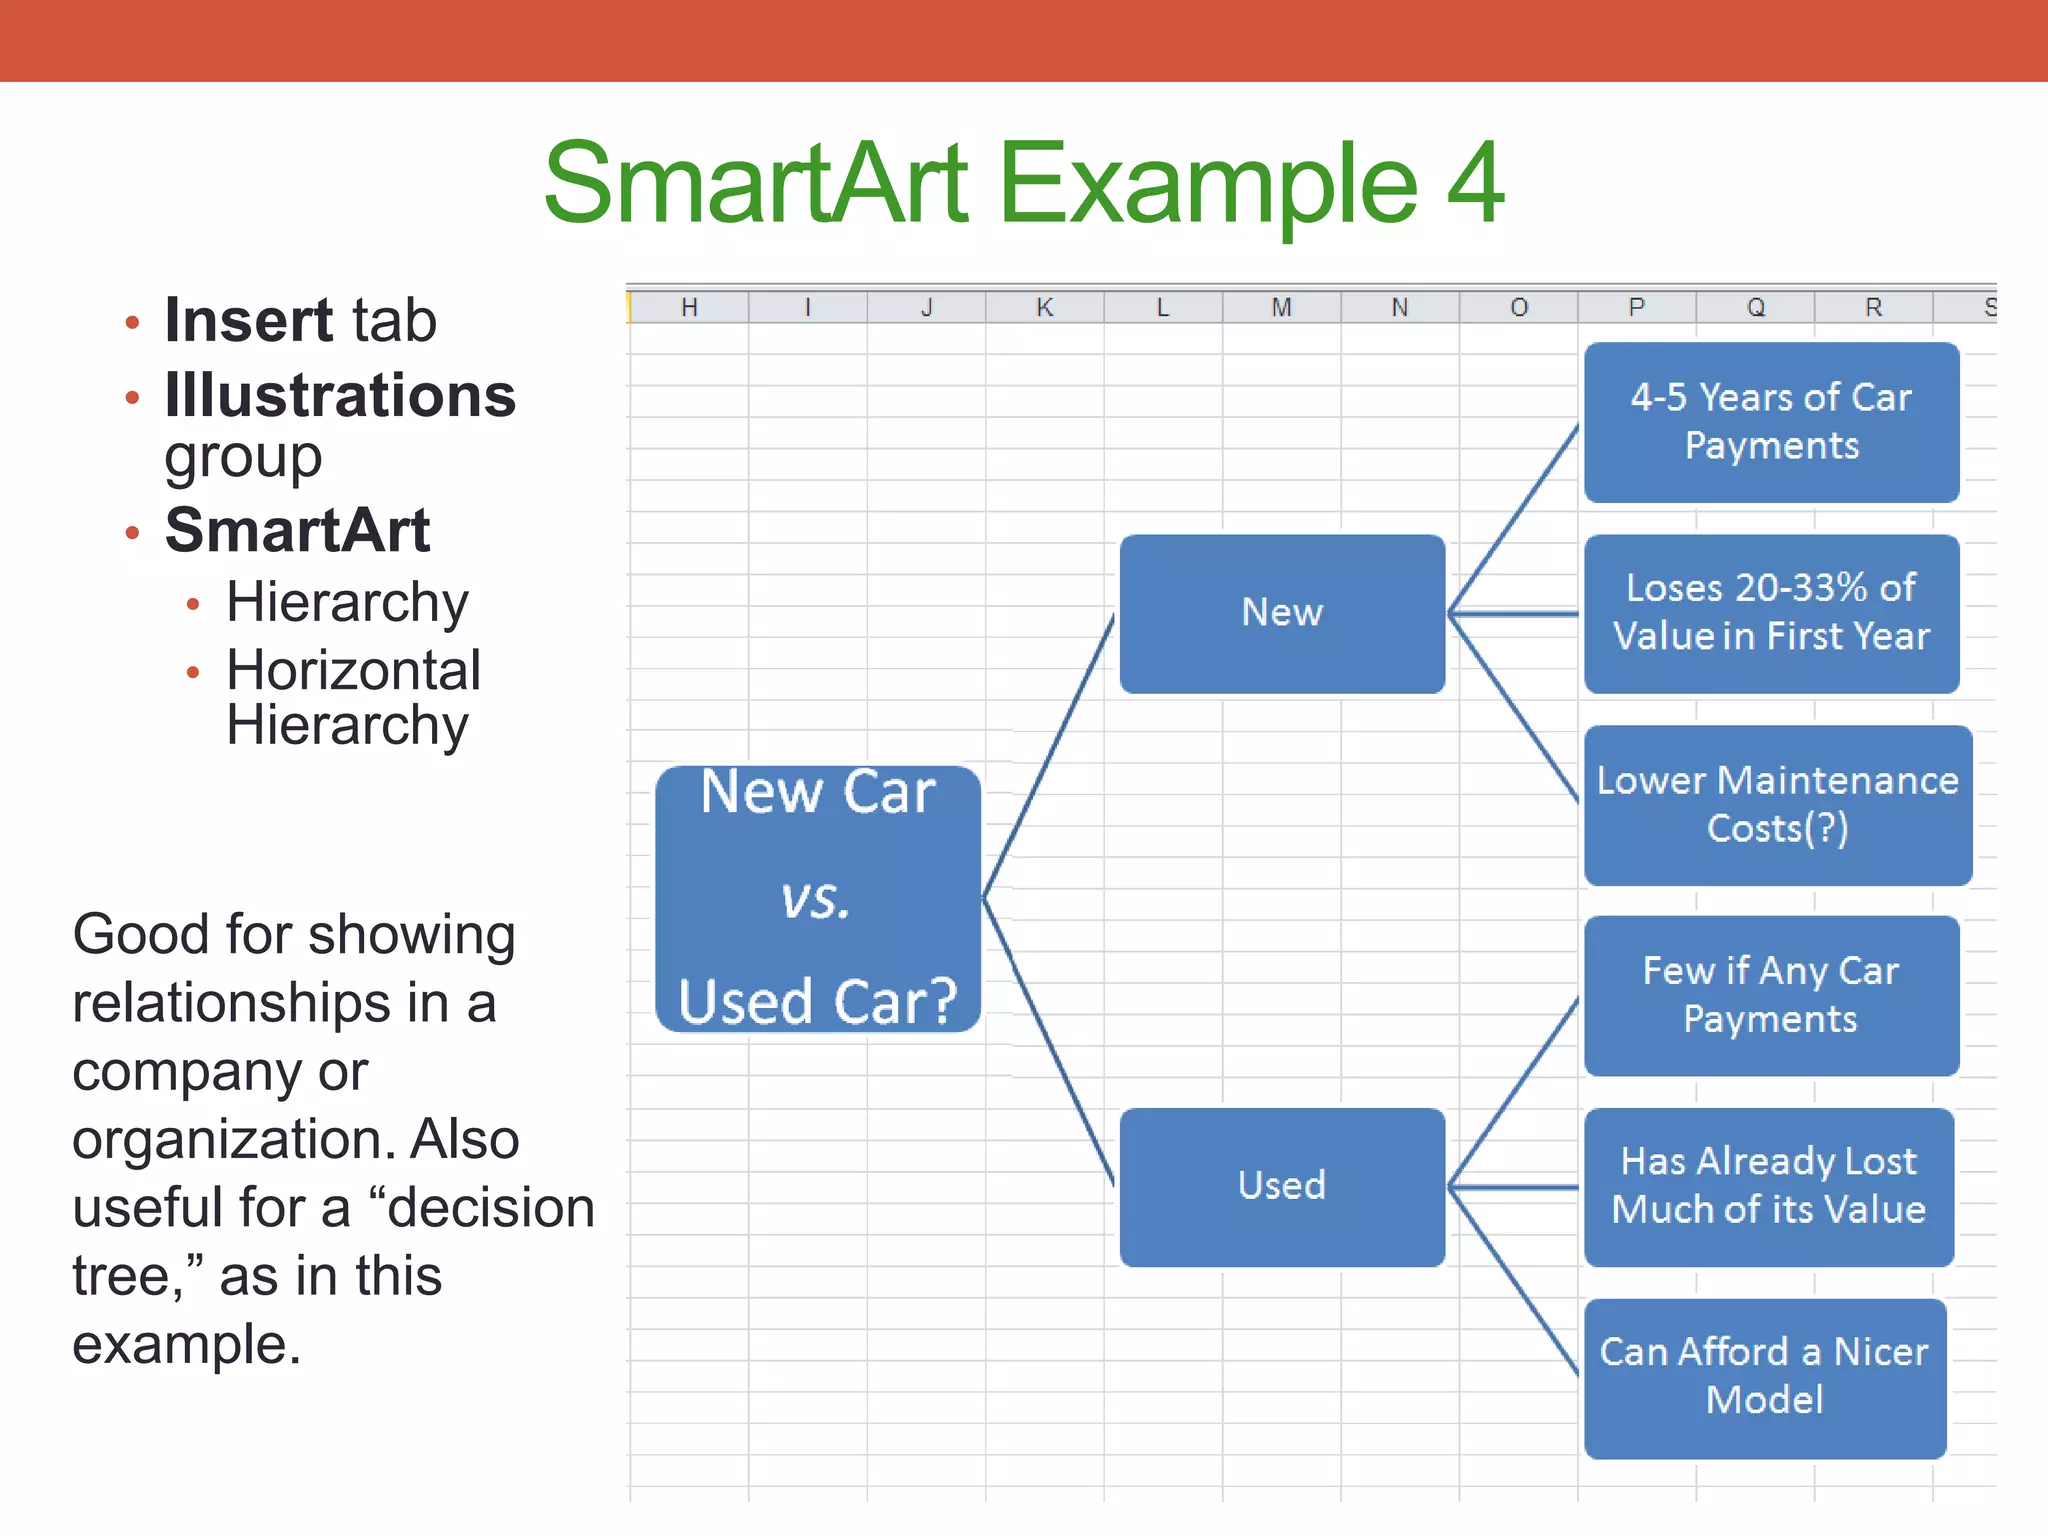
USING SMARTART
 IN EXCEL 2010
About SmartArt:
• SmartArt is available in other Microsoft Office
    applications, not just in Excel.

•   Remember: SmartArt graphics are designed for
    text and charts in Excel are designed for
    numbers.
    • If you need to express an idea or make a
        visual representation of
        information, SmartArt is your best tool.
    • If you need to make a visual representation
        of numbers or other numeric data, a chart is
        the tool to use.
To access SmartArt:

1. Click on the Insert tab.

2. In the Illustrations group, click on
   SmartArt.
To access SmartArt:
3. This will open the Choose a SmartArt Graphic
   dialog box.
Choices, Choices
• There are many different types of
  SmartArt graphics available and
  each one serves a slightly different
  purpose.
• The good news is that Excel
  provides information about them
  and how to best use each one.

        For example, here is the tip
        provided with the graphic
        titled Step Up Process.
SmartArt Example 1
• Insert tab
• Illustrations group
• SmartArt
  • Hierarchy
  • Organization Chart


Good for showing
relationships in a company or
organization. Answers the
questions, “Who is in charge?
Who answers to whom?”
SmartArt Example 2
• Insert tab
                        Good for showing the steps of a
• Illustrations group
                        process, a workflow, or
• SmartArt              progression from one step to
  • Process             the next.
  • Basic Process
SmartArt Example 3
• Insert tab
• Illustrations group
• SmartArt
  • Relationship
  • Radial Cluster


 Good for showing how
 ideas or data relate to a
 central idea or theme.
SmartArt Example 4
  • Insert tab
  • Illustrations
    group
  • SmartArt
    • Hierarchy
    • Horizontal
      Hierarchy


Good for showing
relationships in a
company or
organization. Also
useful for a “decision
tree,” as in this
example.

Using Smart Art in Excel 2010

  • 1.
  • 2.
    About SmartArt: • SmartArtis available in other Microsoft Office applications, not just in Excel. • Remember: SmartArt graphics are designed for text and charts in Excel are designed for numbers. • If you need to express an idea or make a visual representation of information, SmartArt is your best tool. • If you need to make a visual representation of numbers or other numeric data, a chart is the tool to use.
  • 3.
    To access SmartArt: 1.Click on the Insert tab. 2. In the Illustrations group, click on SmartArt.
  • 4.
    To access SmartArt: 3.This will open the Choose a SmartArt Graphic dialog box.
  • 5.
    Choices, Choices • Thereare many different types of SmartArt graphics available and each one serves a slightly different purpose. • The good news is that Excel provides information about them and how to best use each one. For example, here is the tip provided with the graphic titled Step Up Process.
  • 6.
    SmartArt Example 1 •Insert tab • Illustrations group • SmartArt • Hierarchy • Organization Chart Good for showing relationships in a company or organization. Answers the questions, “Who is in charge? Who answers to whom?”
  • 7.
    SmartArt Example 2 •Insert tab Good for showing the steps of a • Illustrations group process, a workflow, or • SmartArt progression from one step to • Process the next. • Basic Process
  • 8.
    SmartArt Example 3 •Insert tab • Illustrations group • SmartArt • Relationship • Radial Cluster Good for showing how ideas or data relate to a central idea or theme.
  • 9.
    SmartArt Example 4 • Insert tab • Illustrations group • SmartArt • Hierarchy • Horizontal Hierarchy Good for showing relationships in a company or organization. Also useful for a “decision tree,” as in this example.