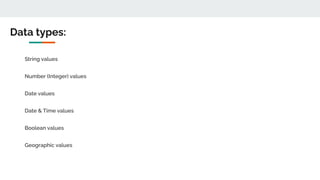
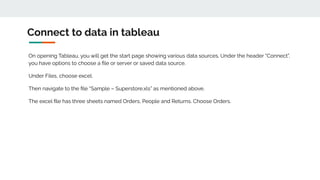
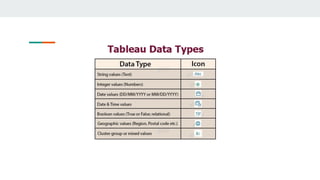
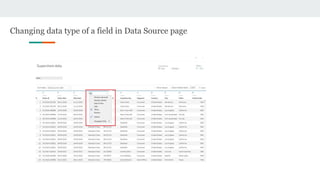
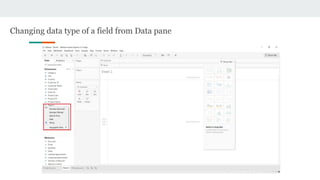
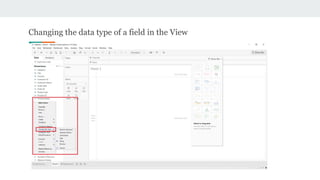
String values
Number (Integer) values
Date values
Date & Time values
Boolean values
Geographic values
Data types:
Connect to data in tableau
On opening Tableau, you will get the start page showing various data sources. Under the header “Connect”,
you have options to choose a file or server or saved data source.
Under Files, choose excel.
Then navigate to the file “Sample – Superstore.xls” as mentioned above.
The excel file has three sheets named Orders, People and Returns. Choose Orders.
Changing data type of a field in Data Source page
Changing data type of a field from Data pane
Changing the data type of a field in the View
Dimensions and Measures, Blue and Green
● Dimensions contain qualitative values (such as names, dates, or geographical data). You can use
dimensions to categorize, segment, and reveal the details in your data. Dimensions affect the level of
detail in the view.
● Measures contain numeric, quantitative values that you can measure. Measures can be aggregated.
When you drag a measure into the view, Tableau applies an aggregation to that measure (by
default).
Assignment 1 - Superstore Sales Dashboard
Due Date - 27 September 2021
Objective:
To identify the number of customers, in the province region .
To analyse the number of sales, product-wise Identify the number of packages by various ship-mode
and priority province-wise.
To Analyse the various modes of transport used in the superstore.
The display the priority of the order including customers Name by Order ID for taking the further
action.
Derive one meaningful insight on your own.
● data.world
● Data is Plural
● UN Data
● Data.gov
● Kaggle
● NOAA
● Reddit
● World Fact Book
● UN Environmental Data Explorer
● World Health Organization
● Pitney Bowes
Portals For Data:
Data visualization   data sources   data types

Data visualization data sources data types

  • 2.
    String values Number (Integer)values Date values Date & Time values Boolean values Geographic values Data types:
  • 3.
    Connect to datain tableau On opening Tableau, you will get the start page showing various data sources. Under the header “Connect”, you have options to choose a file or server or saved data source. Under Files, choose excel. Then navigate to the file “Sample – Superstore.xls” as mentioned above. The excel file has three sheets named Orders, People and Returns. Choose Orders.
  • 5.
    Changing data typeof a field in Data Source page
  • 6.
    Changing data typeof a field from Data pane
  • 7.
    Changing the datatype of a field in the View
  • 8.
    Dimensions and Measures,Blue and Green ● Dimensions contain qualitative values (such as names, dates, or geographical data). You can use dimensions to categorize, segment, and reveal the details in your data. Dimensions affect the level of detail in the view. ● Measures contain numeric, quantitative values that you can measure. Measures can be aggregated. When you drag a measure into the view, Tableau applies an aggregation to that measure (by default).
  • 9.
    Assignment 1 -Superstore Sales Dashboard Due Date - 27 September 2021 Objective: To identify the number of customers, in the province region . To analyse the number of sales, product-wise Identify the number of packages by various ship-mode and priority province-wise. To Analyse the various modes of transport used in the superstore. The display the priority of the order including customers Name by Order ID for taking the further action. Derive one meaningful insight on your own.
  • 10.
    ● data.world ● Datais Plural ● UN Data ● Data.gov ● Kaggle ● NOAA ● Reddit ● World Fact Book ● UN Environmental Data Explorer ● World Health Organization ● Pitney Bowes Portals For Data: