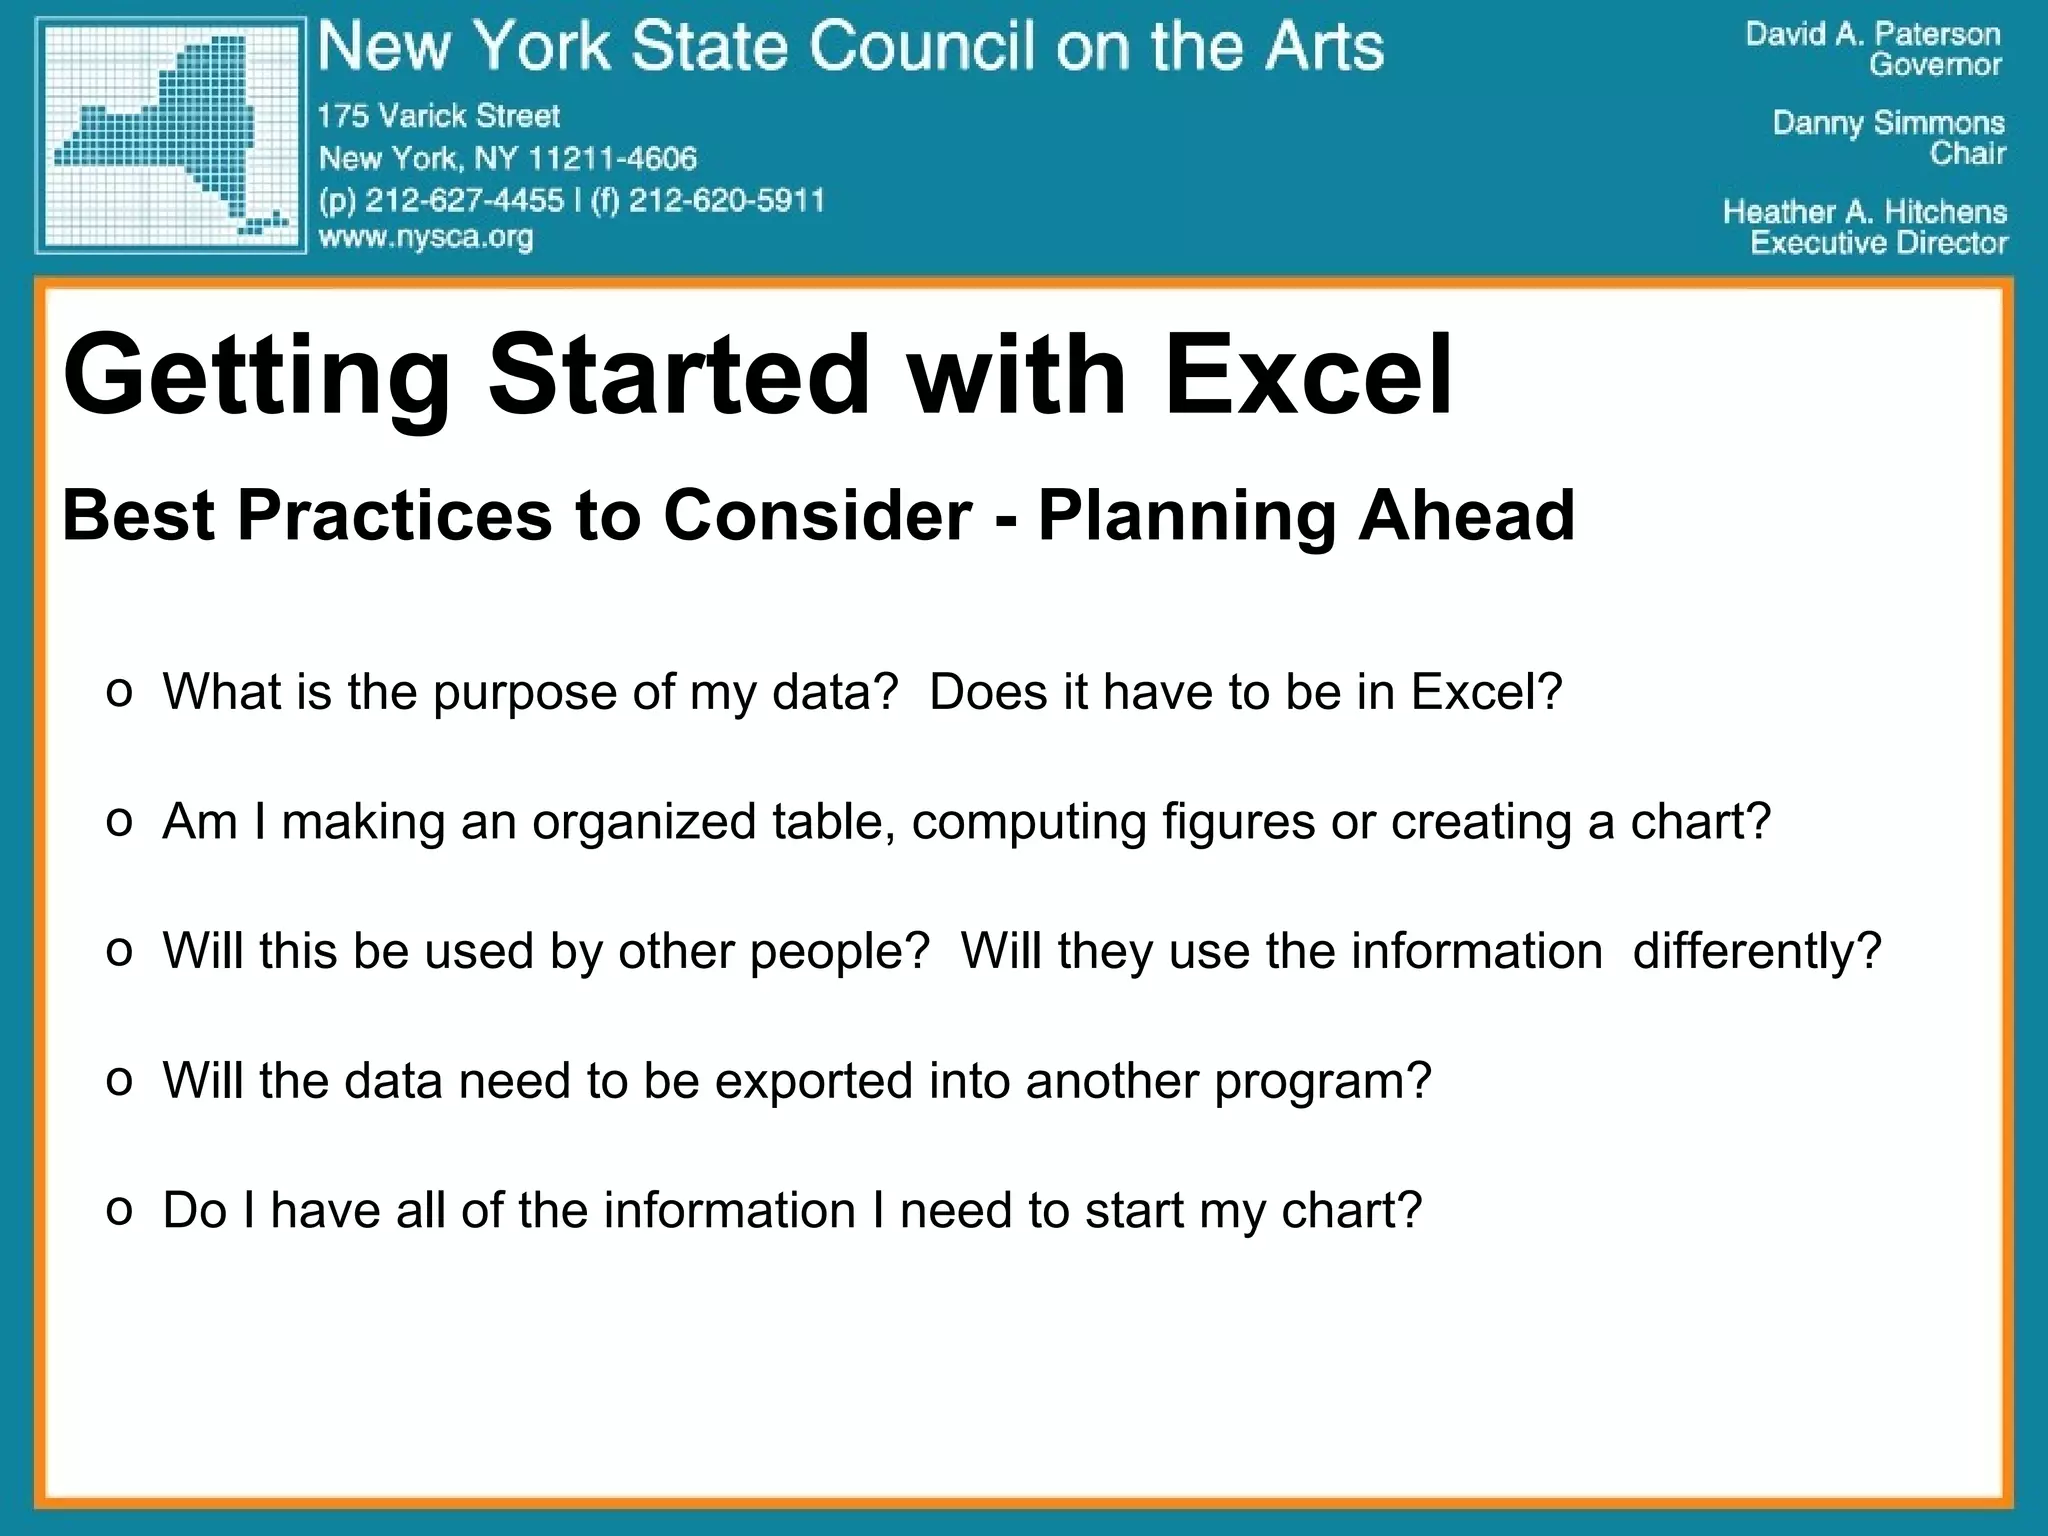
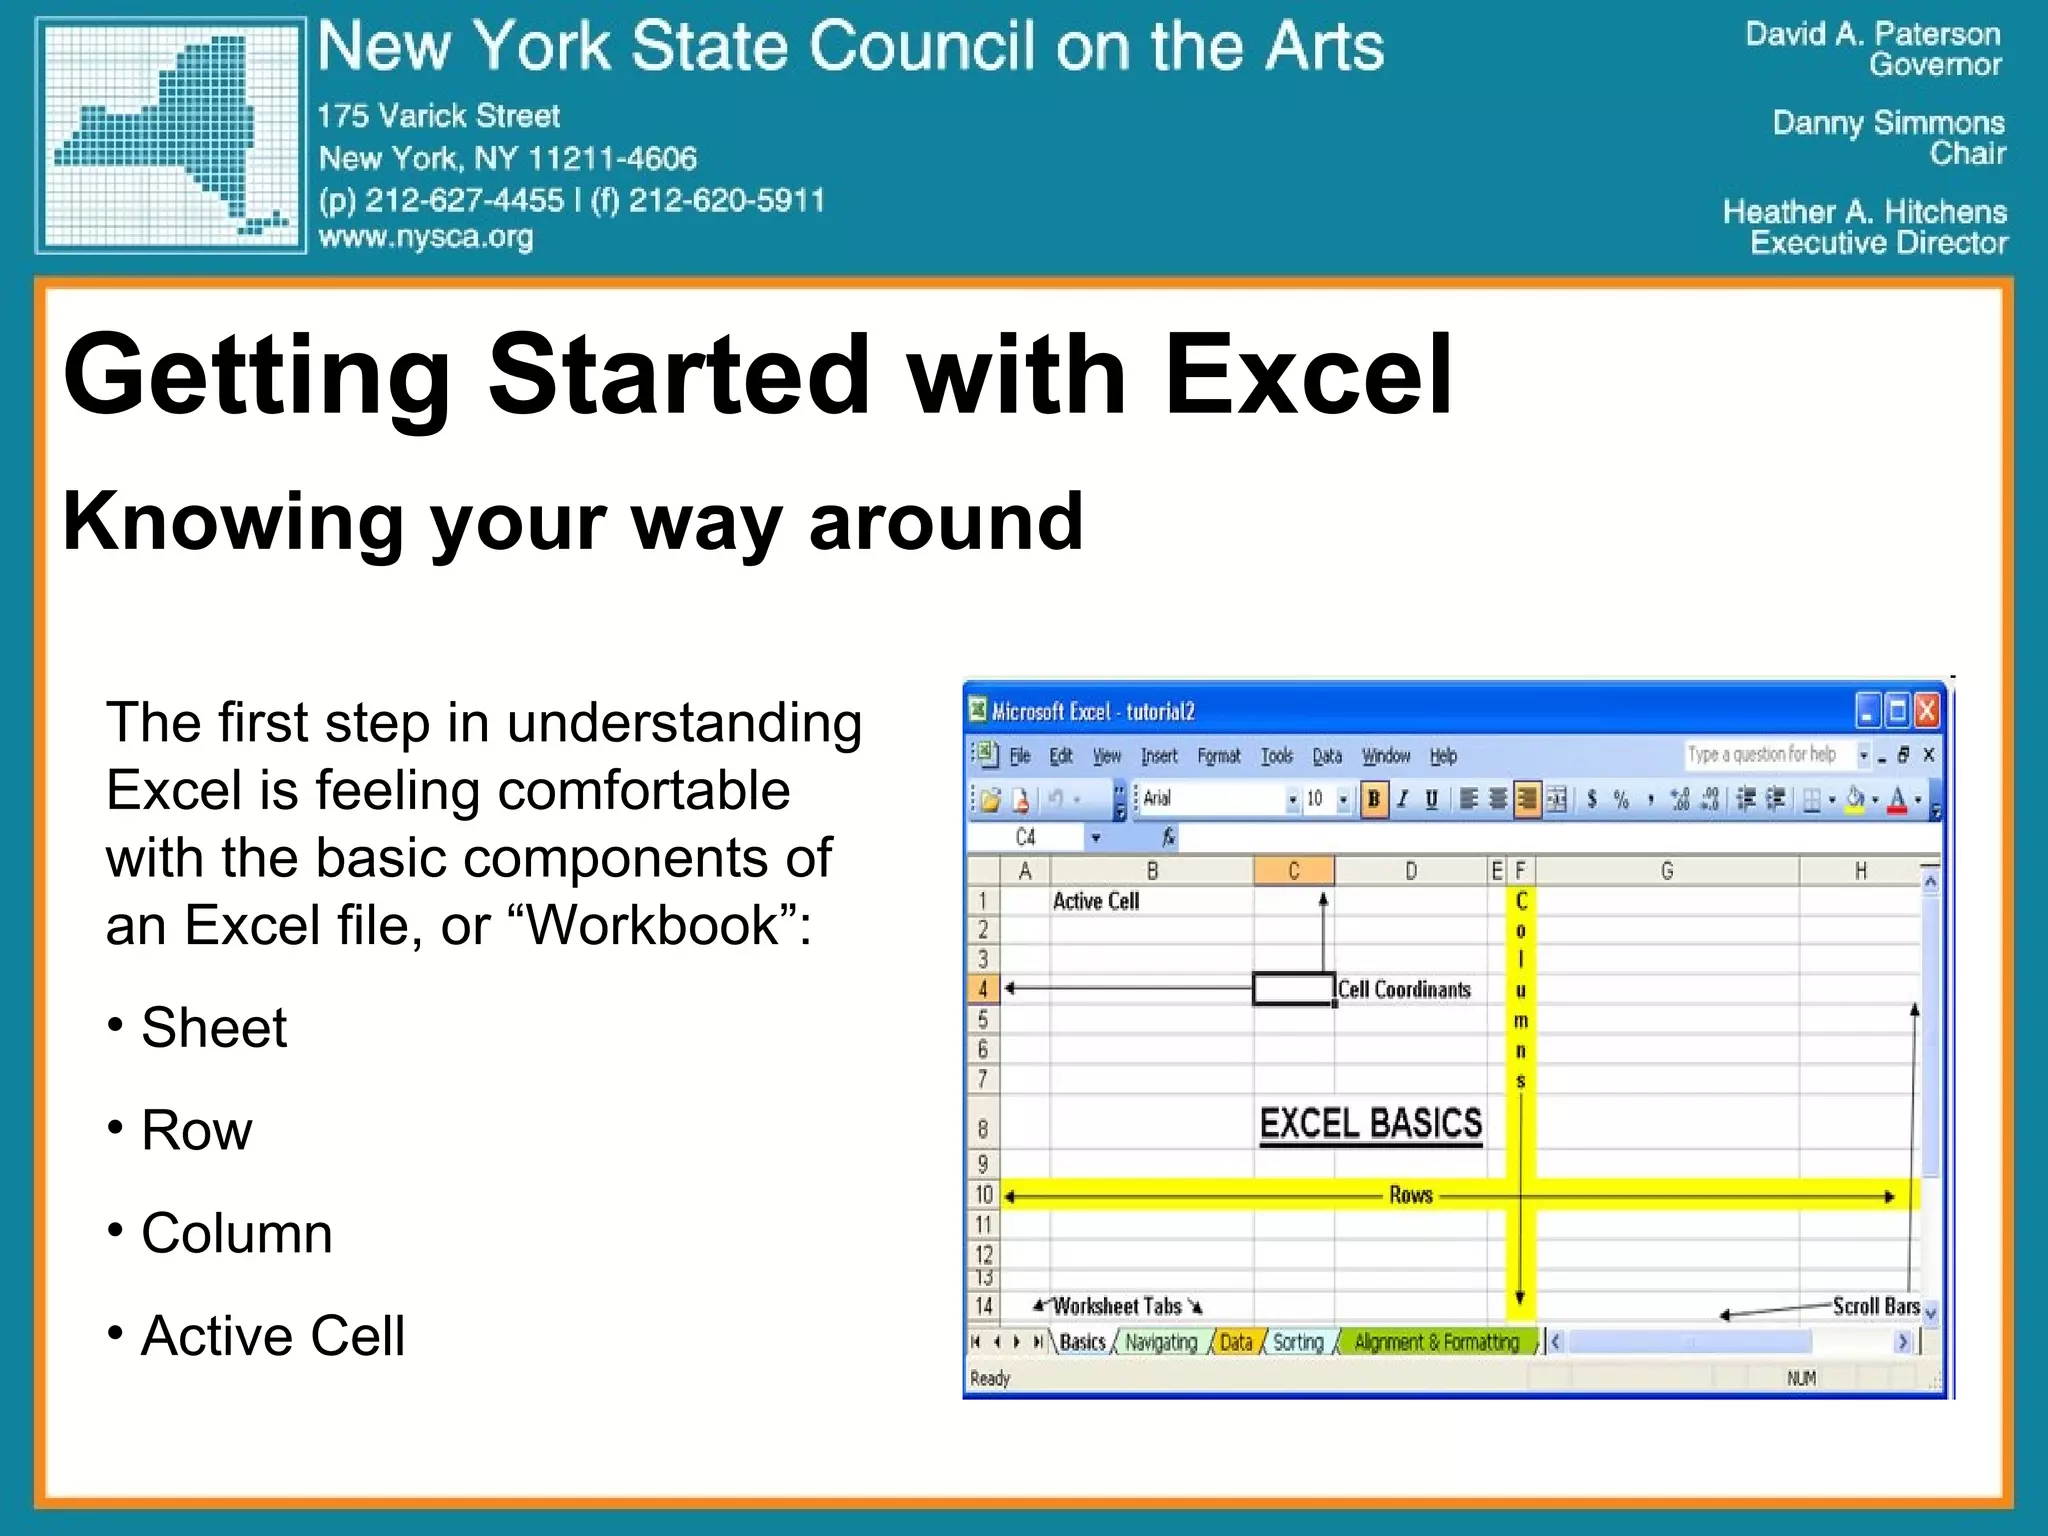
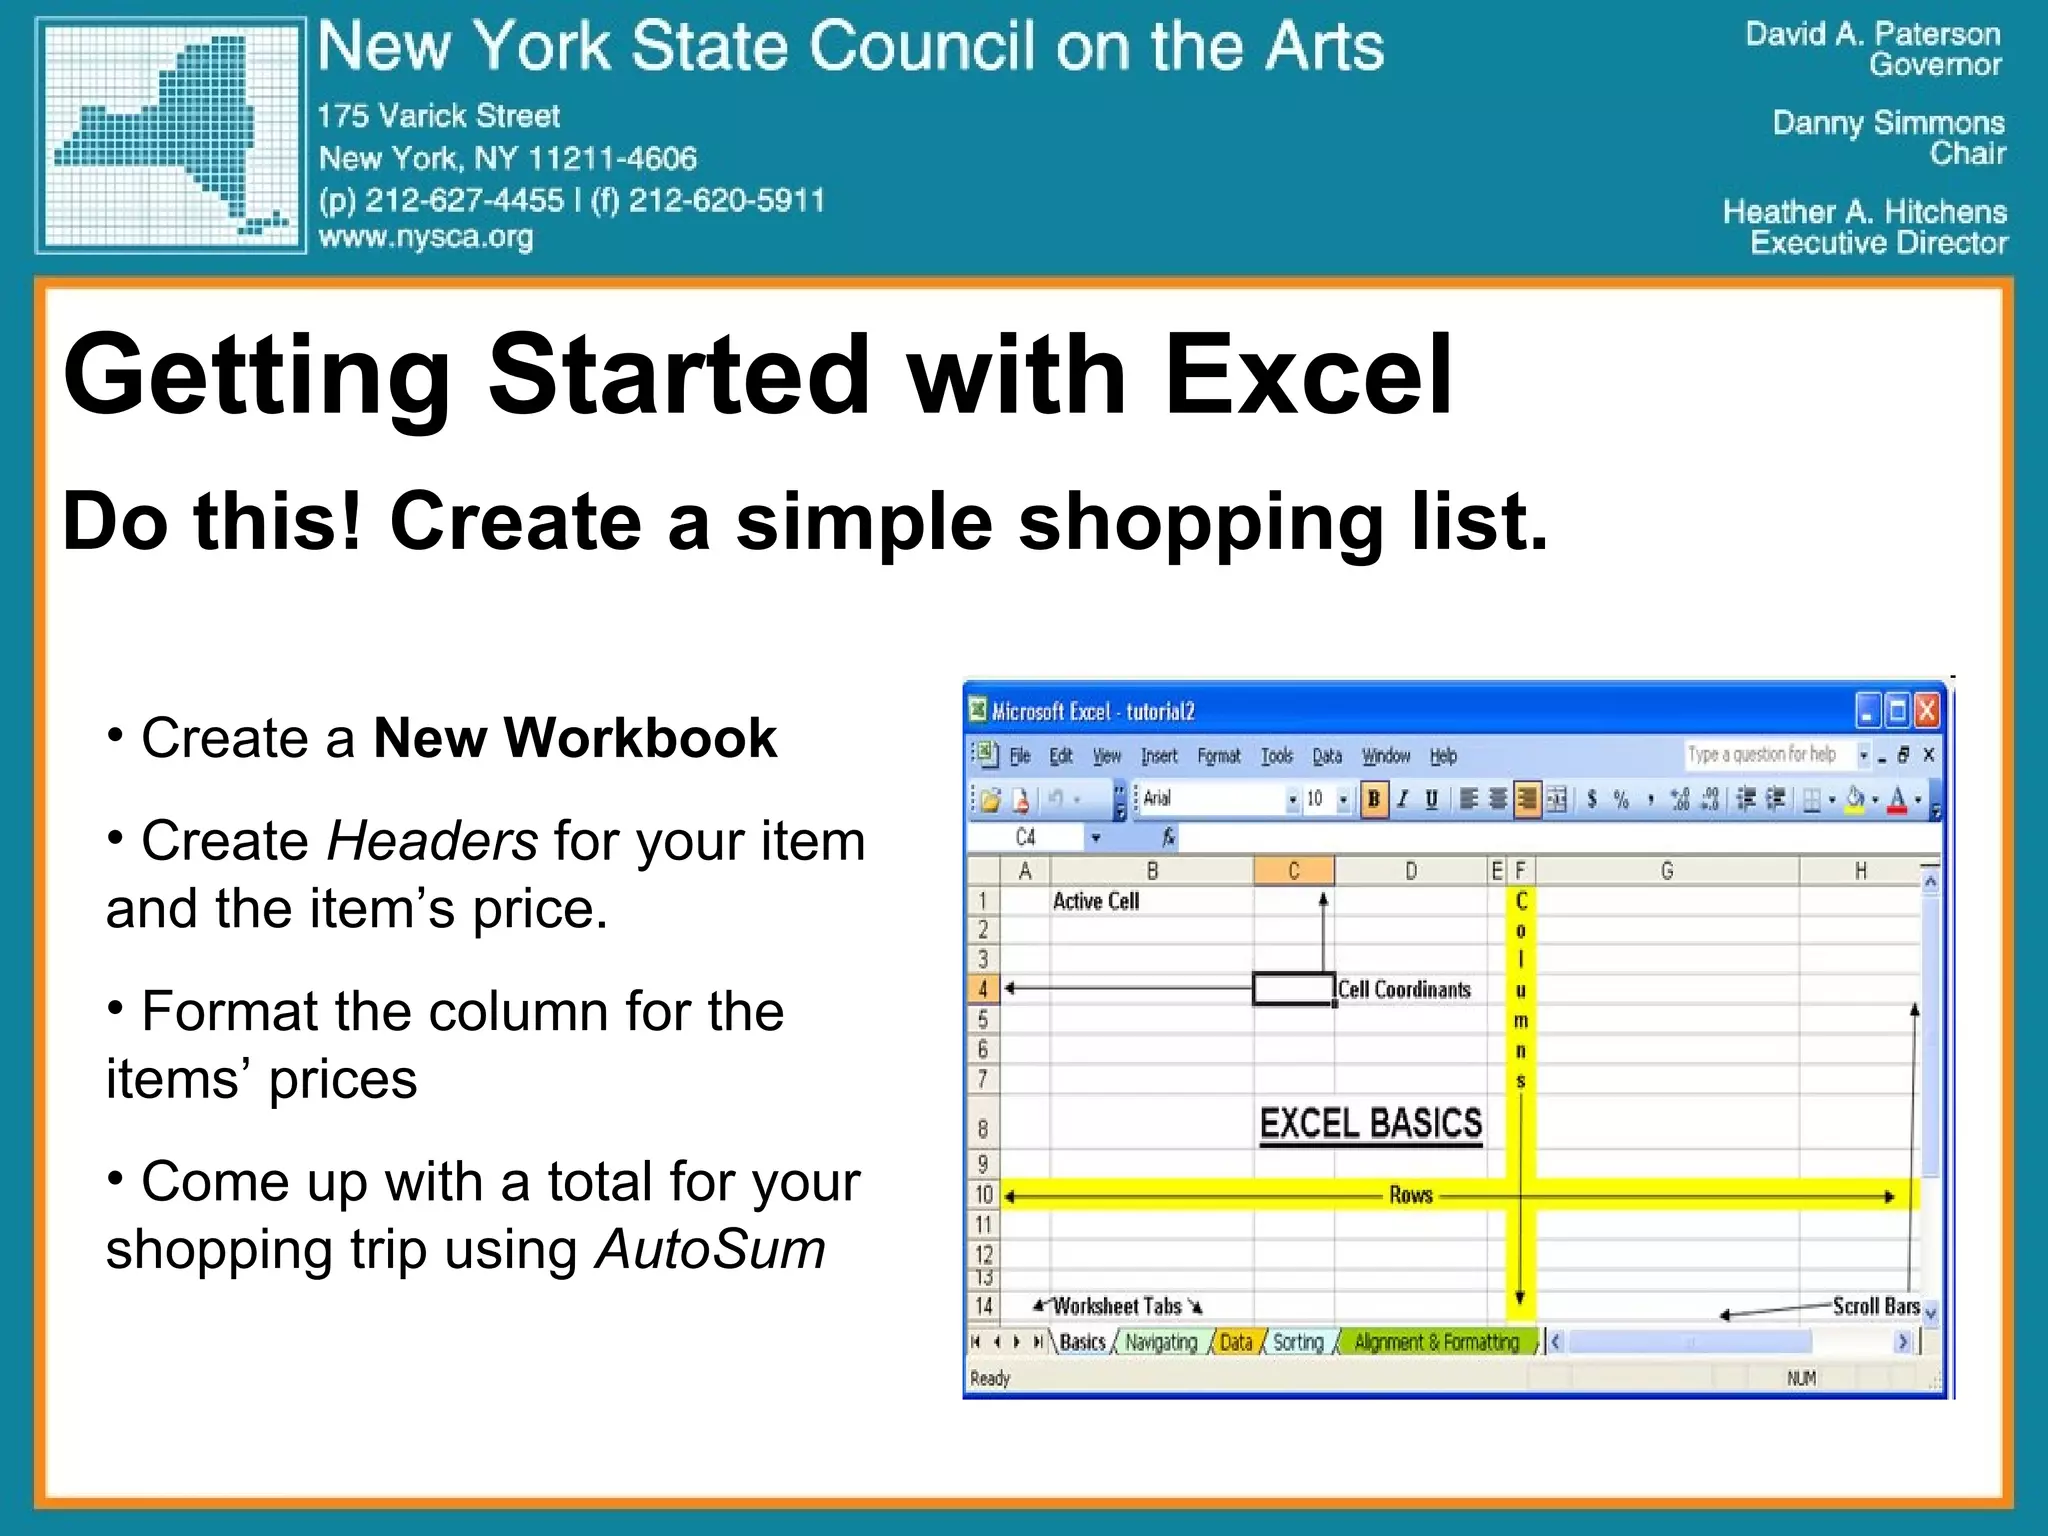
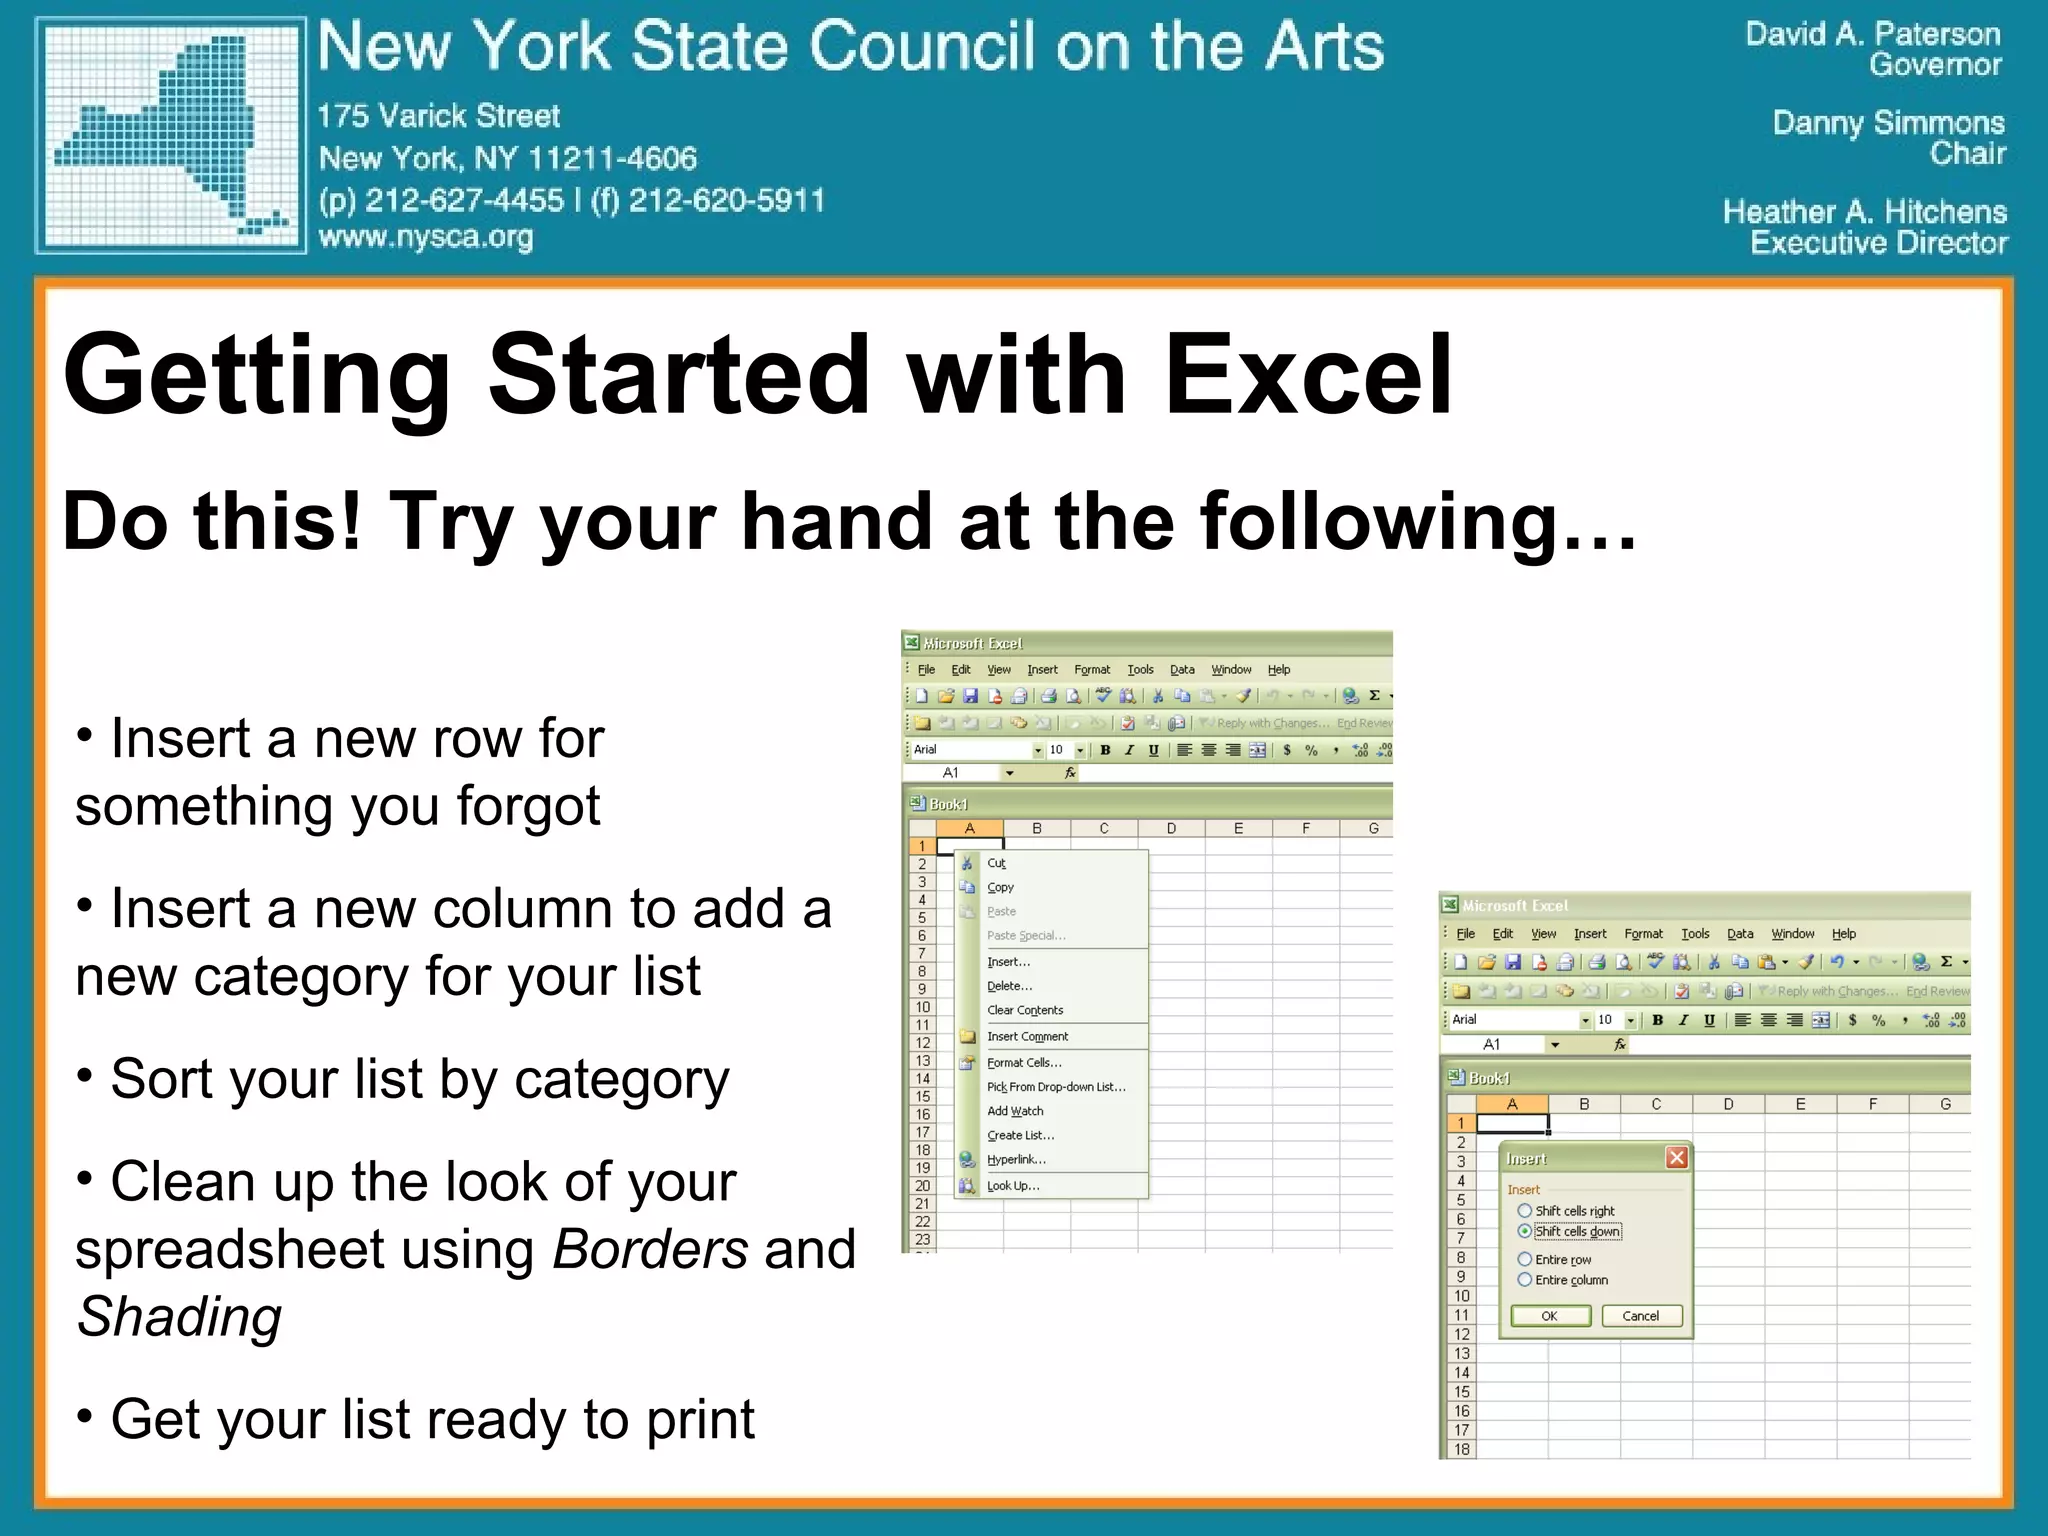
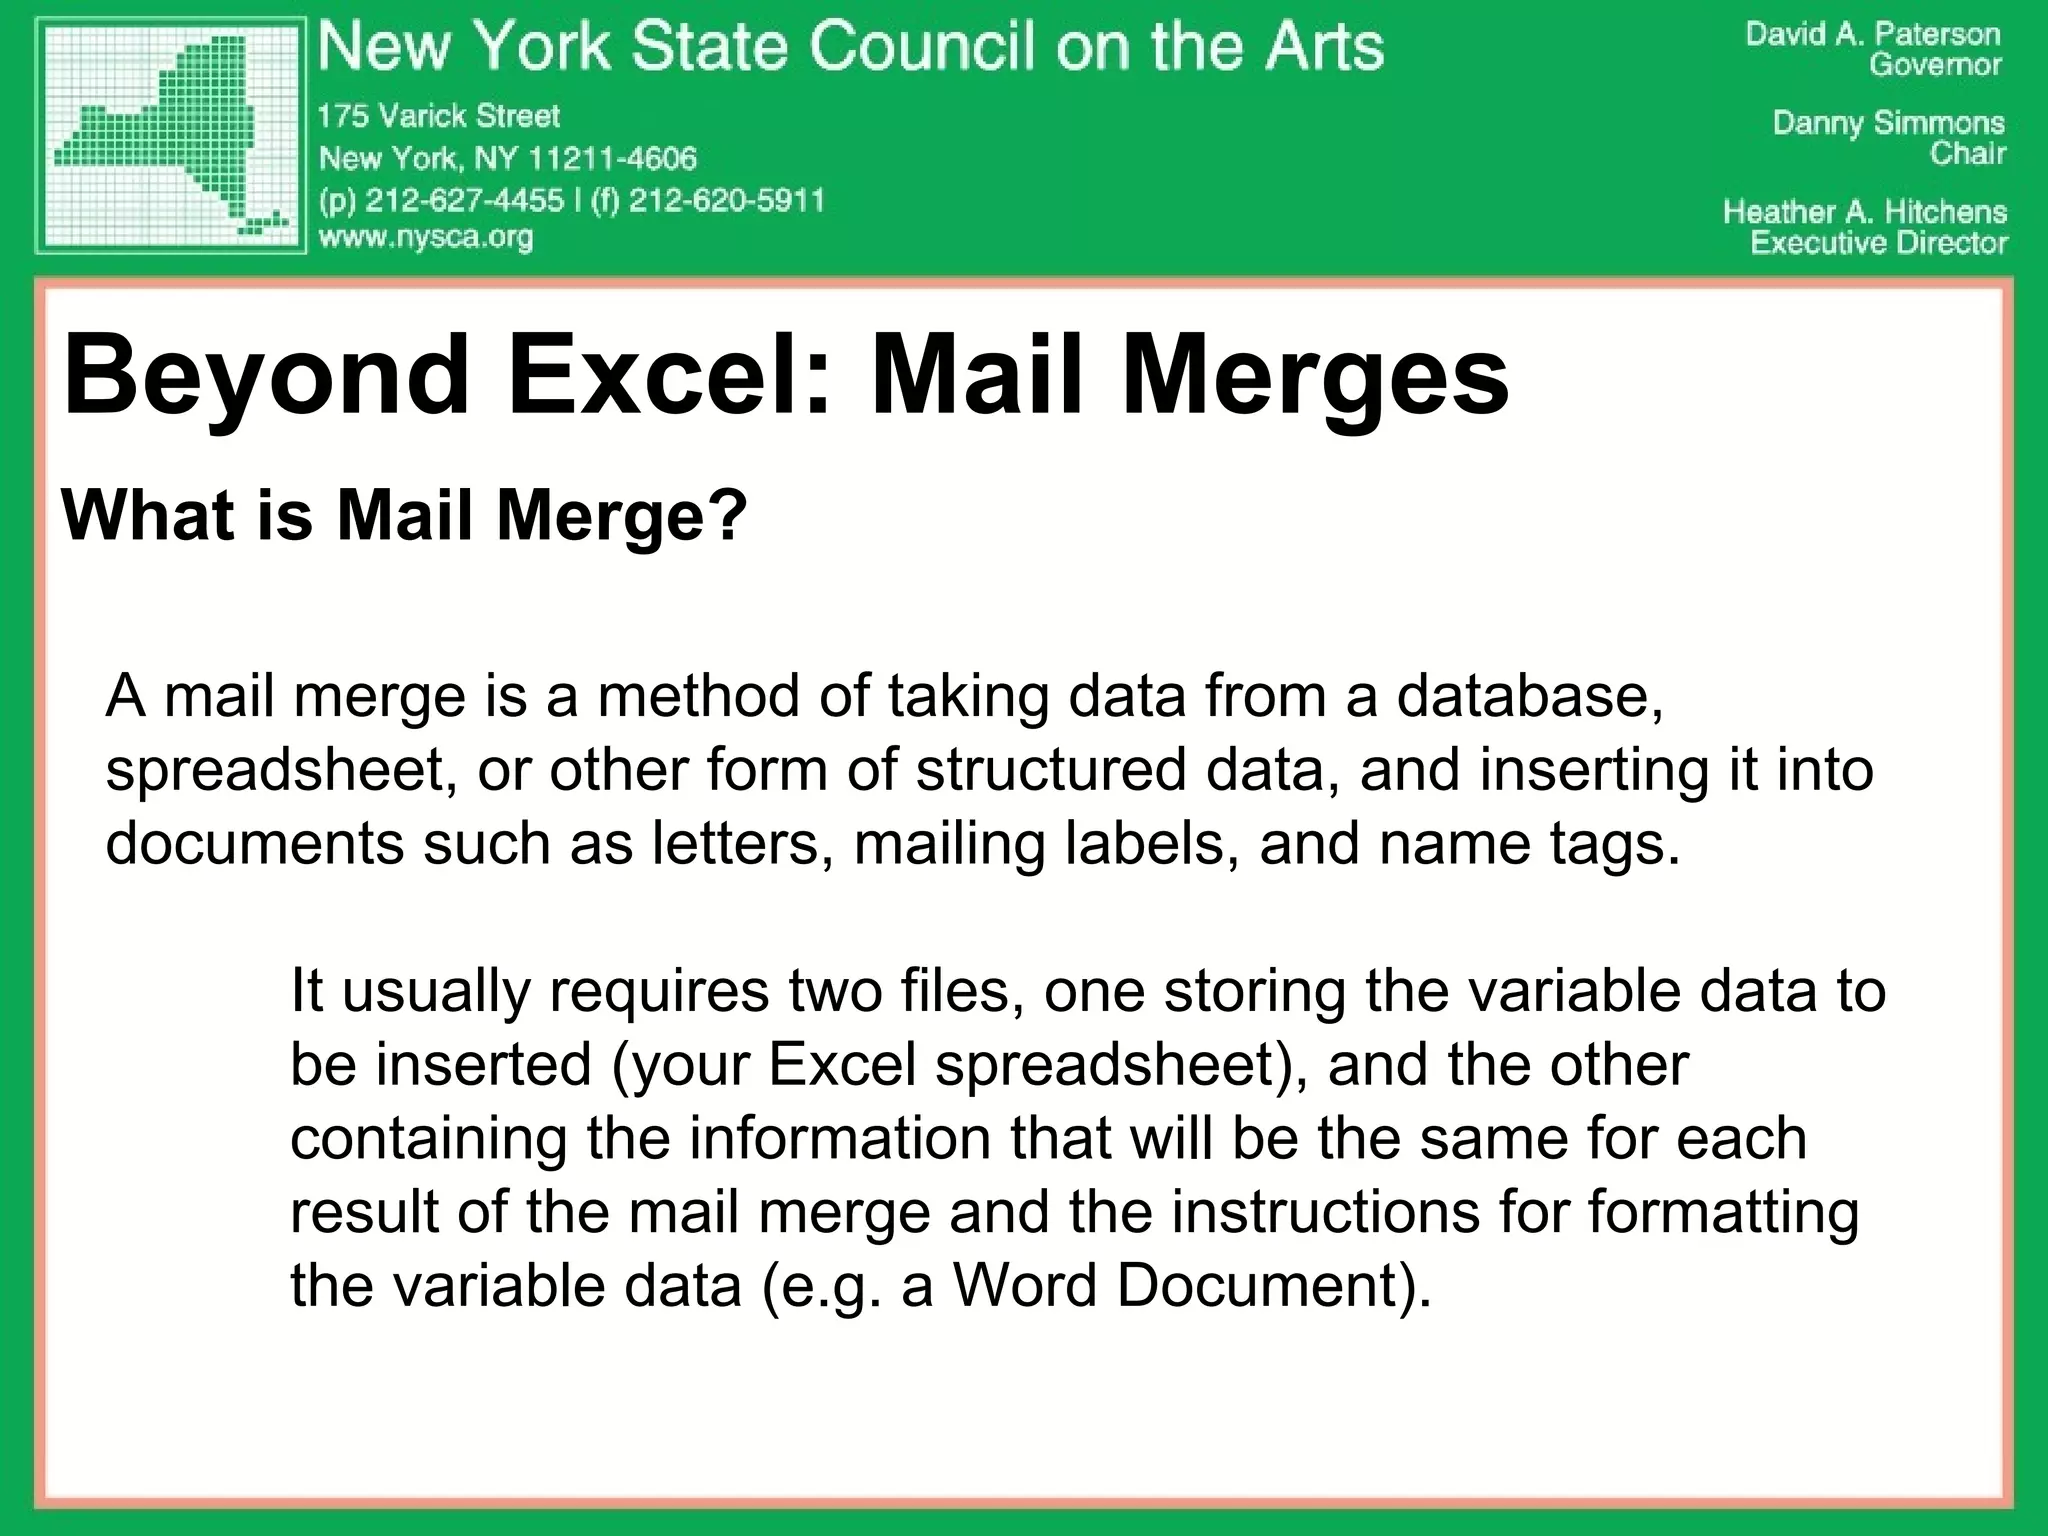
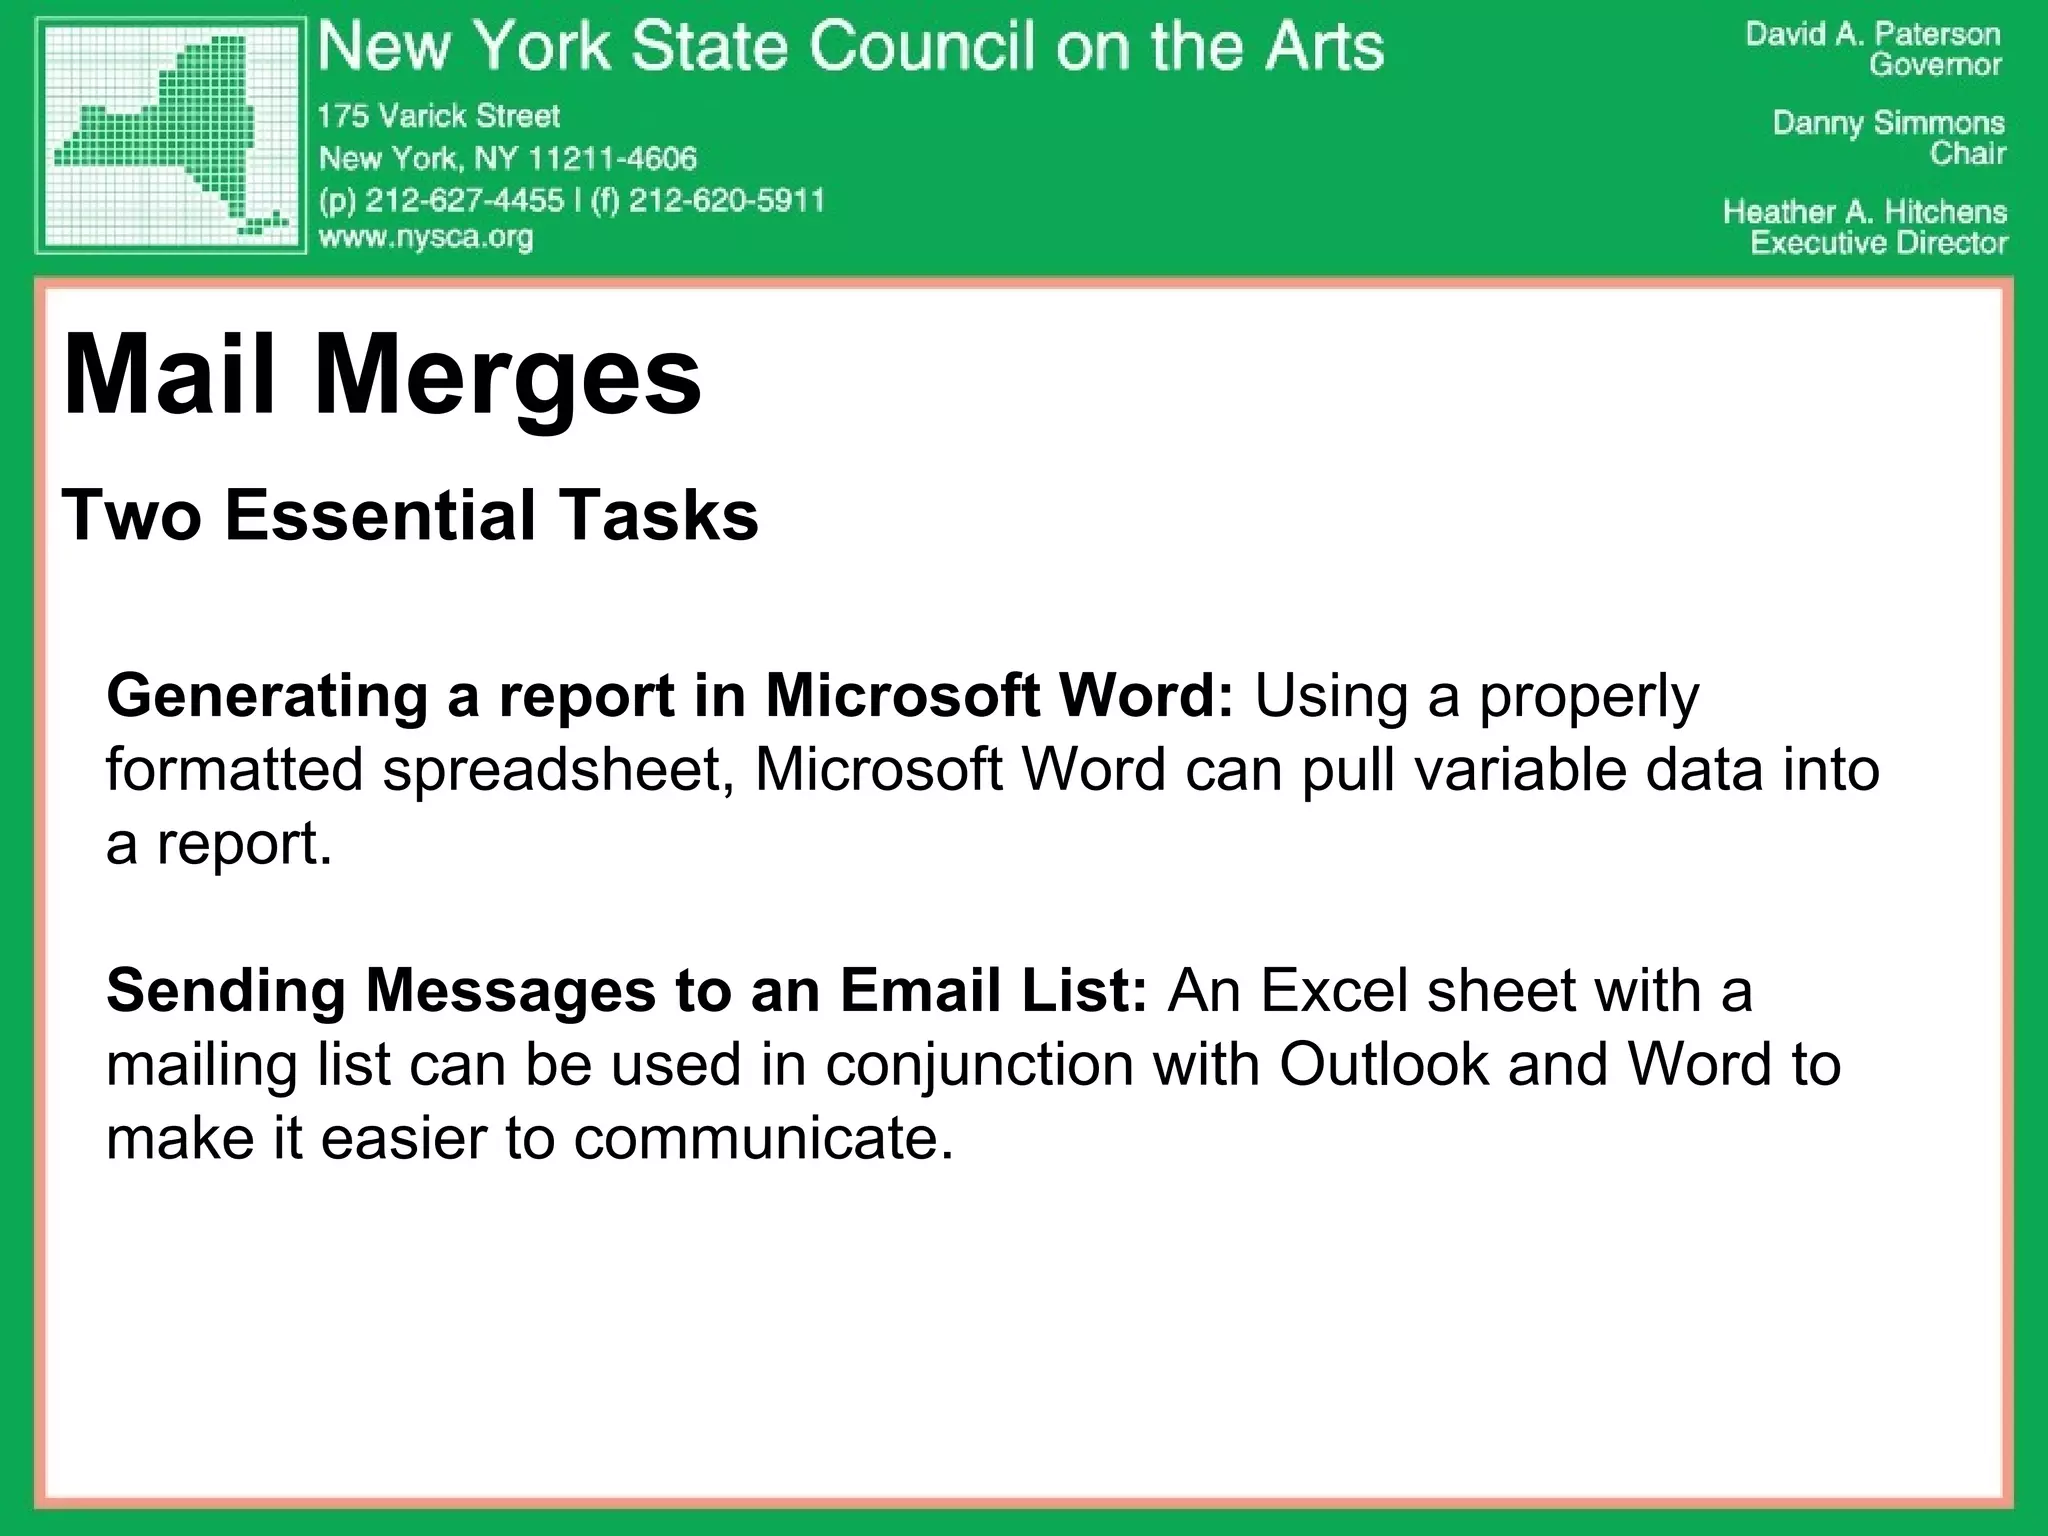
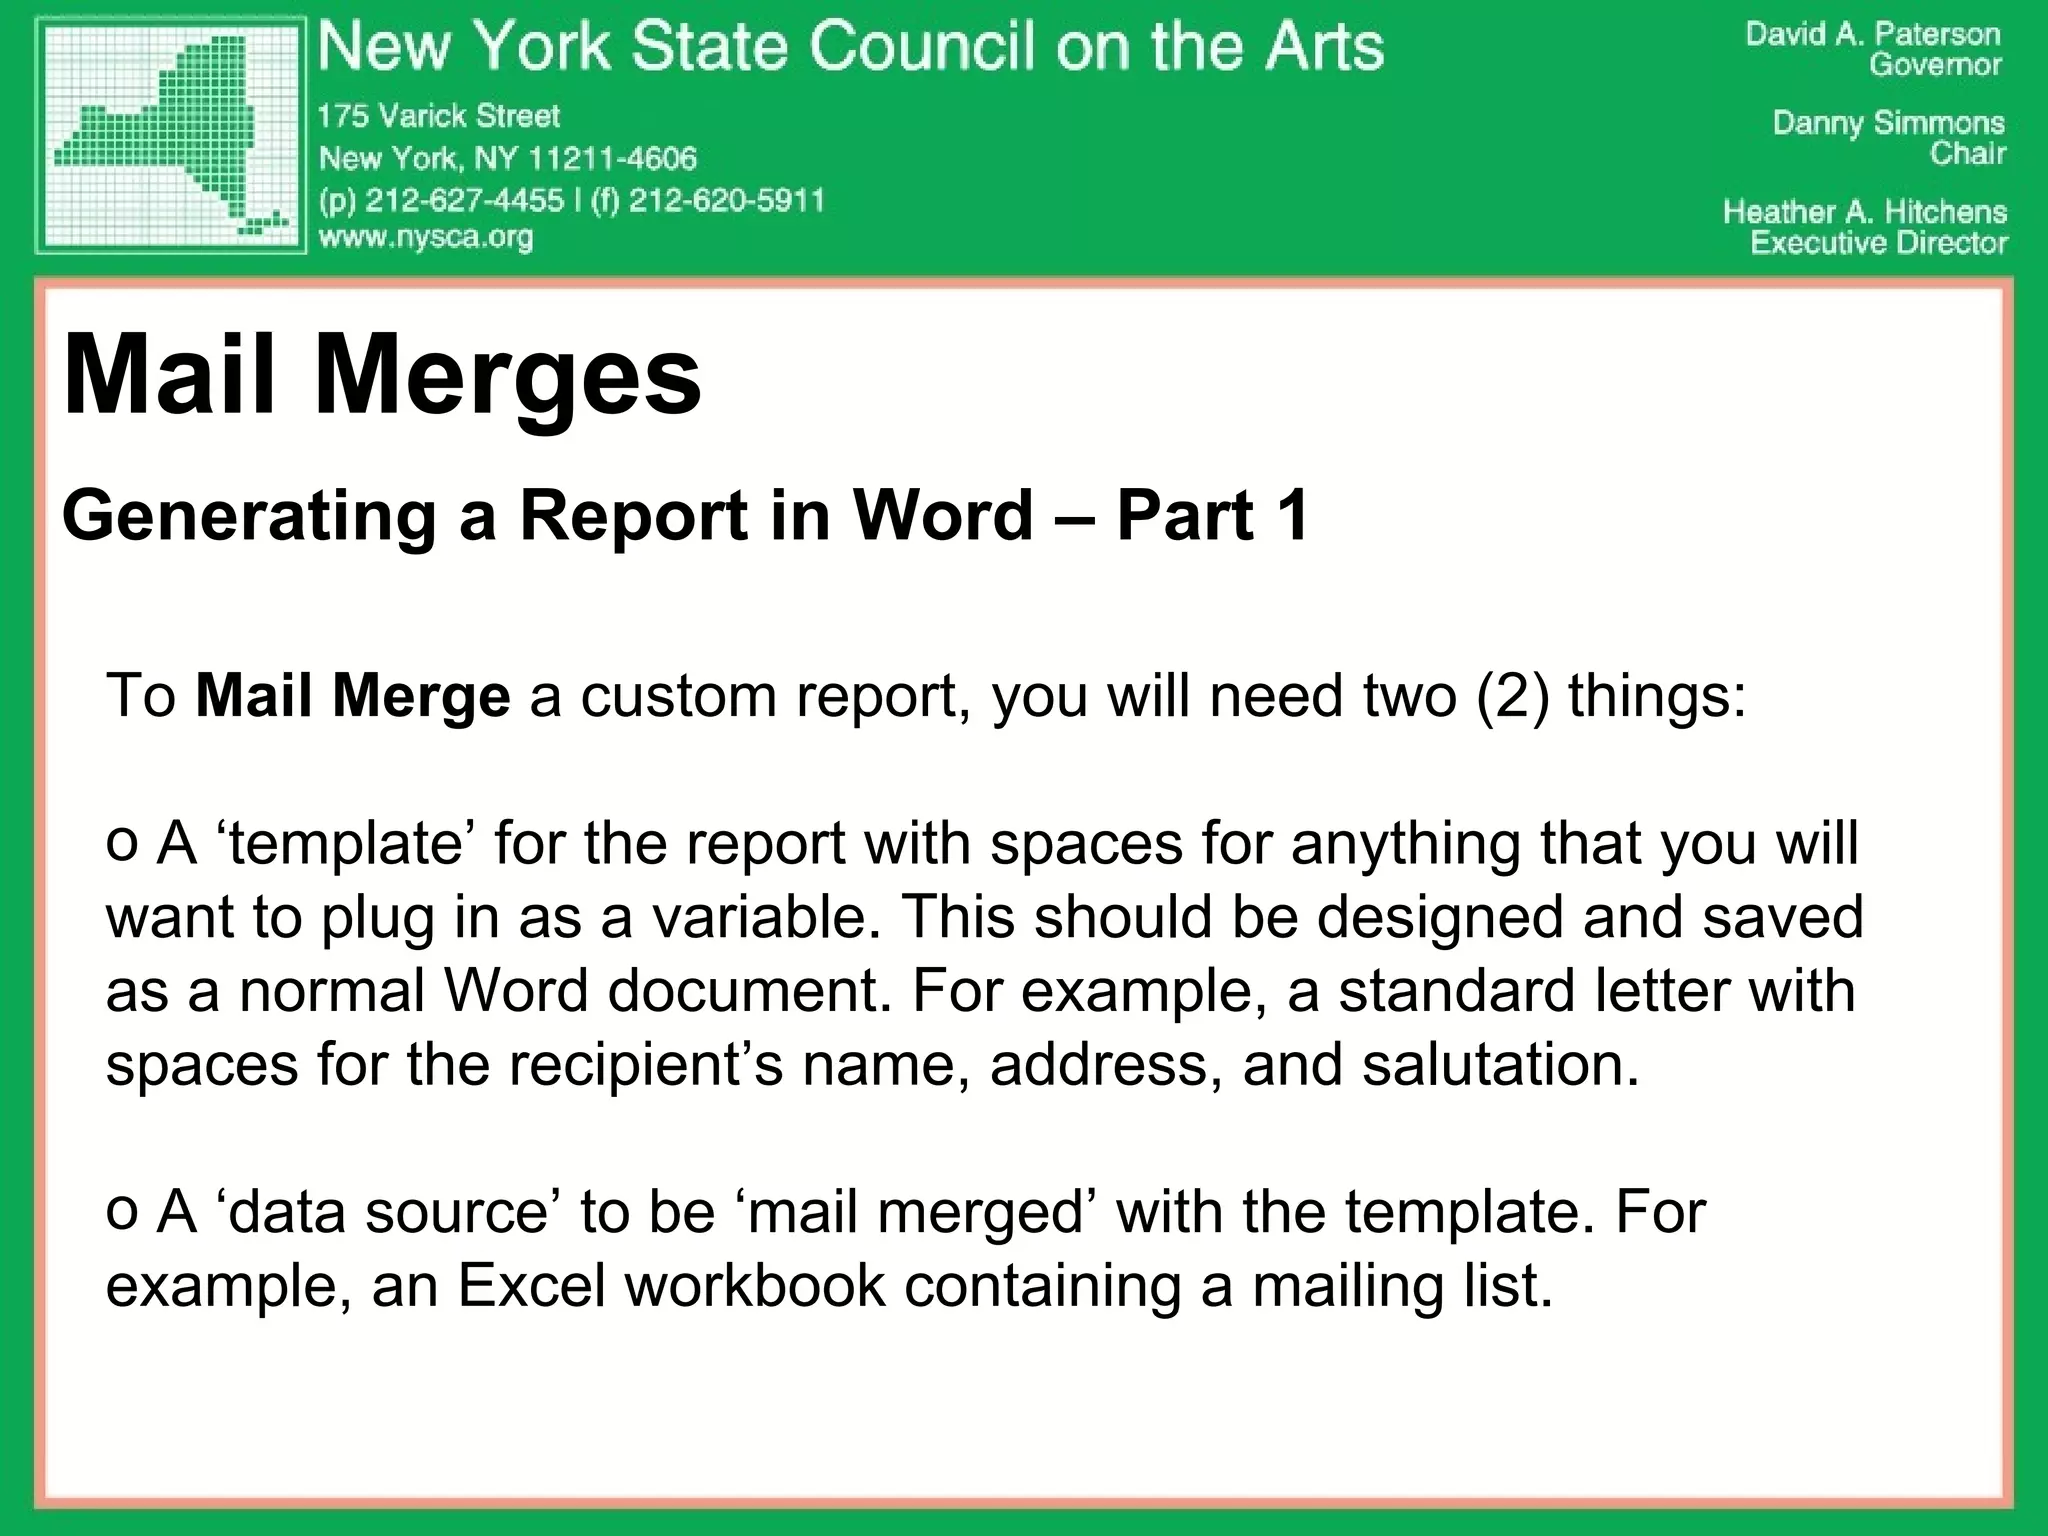
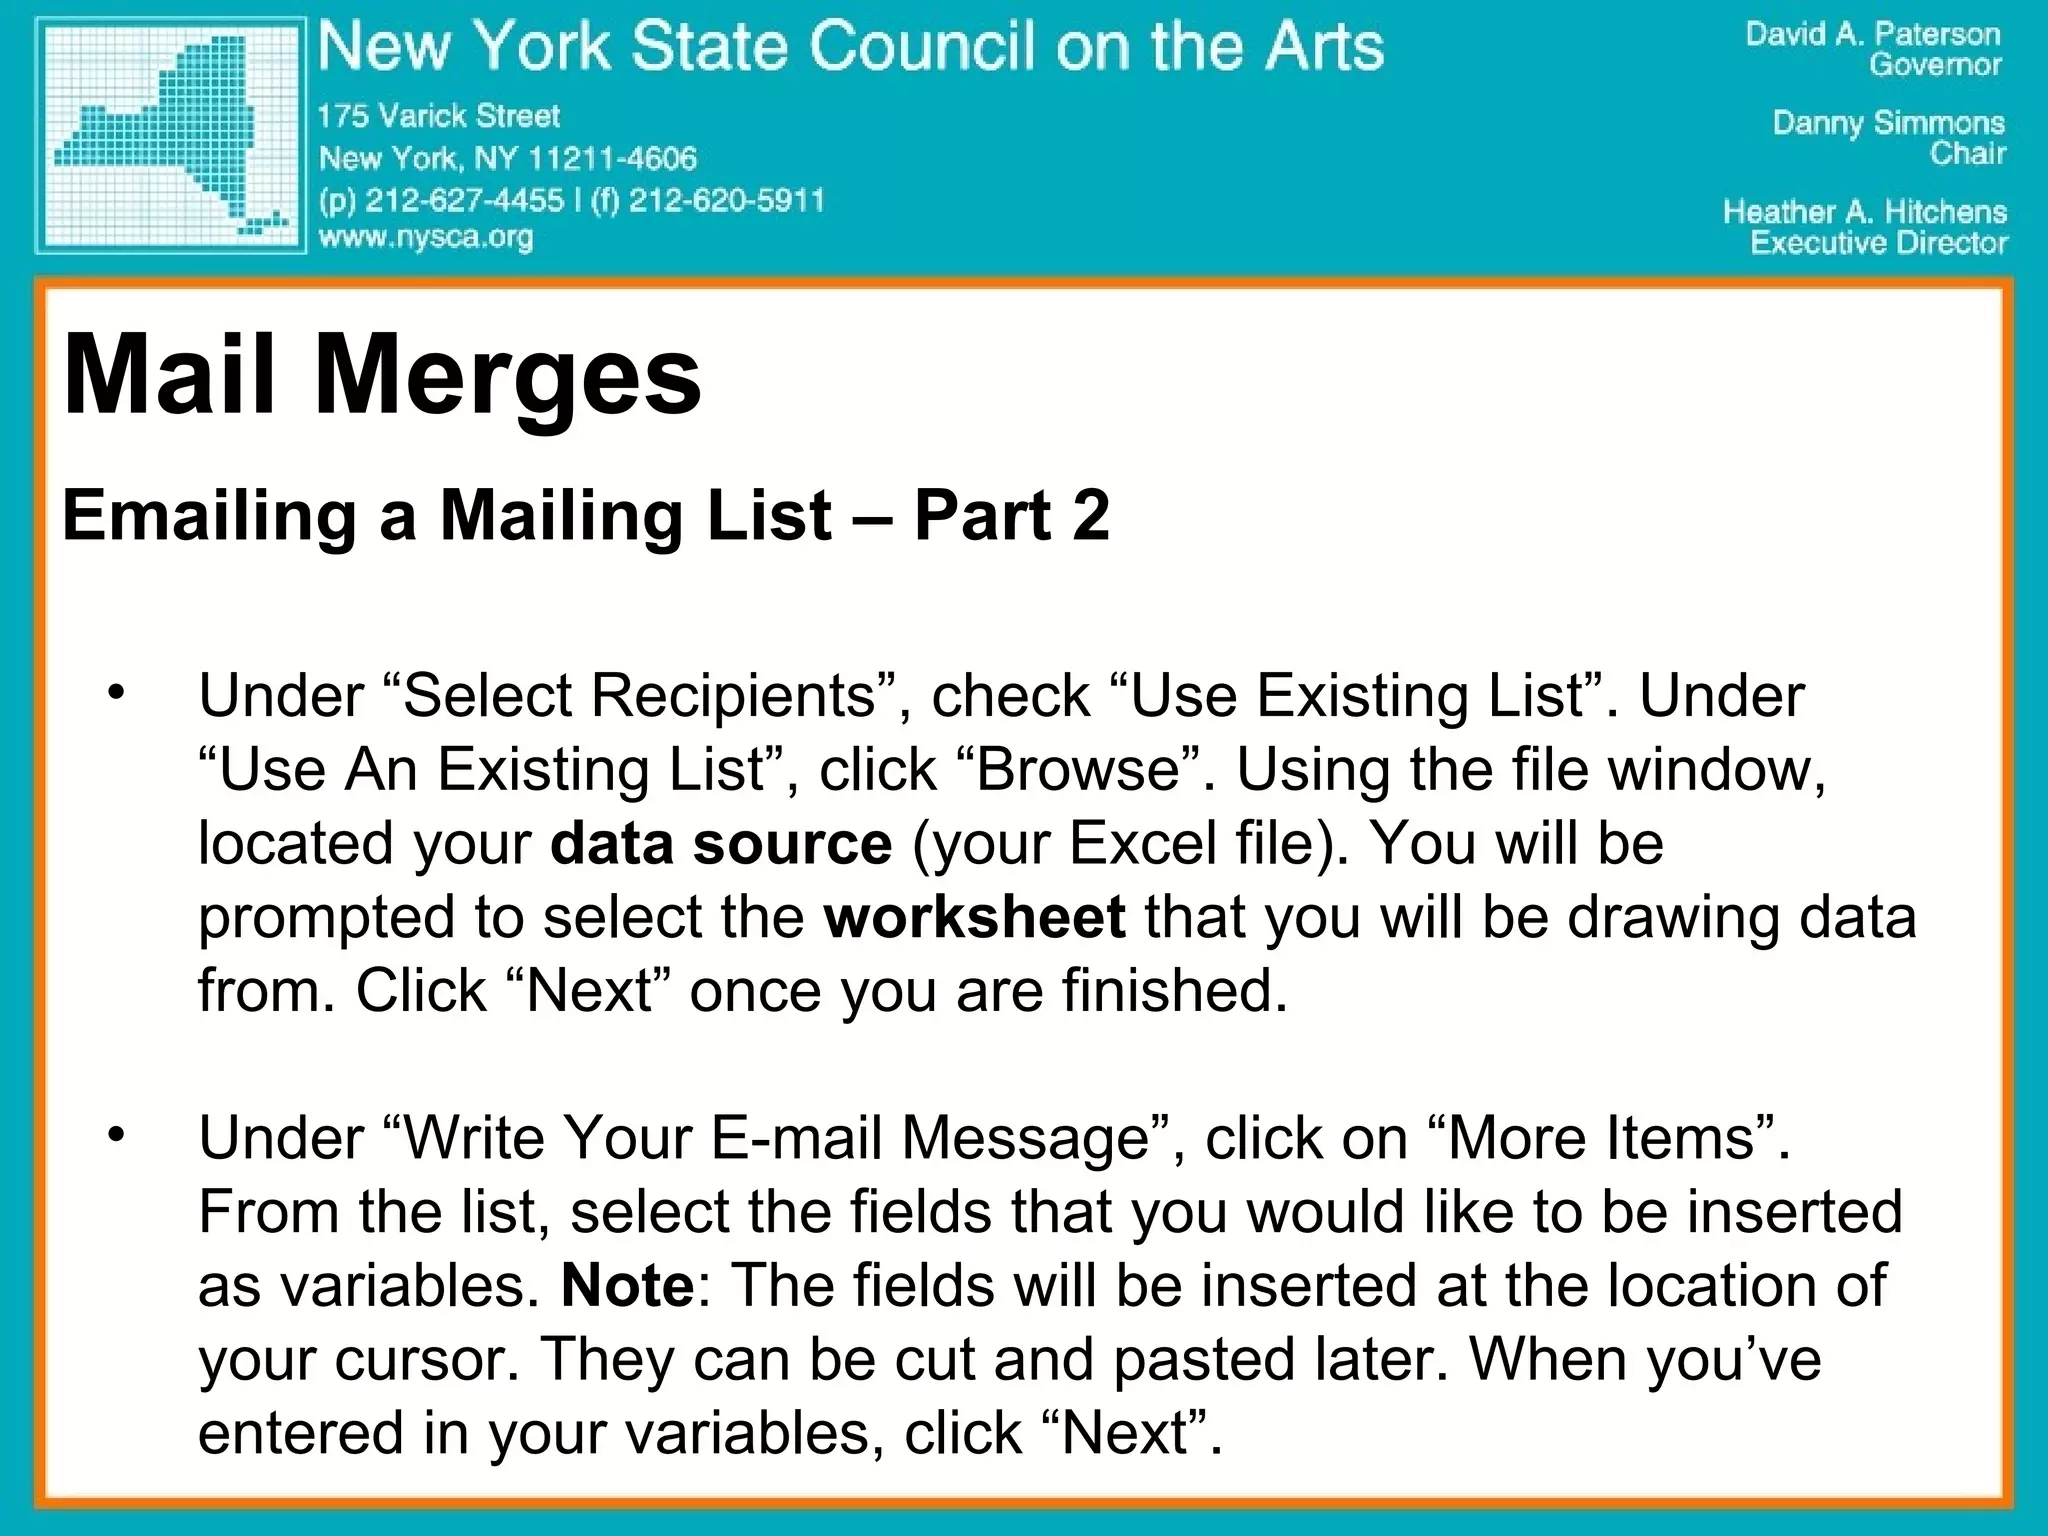
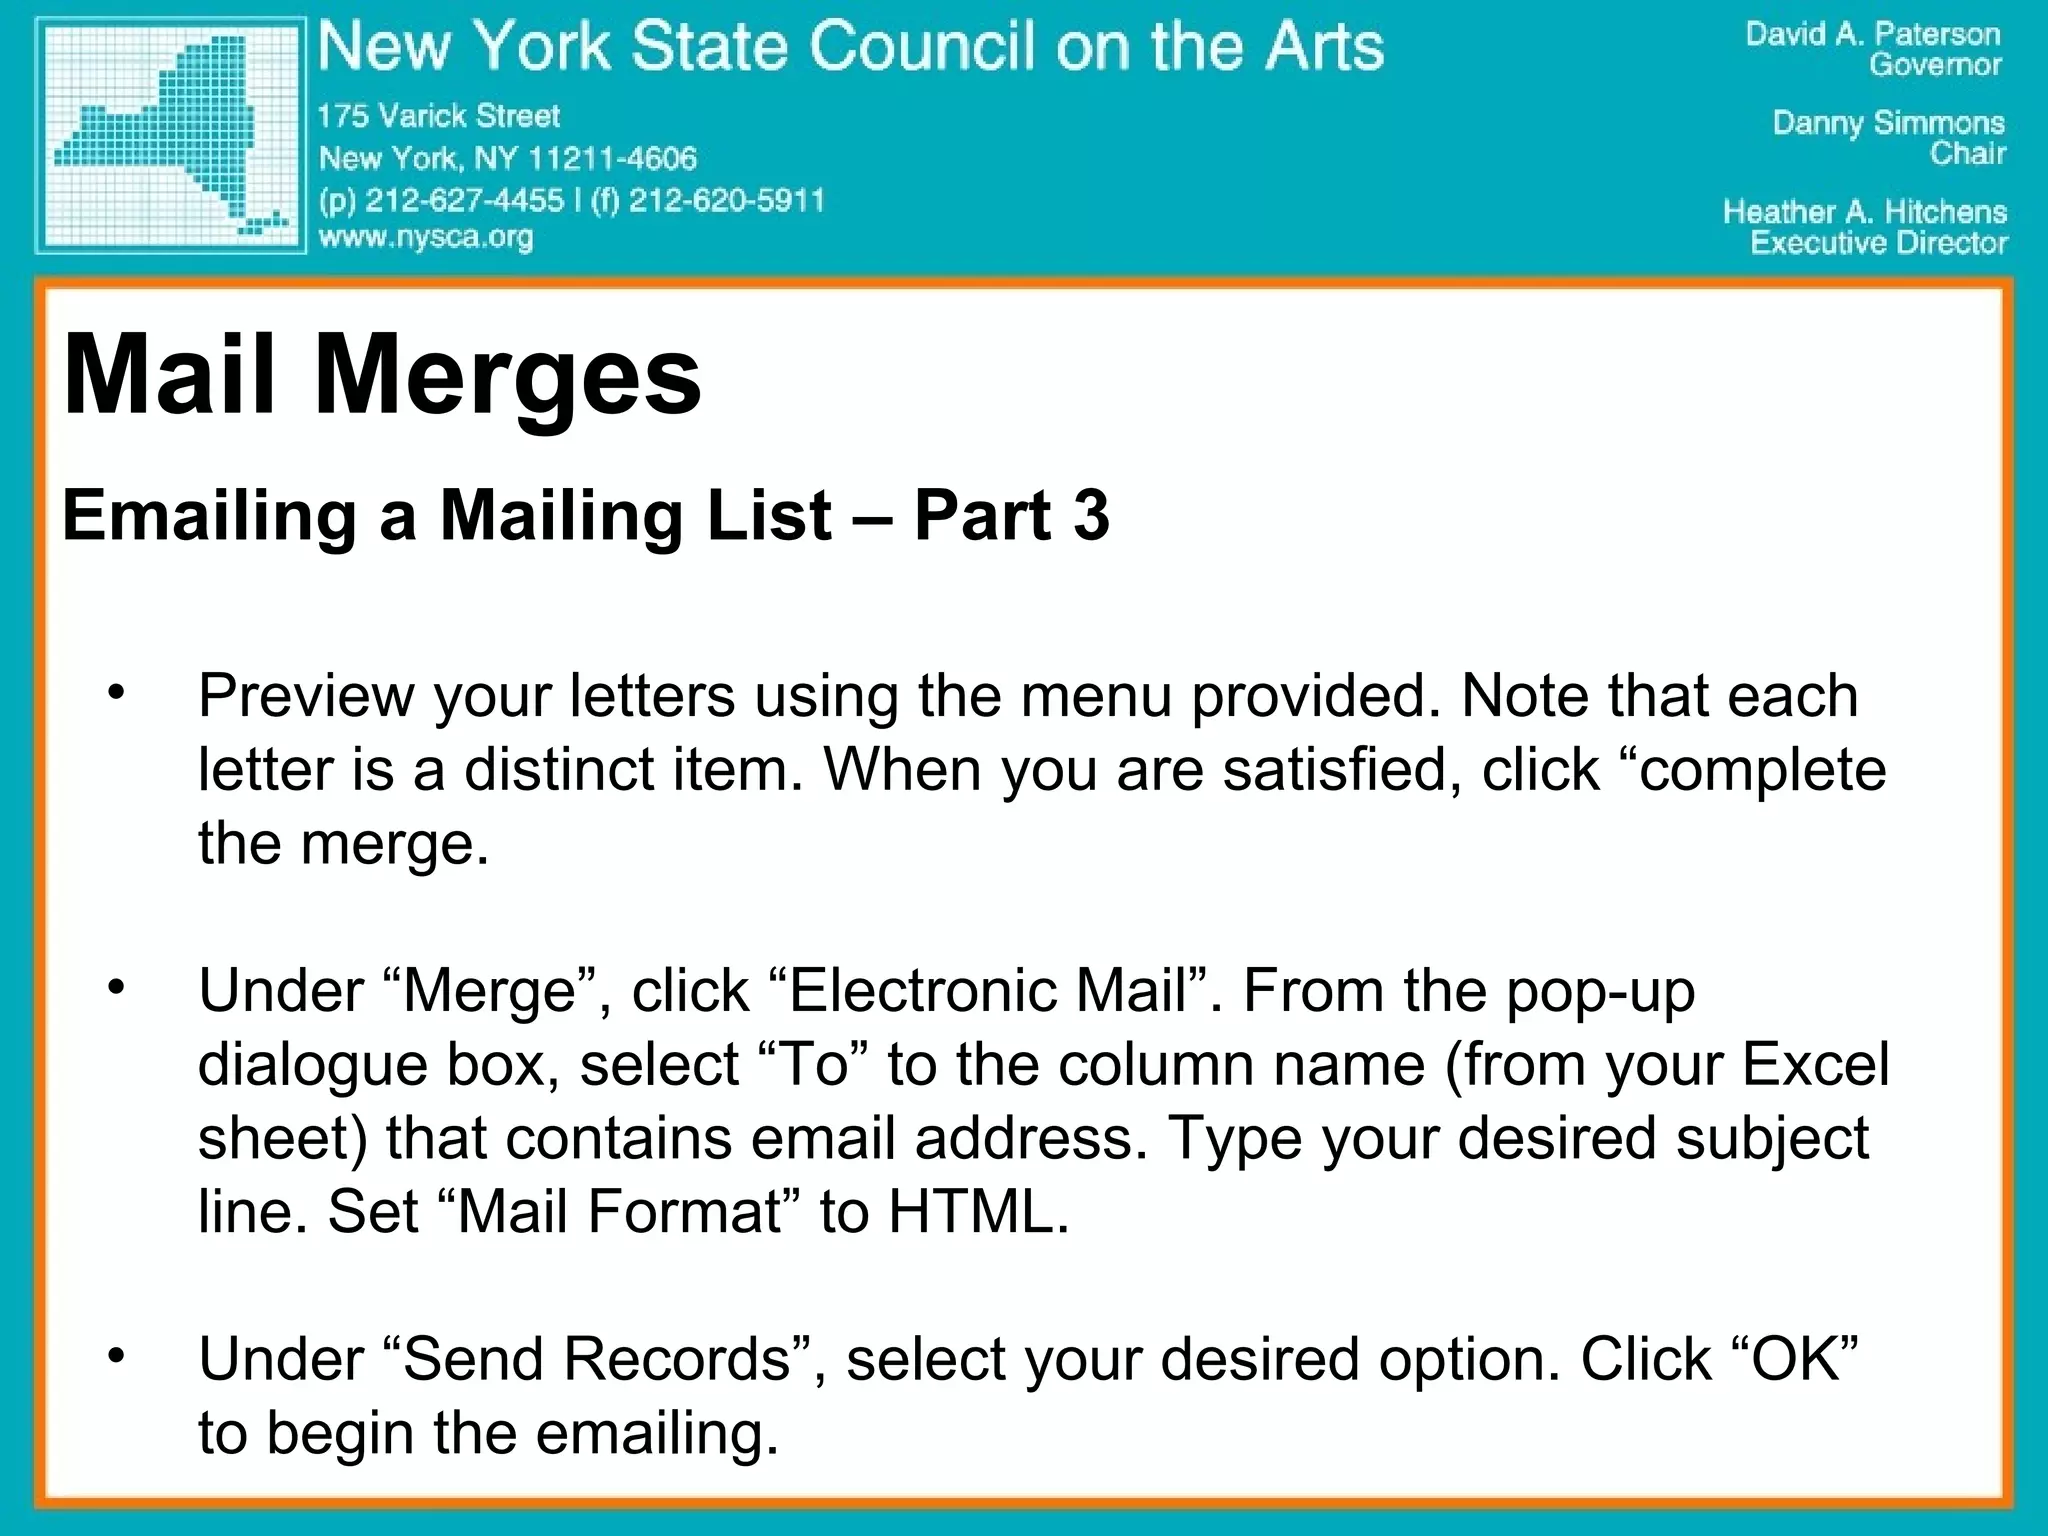
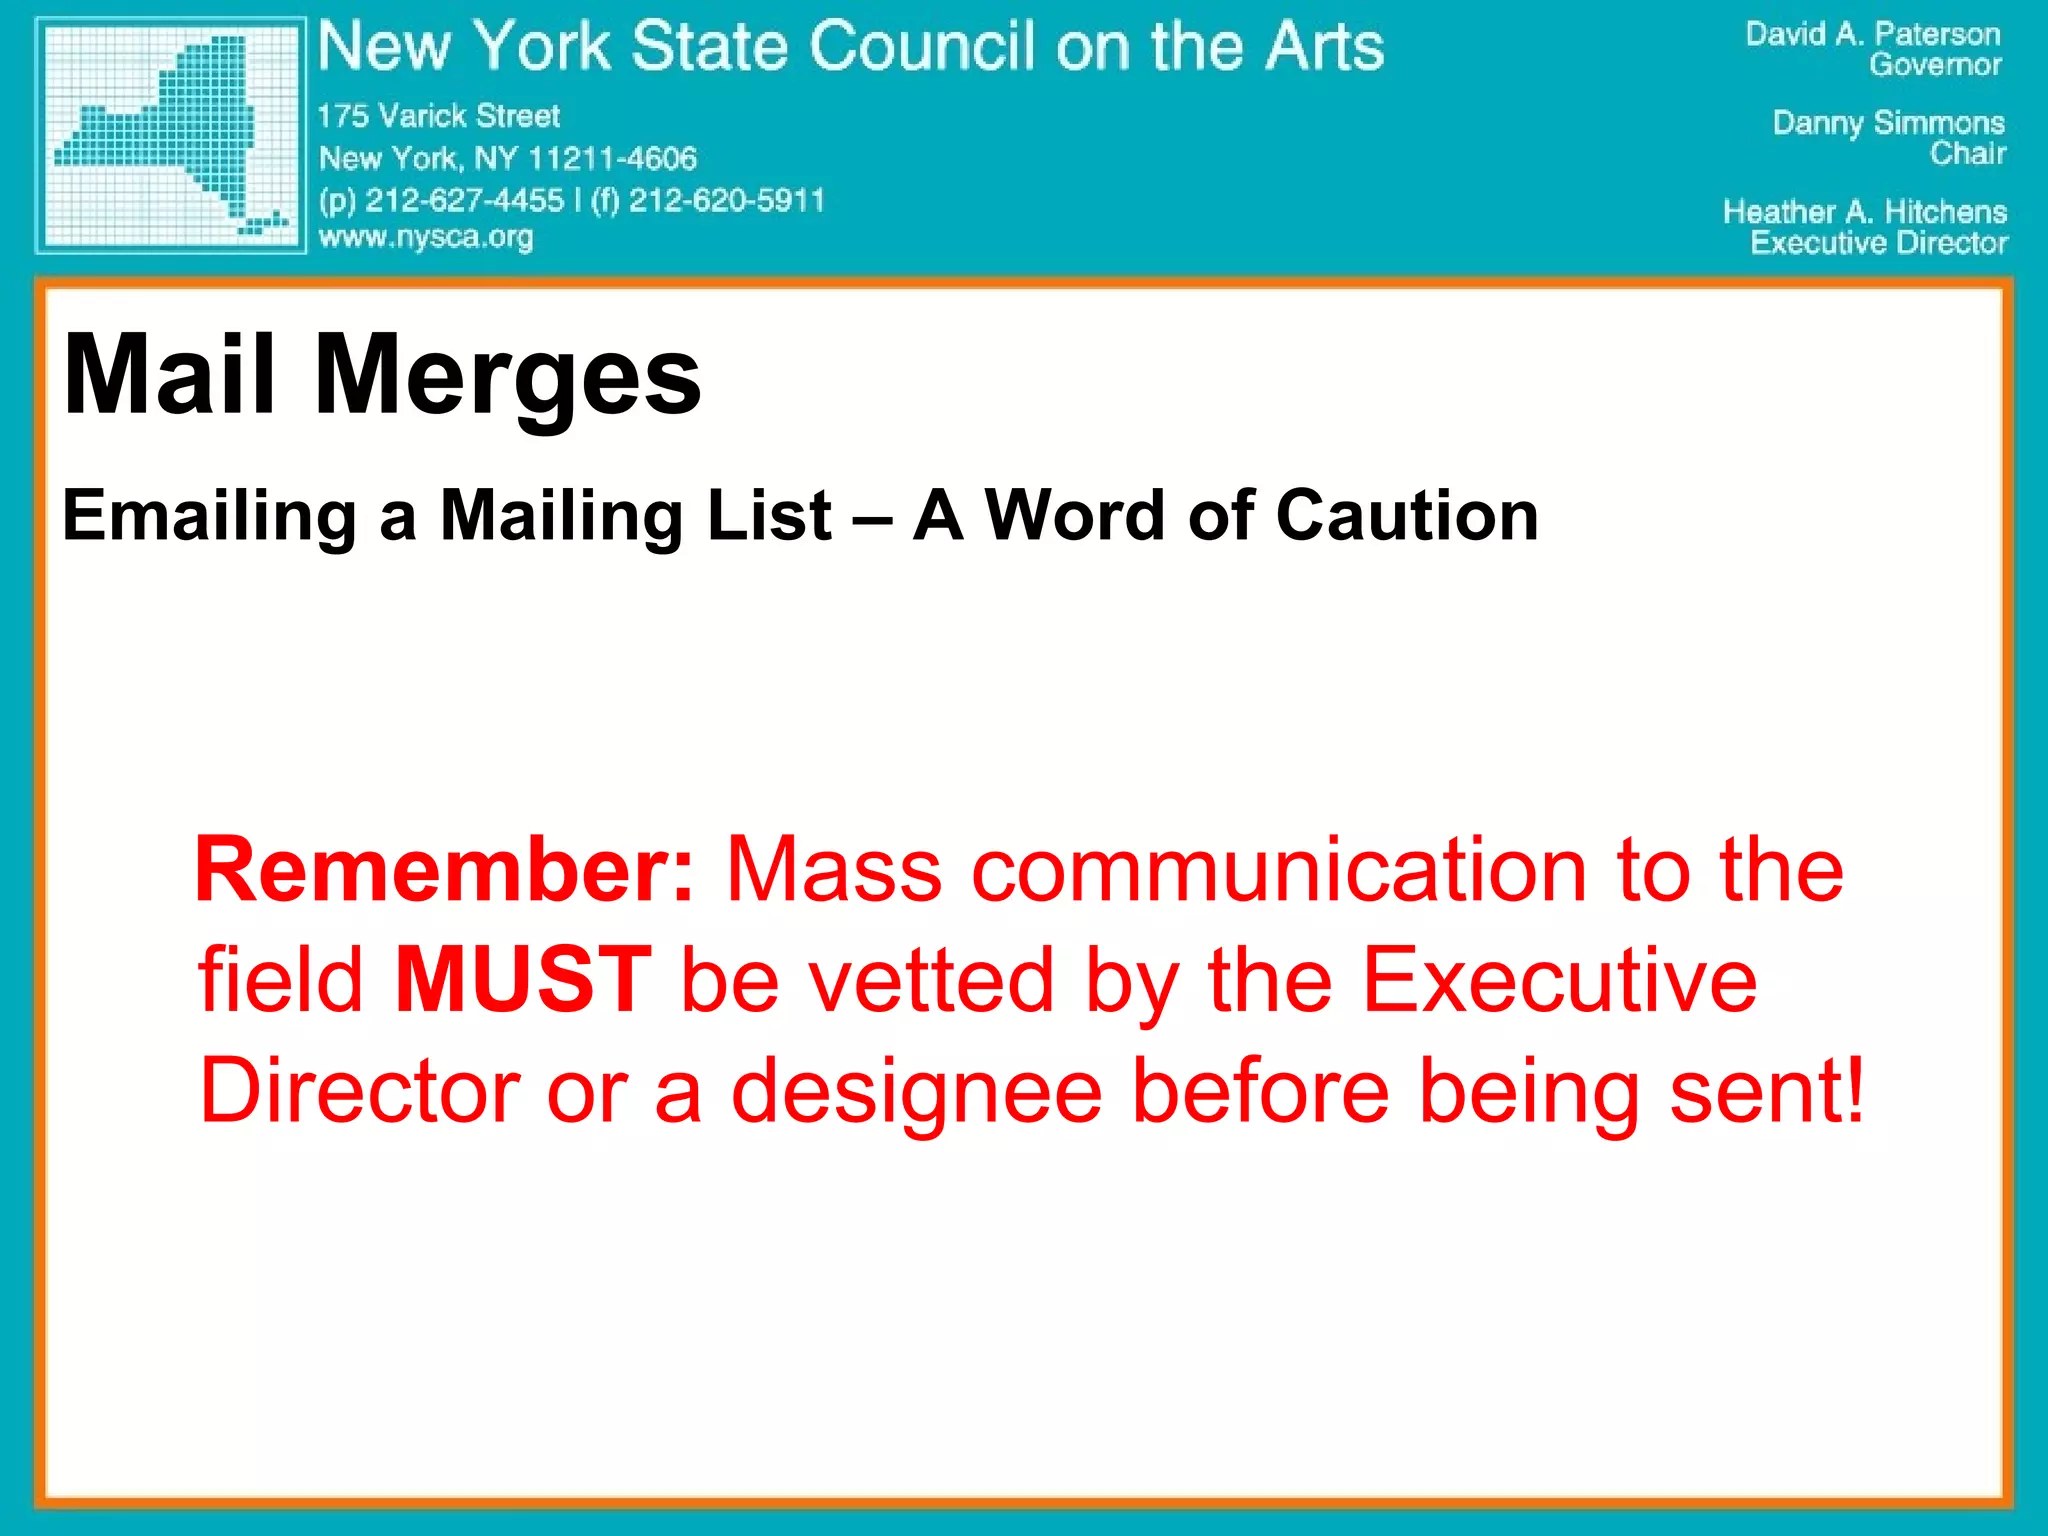
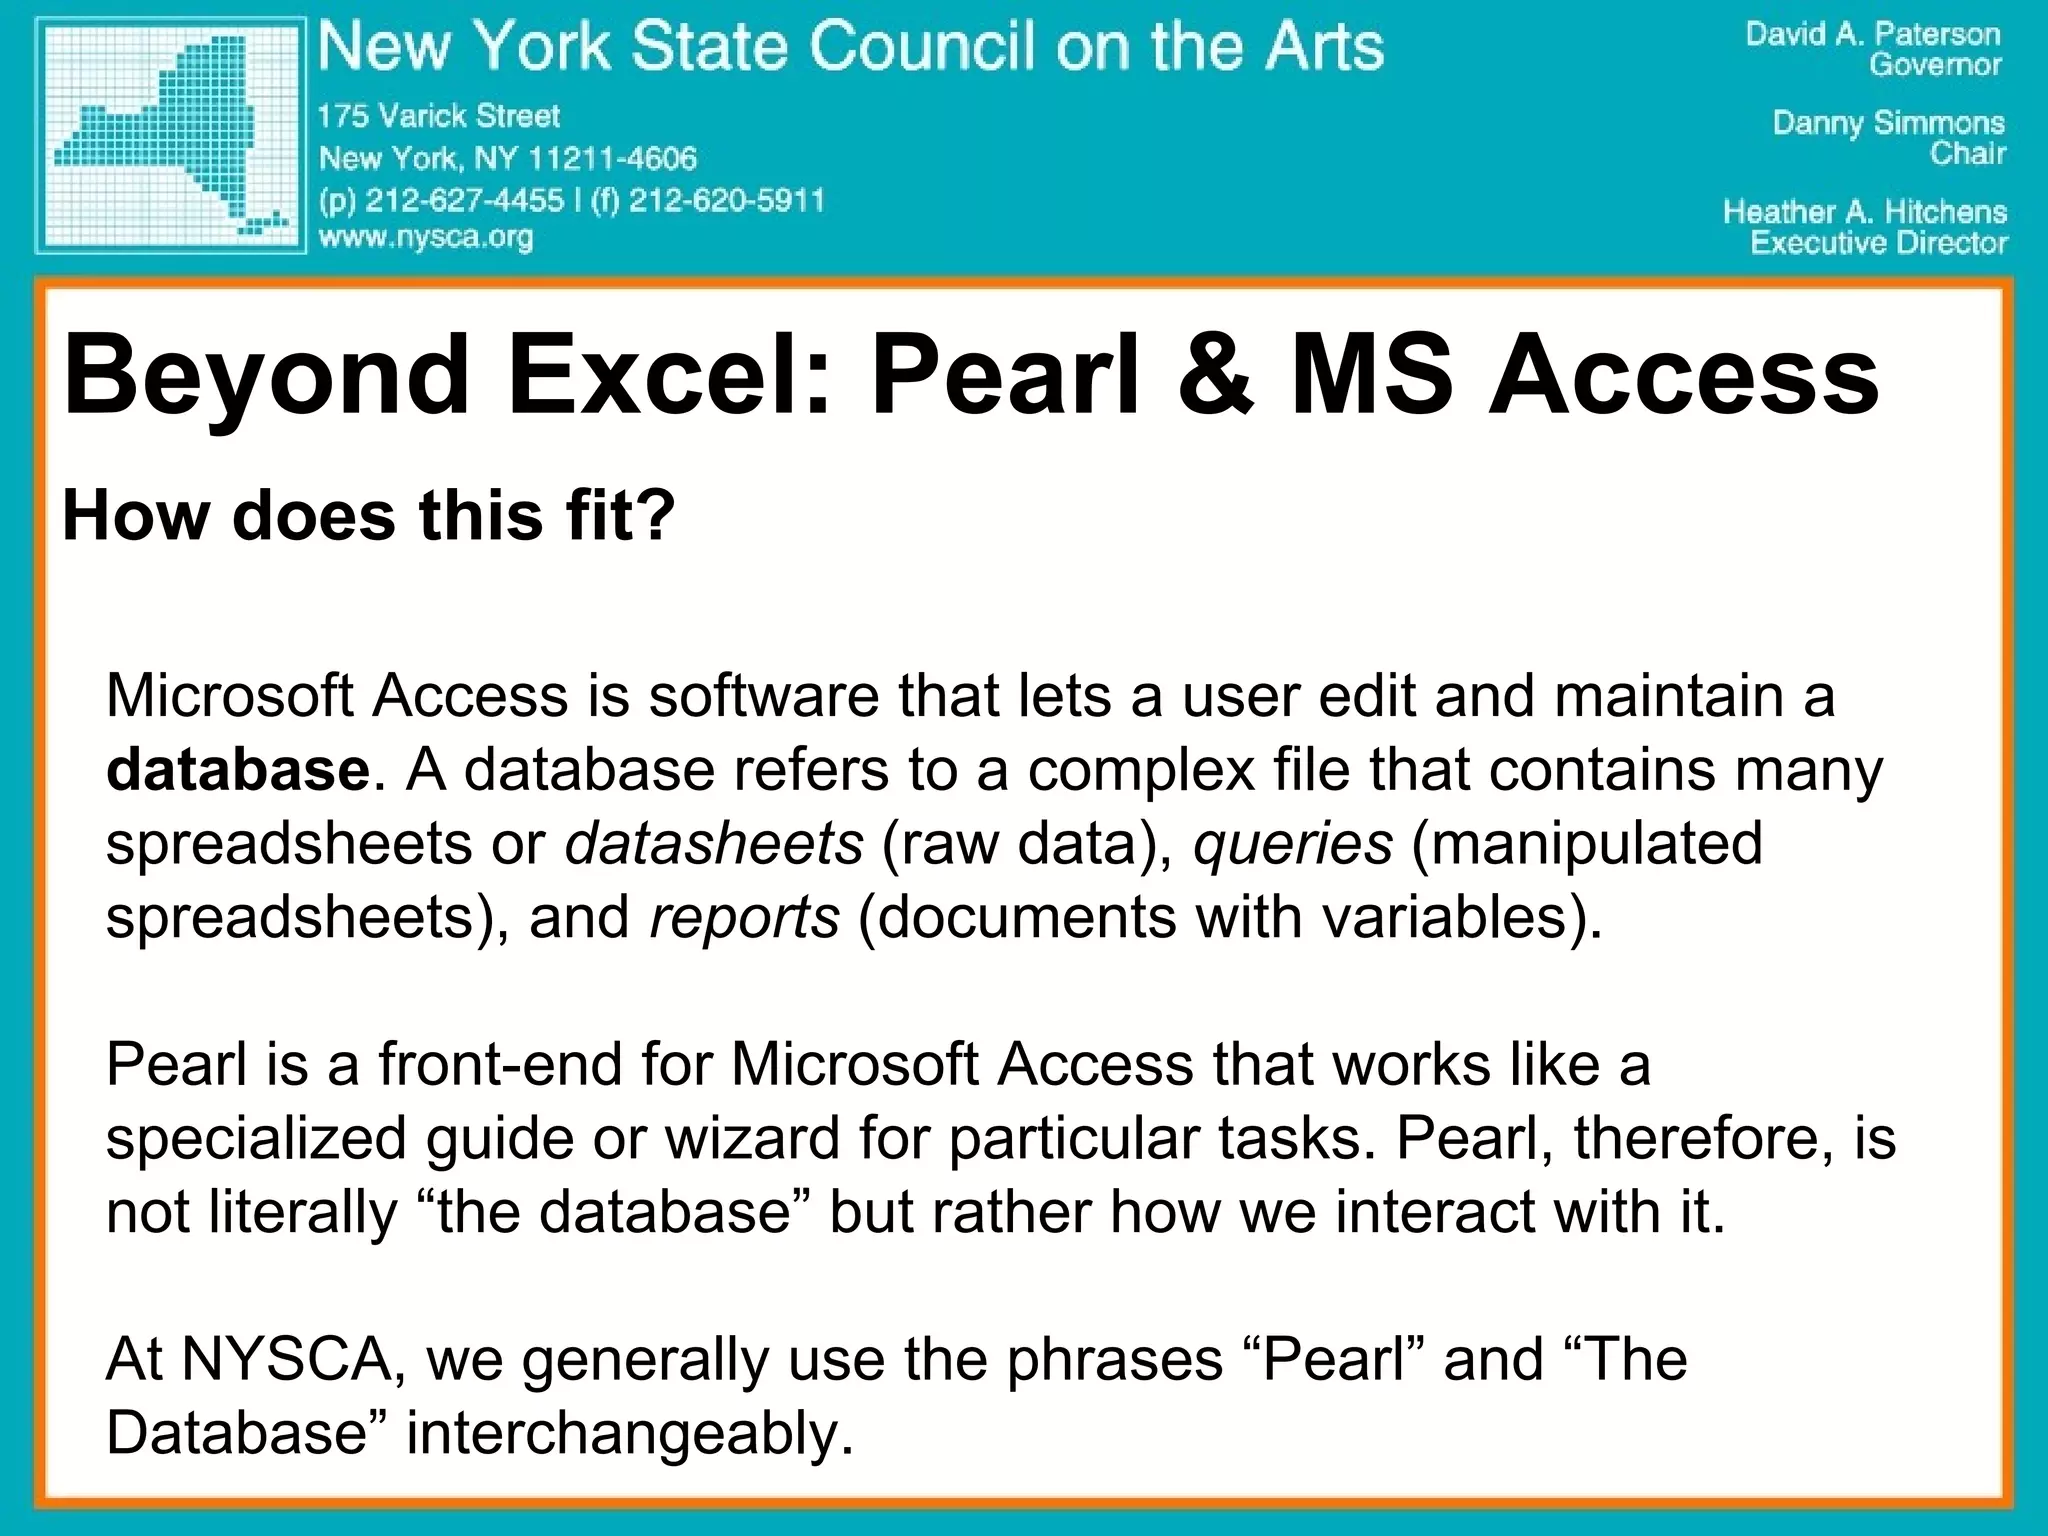
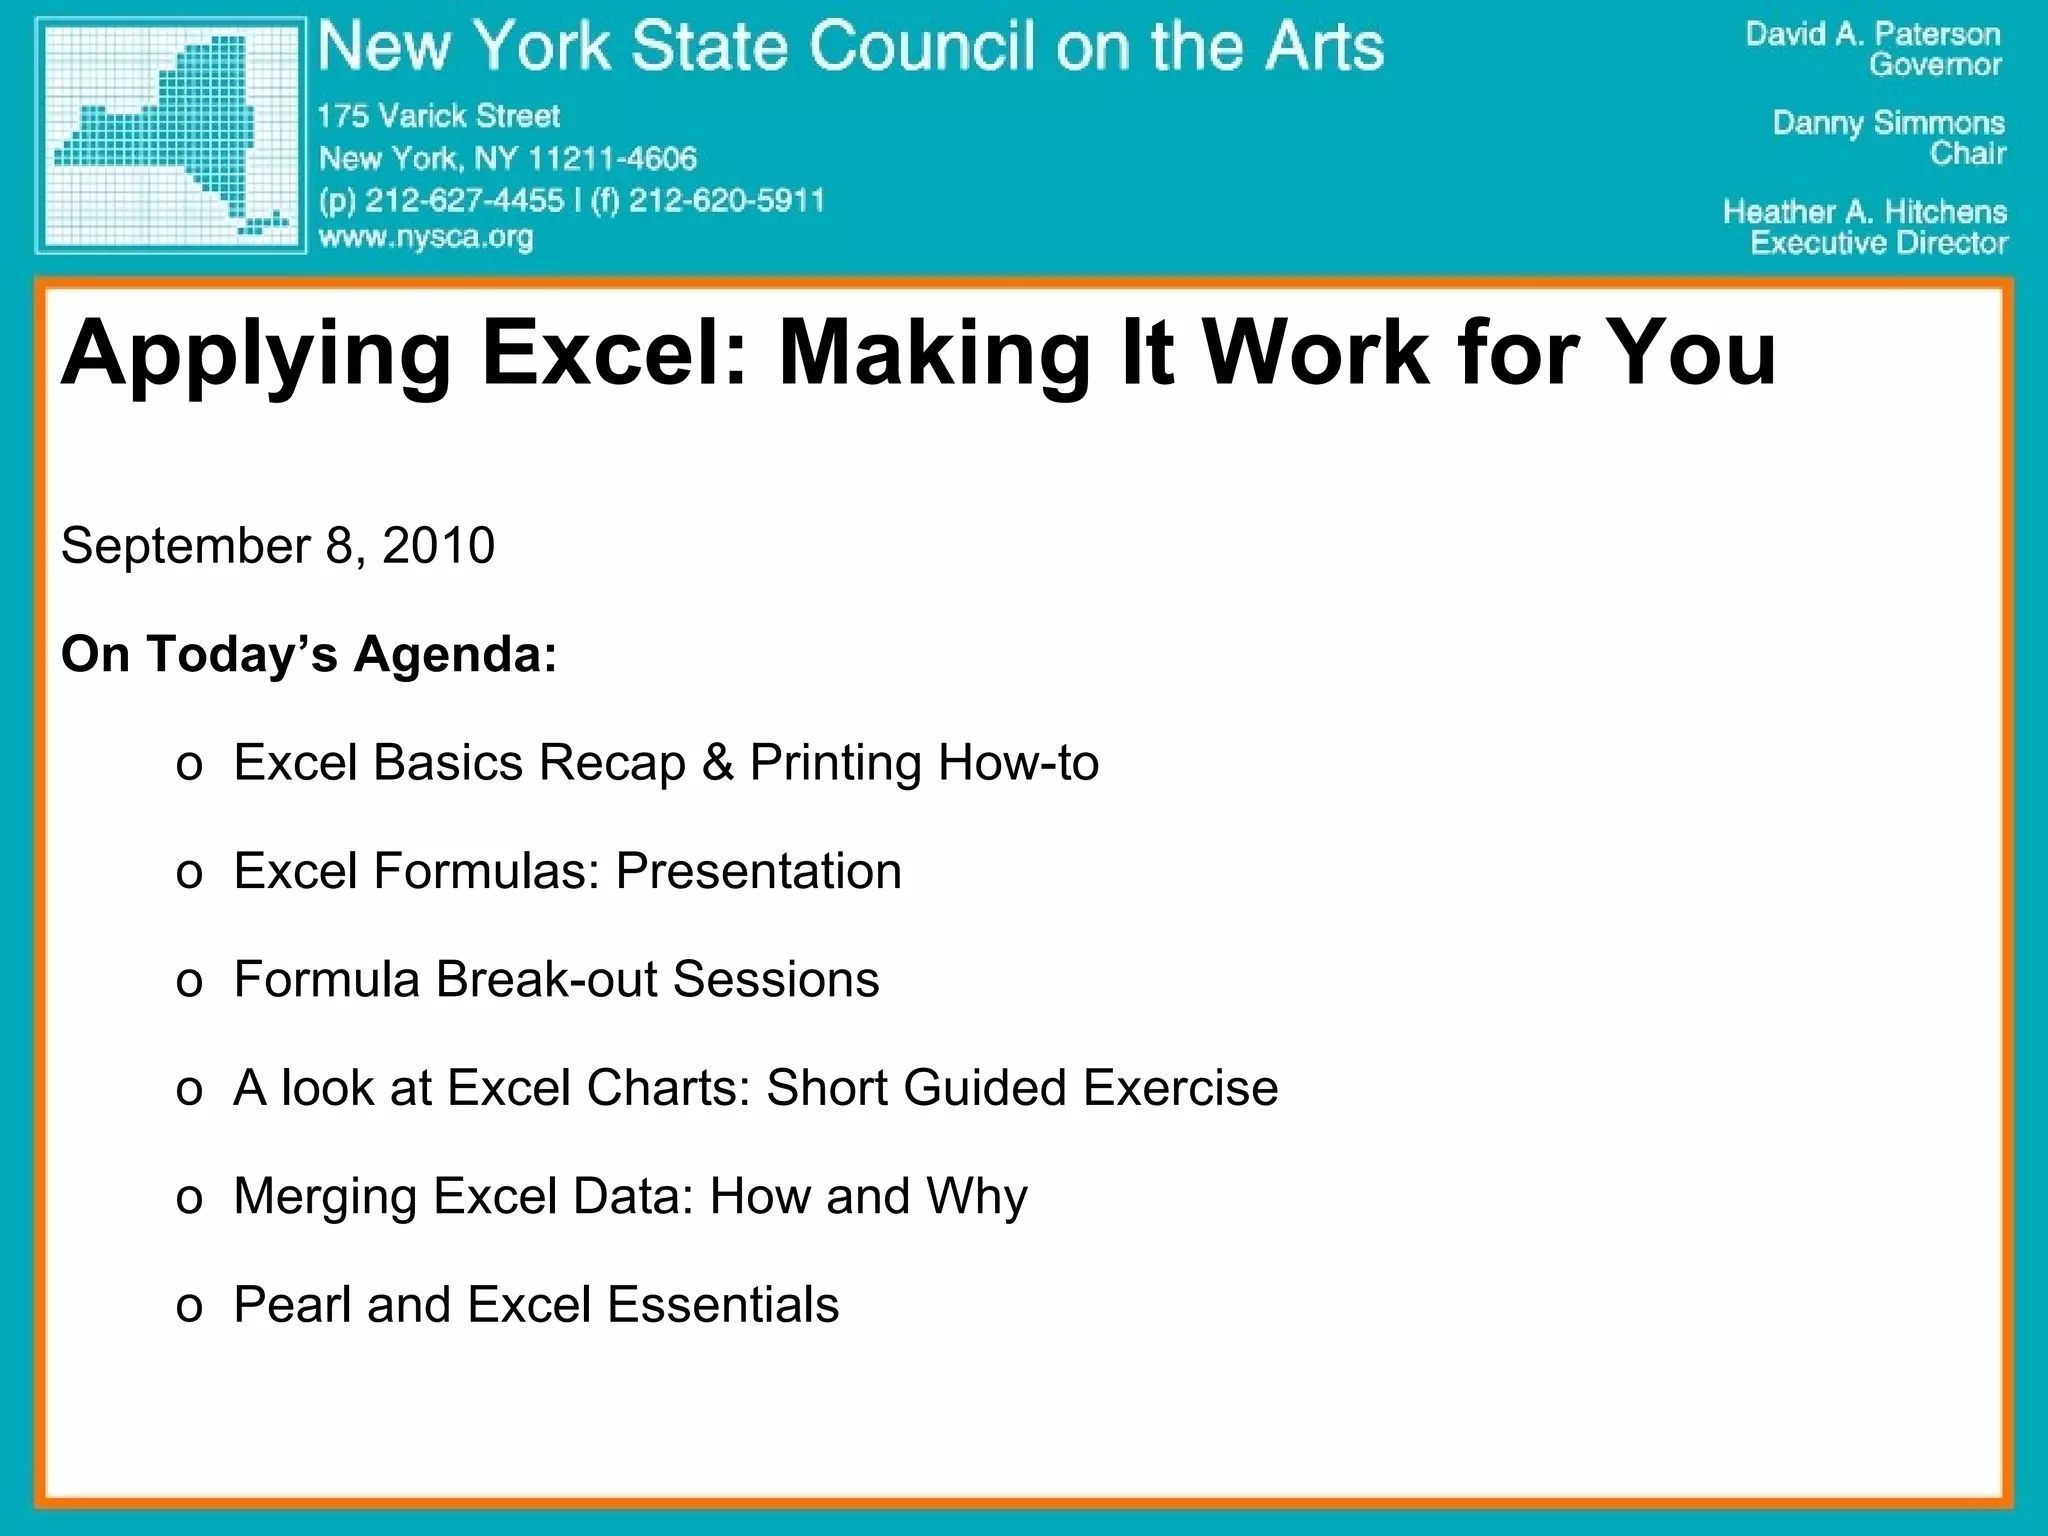
This document summarizes an Excel training session that covered various Excel topics including basics, formulas, charts, printing, and mail merges. The training was led by three organizers and included an overview of Excel components and functions, hands-on exercises to create a shopping list and chart, and demonstrations of how to print worksheets, insert formulas, and use mail merges to generate reports and send emails. Additional topics discussed how Pearl and Microsoft Access relate to accessing and analyzing organizational data stored in the database.
The site present the assignment to the students in well- structured manner including all the information in the simplest form, so that students need not spend extra time and effort in completion of the assignment and along with these they can also gain all the content engraved in the brain.
If you're a new user, Microsoft Excel can be pretty intimidating. This guide will help you learn 14 essential terms to get you started becoming literate in Excel.
Presentation to The Nutrition Society Training & Education programme is delighted to offer a Media Training workshop at the Annual Summer Meeting 2012, Queen’s University Belfast,.
Social Media Association for Business PresentationDavy Sims
This is the presentation I gave on 2 April to the Social Media Association for Business at Ignite/Create in Derry~Londonderry http://www.facebook.com/event.php?eid=179549728757668
Stavoor is een landelijke organisatie voor leren en ontwikkelen. Met opleiding, coaching, training en advies ondersteunen wij mensen om vorm te geven aan actieve participatie in samen leven en samen werken.
Hi, This file will help you, your family and your child to know more about MS Excel 2007. The language and format, what we used is very easy and comfortable.
Similar to Tech training workshop 3 final 090810 (20)
23. Excel Charts – Working Together Part 1 - Launch Excel : If Excel is already open on your workstation, open a new Excel workbook. There are three ways: 1. Go to the Standard toolbar. Click on the New Workbook button. 2. Go to the File menu. Select New . 3. Use a keyboard combination: Ctrl + N
24. Part 2 - Enter the data to be graphed : For the purpose of this lesson you will use data from FY Budgets. Enter it as you see below:
25.
26. Part 4 - Select the Chart Wizard: That is done by going to the Insert menu and selecting Chart . You can also click on the Chart Wizard button on the Standard toolbar.
27. Part 5 – Choose a Chart Type : From the Chart Wizard box that opens select Chart type. For this activity, a column graph works best.
28. Part 6 – Preview Your Chart : After you have selected the Chart type, click and hold your mouse pointer down on the Press and Hold... button to see what your data looks like in the chart type you selected. If you do not like the look, select another chart type. After you have selected the chart type you will have two options: Select Next and let Chart Wizard show you a series of options to make changes to your chart.
29. Part 7 – Format Your Chart : The second step taken by Chart Wizard is to verify the range of data being used for the chart. We will click on the series tab to revise our data. Here, we need to revise the series by removing Fiscal Year and instead placing it as the (X) axis labels.
30. Part 8 – Editing the Data Range : After clicking on the box to choose your (X) Axis labels, it will shrink to look like the box below, allowing you to view the entire spreadsheet. You can edit the data range in this small window. When you are finished, click the same box at the end to restore the window. At this time you will highlight the years from 2000-2011. This will automatically compute in the chart wizard.
31.
32. Part 9 – Insert A Chart : For the final step, Excel will ask if you would like to insert the chart as a new sheet within your workbook or as an object on the spreadsheet you created the form from.
33. . Select Next to move to the final dialog box which allows you to see the chart as a new sheet or place it on one of the sheets in your workbook. If you let the Chart Wizard finish your chart after the first dialog box, or work through each of the four steps, your chart will look something like the one below.