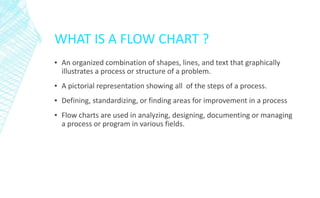
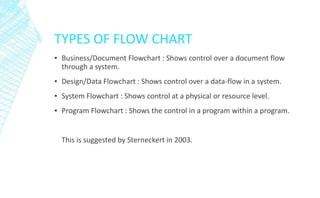
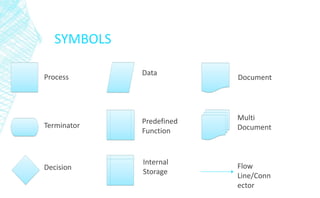
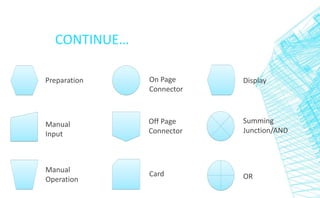
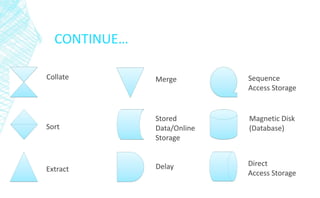
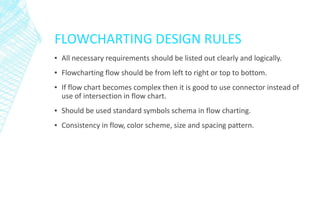
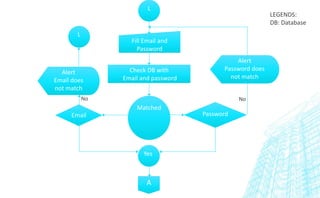
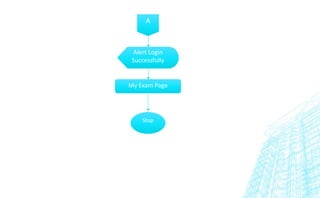
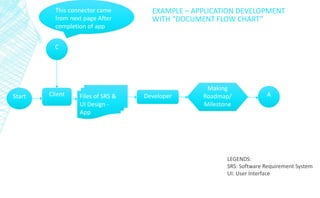
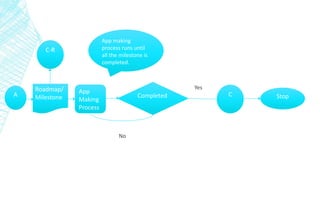
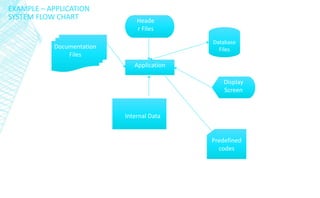
FLOWCHART 
- A solution model to given problem 
By : Gopal Devra
WHAT IS A FLOW CHART ? 
▪ An organized combination of shapes, lines, and text that graphically 
illustrates a process or structure of a problem. 
▪ A pictorial representation showing all of the steps of a process. 
▪ Defining, standardizing, or finding areas for improvement in a process 
▪ Flow charts are used in analyzing, designing, documenting or managing 
a process or program in various fields.
HISTORY 
▪ Firstly “flow process chart” introduced by Frank Gilbreth to members of 
the American Society of Mechanical Engineers (ASME) in 1921. 
▪ The tools quickly found their way into industrial engineering.
TYPES OF FLOW CHART 
▪ Business/Document Flowchart : Shows control over a document flow 
through a system. 
▪ Design/Data Flowchart : Shows control over a data-flow in a system. 
▪ System Flowchart : Shows control at a physical or resource level. 
▪ Program Flowchart : Shows the control in a program within a program. 
This is suggested by Sterneckert in 2003.
SYMBOLS 
Process 
Terminator 
Decision 
Data 
Predefined 
Function 
Internal 
Storage 
Document 
Multi 
Document 
Flow 
Line/Conn 
ector
CONTINUE… 
Preparation 
Manual 
Input 
Manual 
Operation 
On Page 
Connector 
Off Page 
Connector 
Card 
Display 
Summing 
Junction/AND 
OR
CONTINUE… 
Collate 
Sort 
Extract 
Merge 
Stored 
Data/Online 
Storage 
Delay 
Sequence 
Access Storage 
Magnetic Disk 
(Database) 
Direct 
Access Storage
FLOWCHARTING DESIGN RULES 
▪ All necessary requirements should be listed out clearly and logically. 
▪ Flowcharting flow should be from left to right or top to bottom. 
▪ If flow chart becomes complex then it is good to use connector instead of 
use of intersection in flow chart. 
▪ Should be used standard symbols schema in flow charting. 
▪ Consistency in flow, color scheme, size and spacing pattern.
EXAMPLE PROGRAMMING FLOW CHART– 
FINDING MAX AMONG N NUMBER
Start 
Design Flow Chart 
Example - Login Page 
Welcome Page 
Application 
Forgot 
Password 
Registration 
Login 
R 
L 
F 
Select
Start 
Welcome Page 
Application 
Forgot 
Password 
Registration 
Login 
R 
L 
F 
Select 
Design Flow Chart 
Example - Login Page
L 
Fill Email and 
Password 
Check DB with 
Email and password 
Email Password 
A 
Alert 
Password does 
not match 
L 
Alert 
Email does 
not match 
No No 
LEGENDS: 
DB: Database 
Matched 
Yes
A 
Alert Login 
Successfully 
My Exam Page 
Stop
IBM WORKSHEET FOR FLOW CHARTING
This connector came 
from next page After 
completion of app 
Start Client Developer 
Making 
Roadmap/ 
Milestone 
Files of SRS & 
UI Design - 
App 
A 
C 
EXAMPLE – APPLICATION DEVELOPMENT 
WITH “DOCUMENT FLOW CHART” 
LEGENDS: 
SRS: Software Requirement System 
UI: User Interface
A 
Roadmap/ 
Milestone 
App 
Making 
Process 
Completed C 
No 
Yes 
Stop 
C-R 
App making 
process runs until 
all the milestone is 
completed.
Heade 
r Files 
Application 
Documentation 
Files 
Internal Data 
Display 
Screen 
Predefined 
codes 
EXAMPLE – APPLICATION 
SYSTEM FLOW CHART 
Database 
Files
CONCLUSION 
▪ A flowchart is a diagram that depicts the “flow of control” of a 
program. 
▪ Each symbol represents a different type of operation. 
▪ There are three types of execution in flow charts – Sequence, Selection 
and Iteration.
Flowchart basics by Gopal Devra

Flowchart basics by Gopal Devra

  • 1.
    FLOWCHART - Asolution model to given problem By : Gopal Devra
  • 2.
    WHAT IS AFLOW CHART ? ▪ An organized combination of shapes, lines, and text that graphically illustrates a process or structure of a problem. ▪ A pictorial representation showing all of the steps of a process. ▪ Defining, standardizing, or finding areas for improvement in a process ▪ Flow charts are used in analyzing, designing, documenting or managing a process or program in various fields.
  • 3.
    HISTORY ▪ Firstly“flow process chart” introduced by Frank Gilbreth to members of the American Society of Mechanical Engineers (ASME) in 1921. ▪ The tools quickly found their way into industrial engineering.
  • 4.
    TYPES OF FLOWCHART ▪ Business/Document Flowchart : Shows control over a document flow through a system. ▪ Design/Data Flowchart : Shows control over a data-flow in a system. ▪ System Flowchart : Shows control at a physical or resource level. ▪ Program Flowchart : Shows the control in a program within a program. This is suggested by Sterneckert in 2003.
  • 5.
    SYMBOLS Process Terminator Decision Data Predefined Function Internal Storage Document Multi Document Flow Line/Conn ector
  • 6.
    CONTINUE… Preparation Manual Input Manual Operation On Page Connector Off Page Connector Card Display Summing Junction/AND OR
  • 7.
    CONTINUE… Collate Sort Extract Merge Stored Data/Online Storage Delay Sequence Access Storage Magnetic Disk (Database) Direct Access Storage
  • 8.
    FLOWCHARTING DESIGN RULES ▪ All necessary requirements should be listed out clearly and logically. ▪ Flowcharting flow should be from left to right or top to bottom. ▪ If flow chart becomes complex then it is good to use connector instead of use of intersection in flow chart. ▪ Should be used standard symbols schema in flow charting. ▪ Consistency in flow, color scheme, size and spacing pattern.
  • 9.
    EXAMPLE PROGRAMMING FLOWCHART– FINDING MAX AMONG N NUMBER
  • 10.
    Start Design FlowChart Example - Login Page Welcome Page Application Forgot Password Registration Login R L F Select
  • 11.
    Start Welcome Page Application Forgot Password Registration Login R L F Select Design Flow Chart Example - Login Page
  • 12.
    L Fill Emailand Password Check DB with Email and password Email Password A Alert Password does not match L Alert Email does not match No No LEGENDS: DB: Database Matched Yes
  • 13.
    A Alert Login Successfully My Exam Page Stop
  • 14.
    IBM WORKSHEET FORFLOW CHARTING
  • 15.
    This connector came from next page After completion of app Start Client Developer Making Roadmap/ Milestone Files of SRS & UI Design - App A C EXAMPLE – APPLICATION DEVELOPMENT WITH “DOCUMENT FLOW CHART” LEGENDS: SRS: Software Requirement System UI: User Interface
  • 16.
    A Roadmap/ Milestone App Making Process Completed C No Yes Stop C-R App making process runs until all the milestone is completed.
  • 17.
    Heade r Files Application Documentation Files Internal Data Display Screen Predefined codes EXAMPLE – APPLICATION SYSTEM FLOW CHART Database Files
  • 18.
    CONCLUSION ▪ Aflowchart is a diagram that depicts the “flow of control” of a program. ▪ Each symbol represents a different type of operation. ▪ There are three types of execution in flow charts – Sequence, Selection and Iteration.