Download as PDF, PPTX


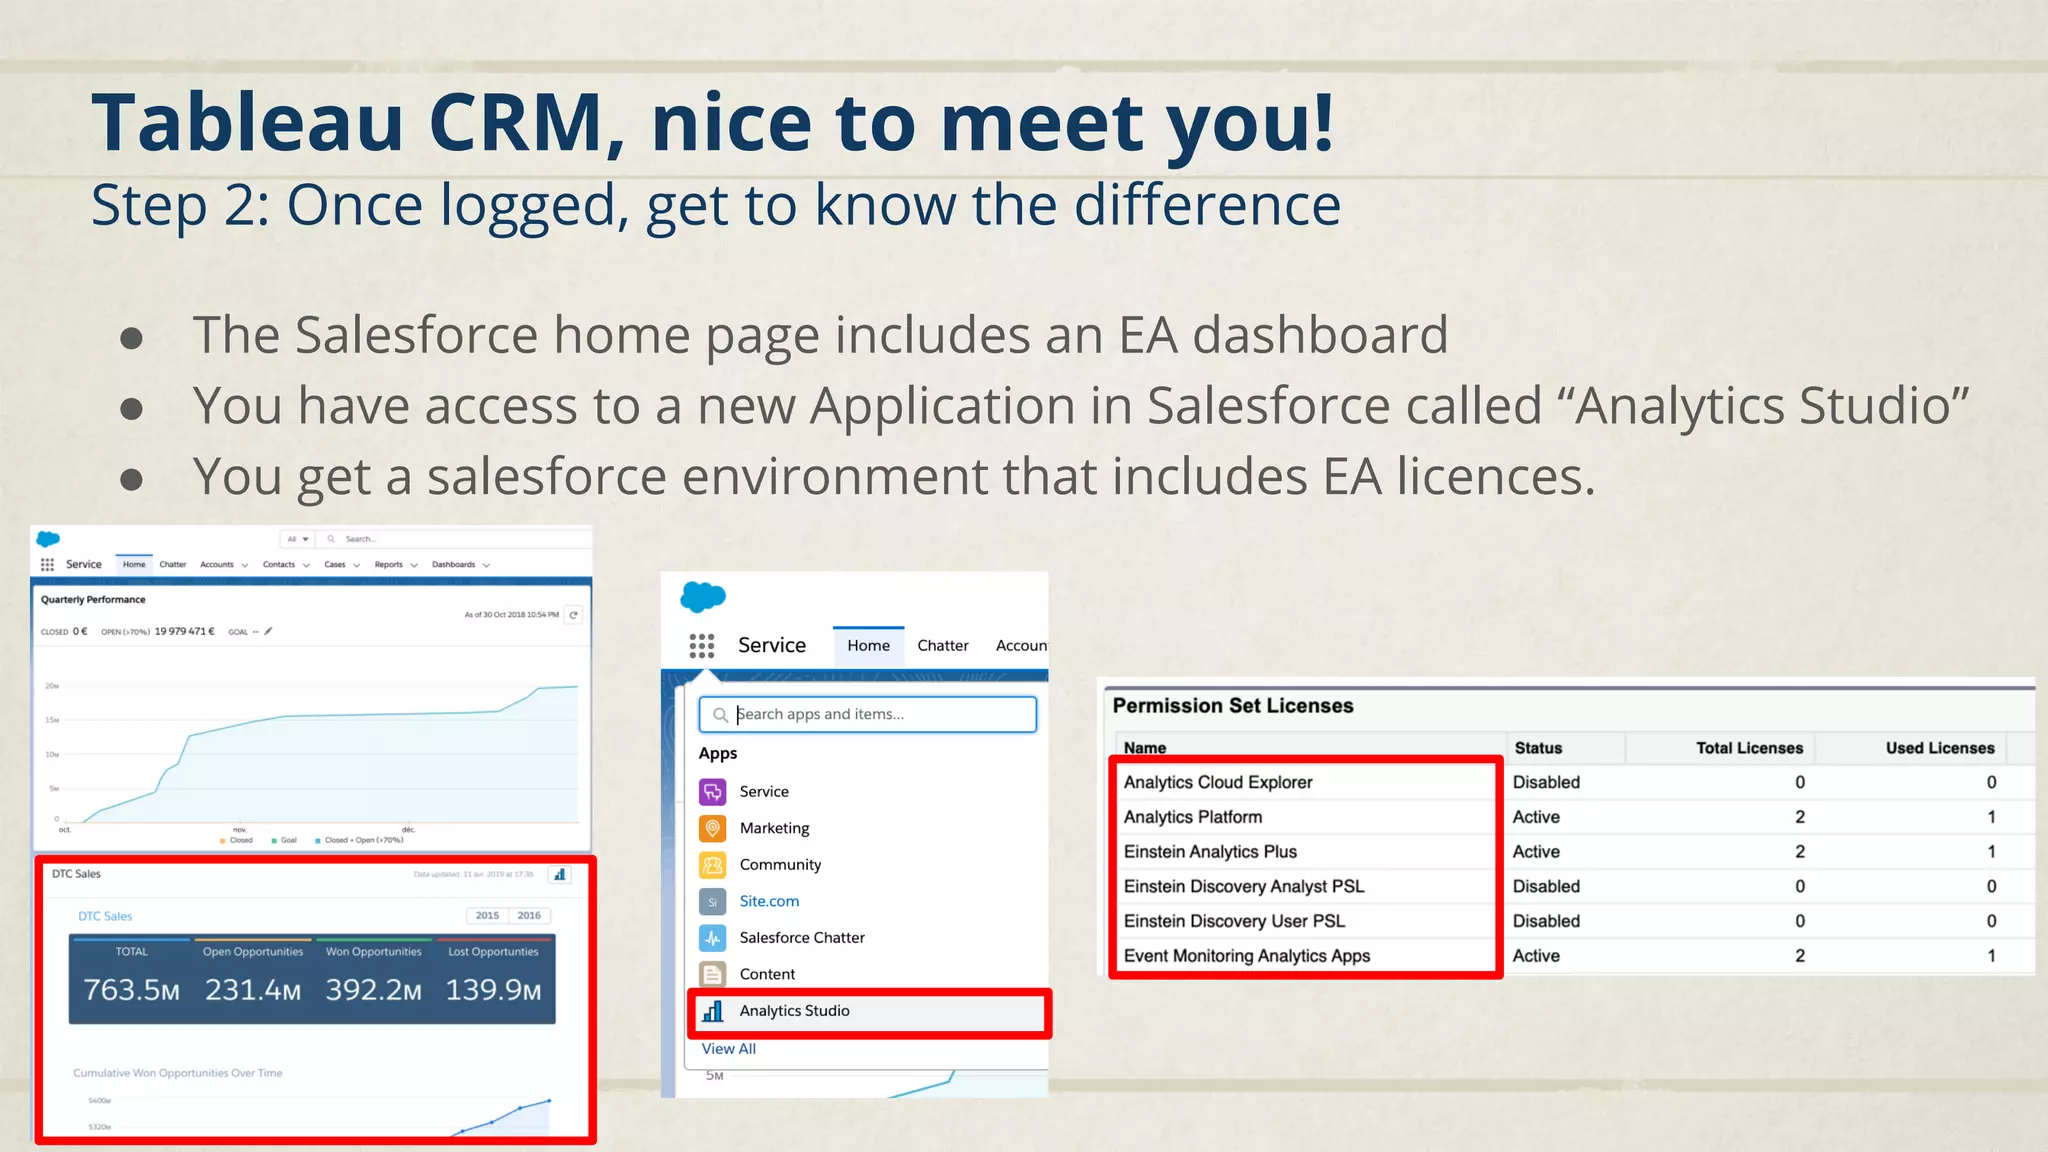
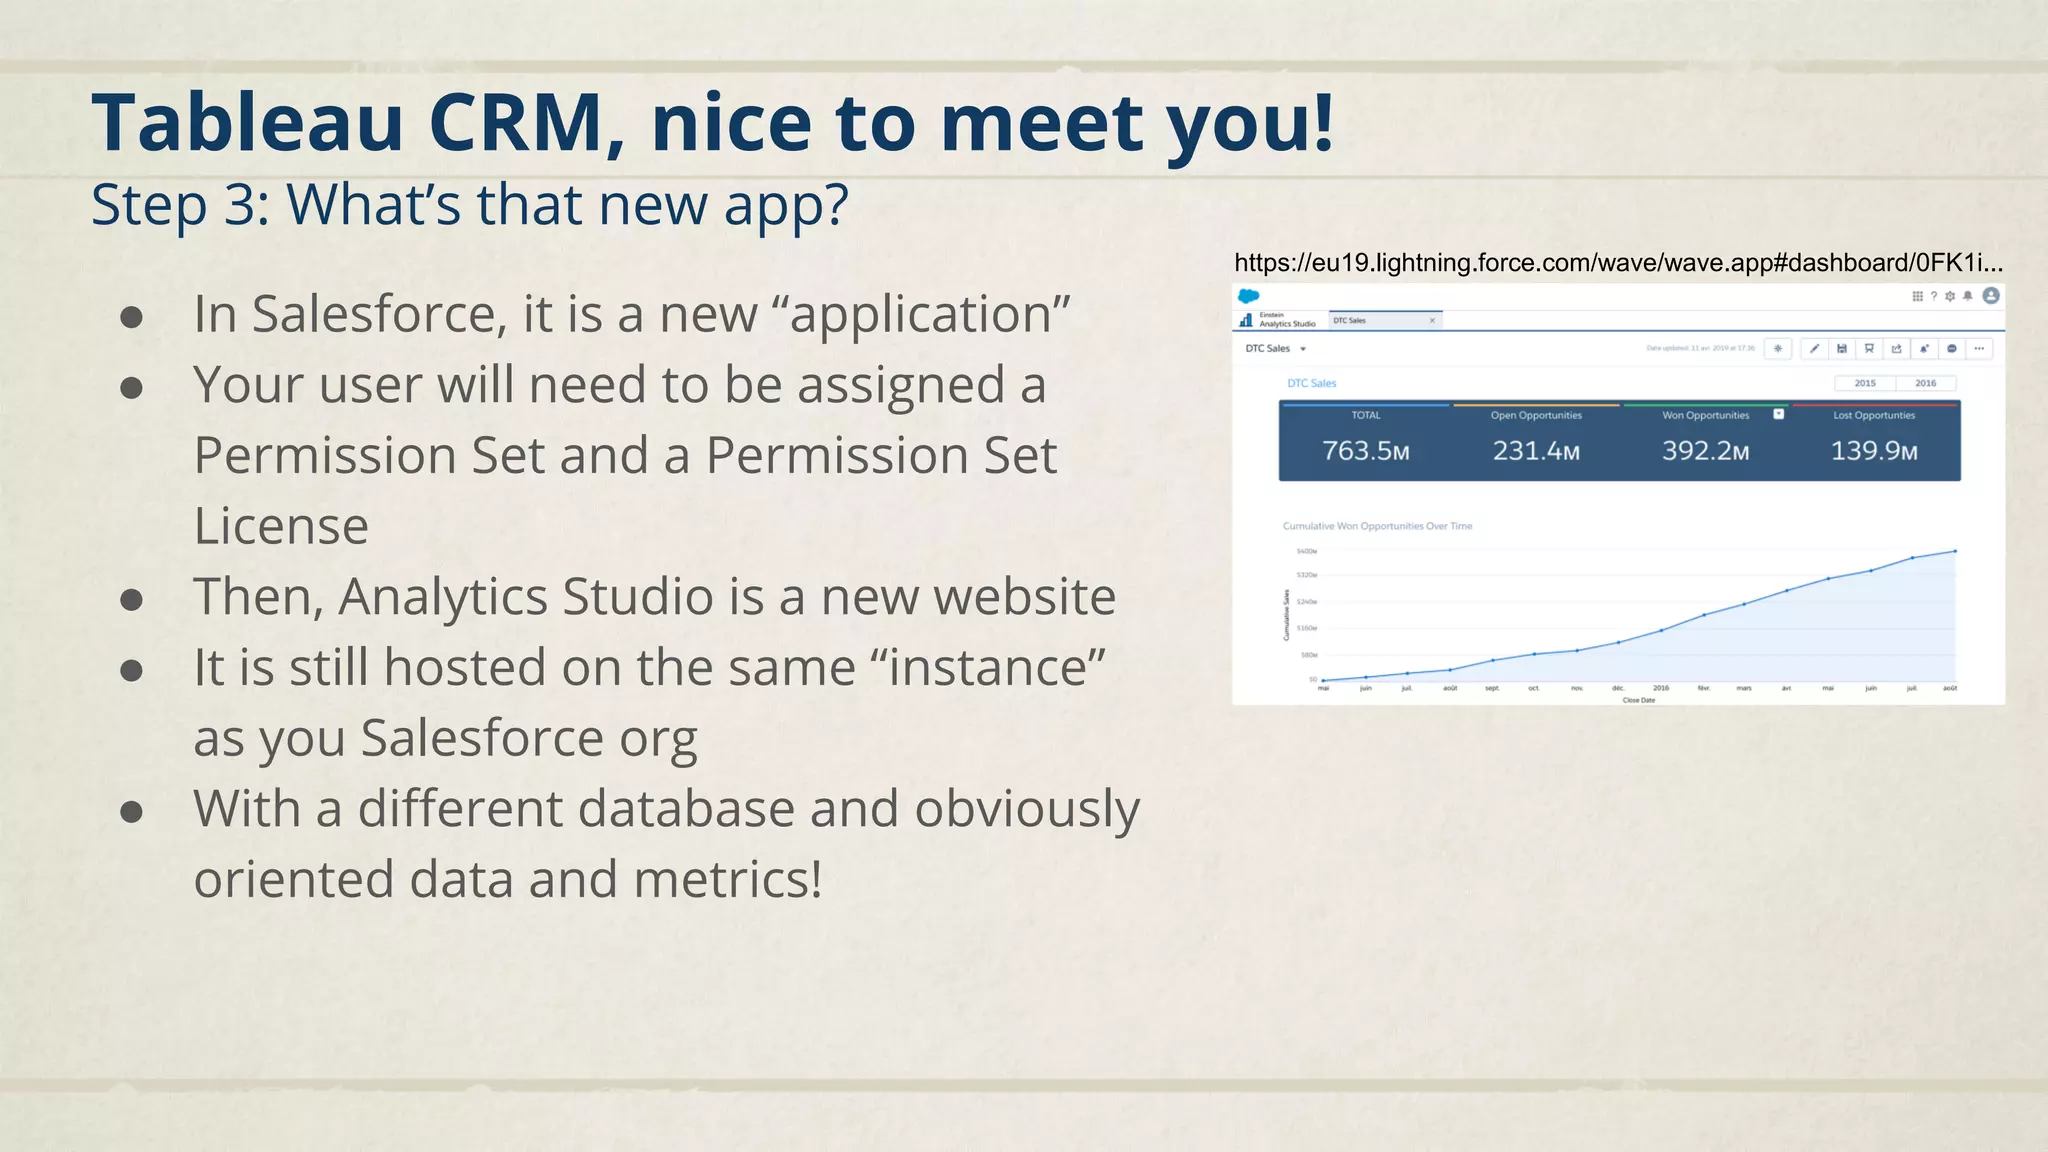


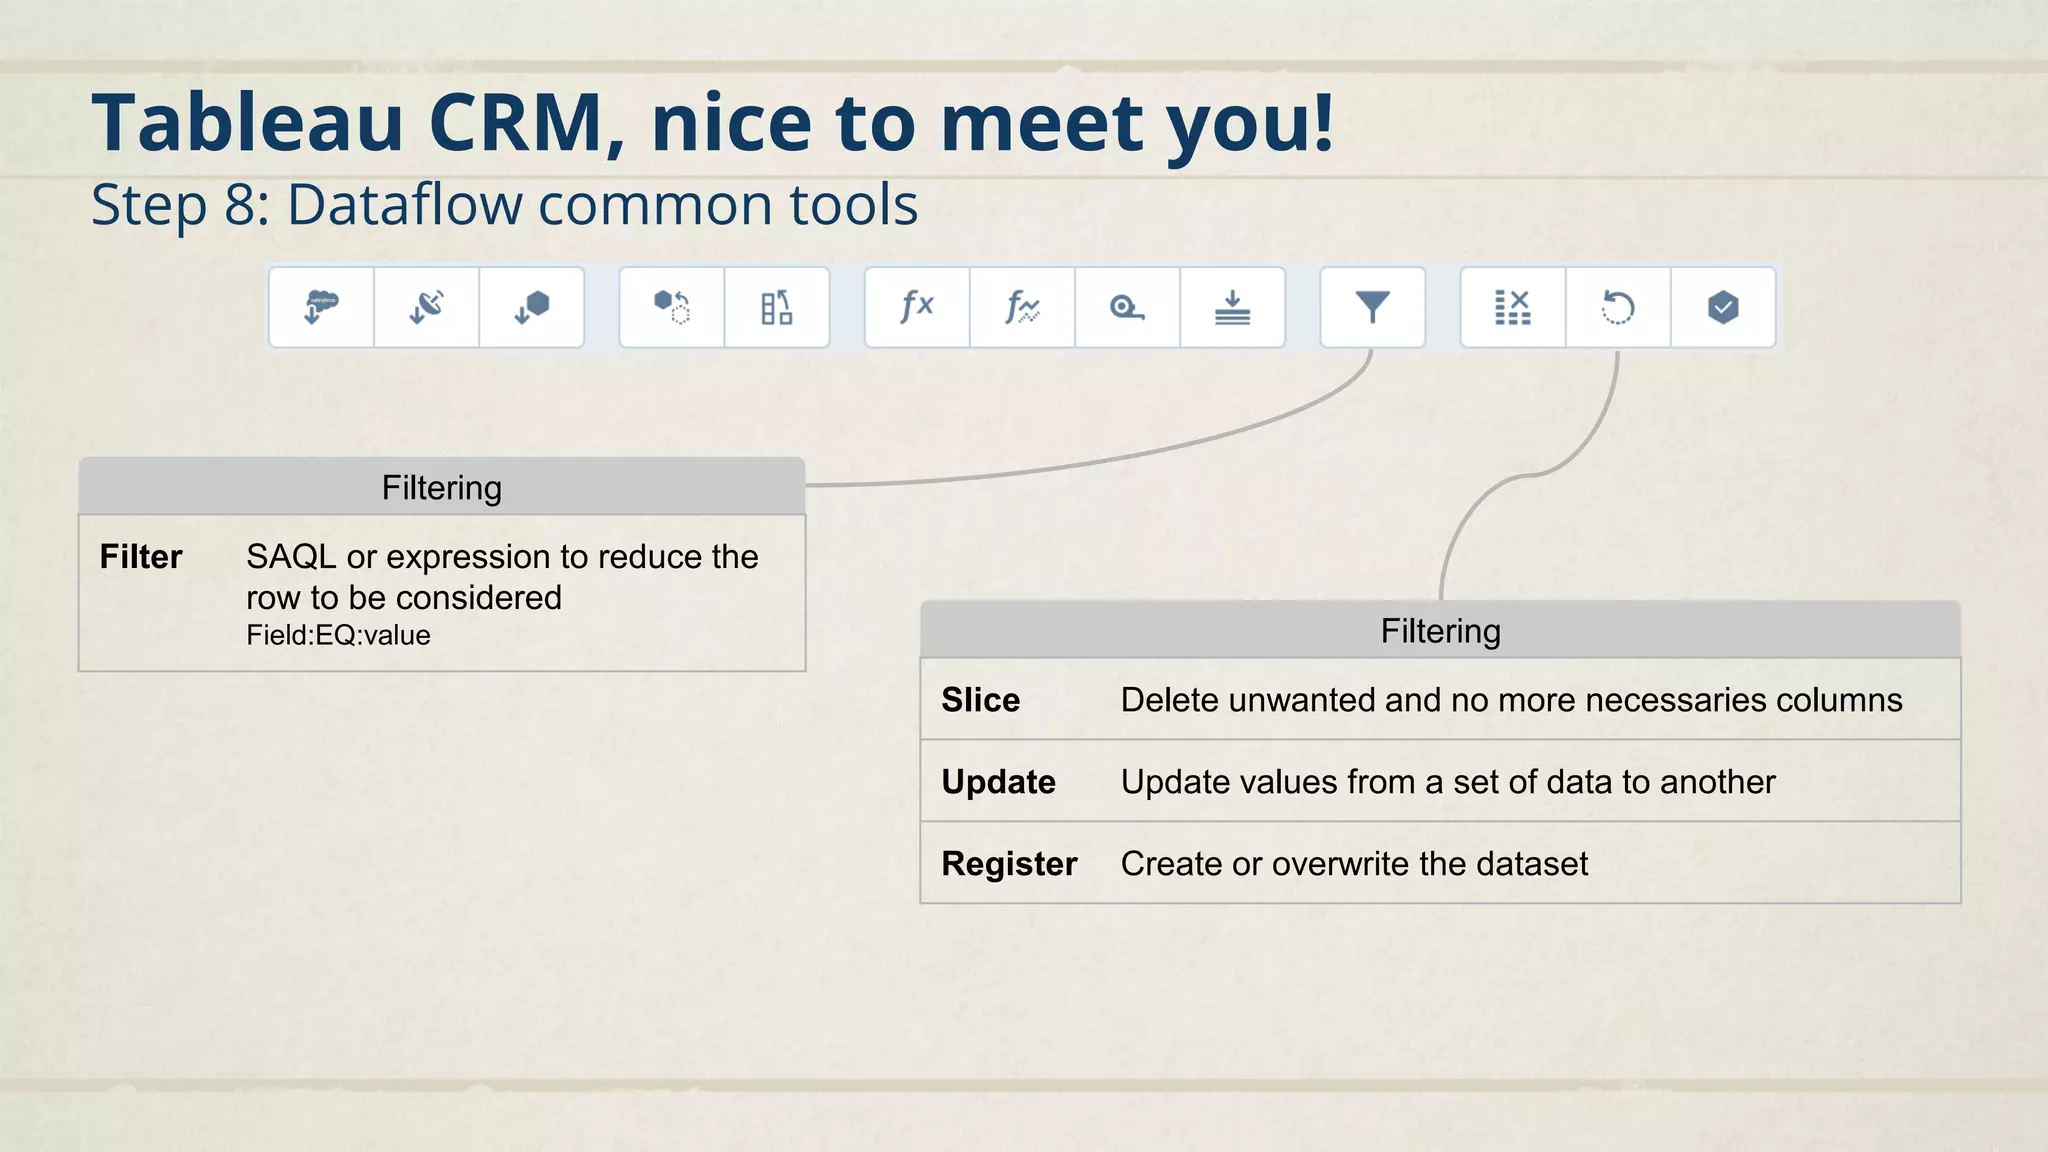

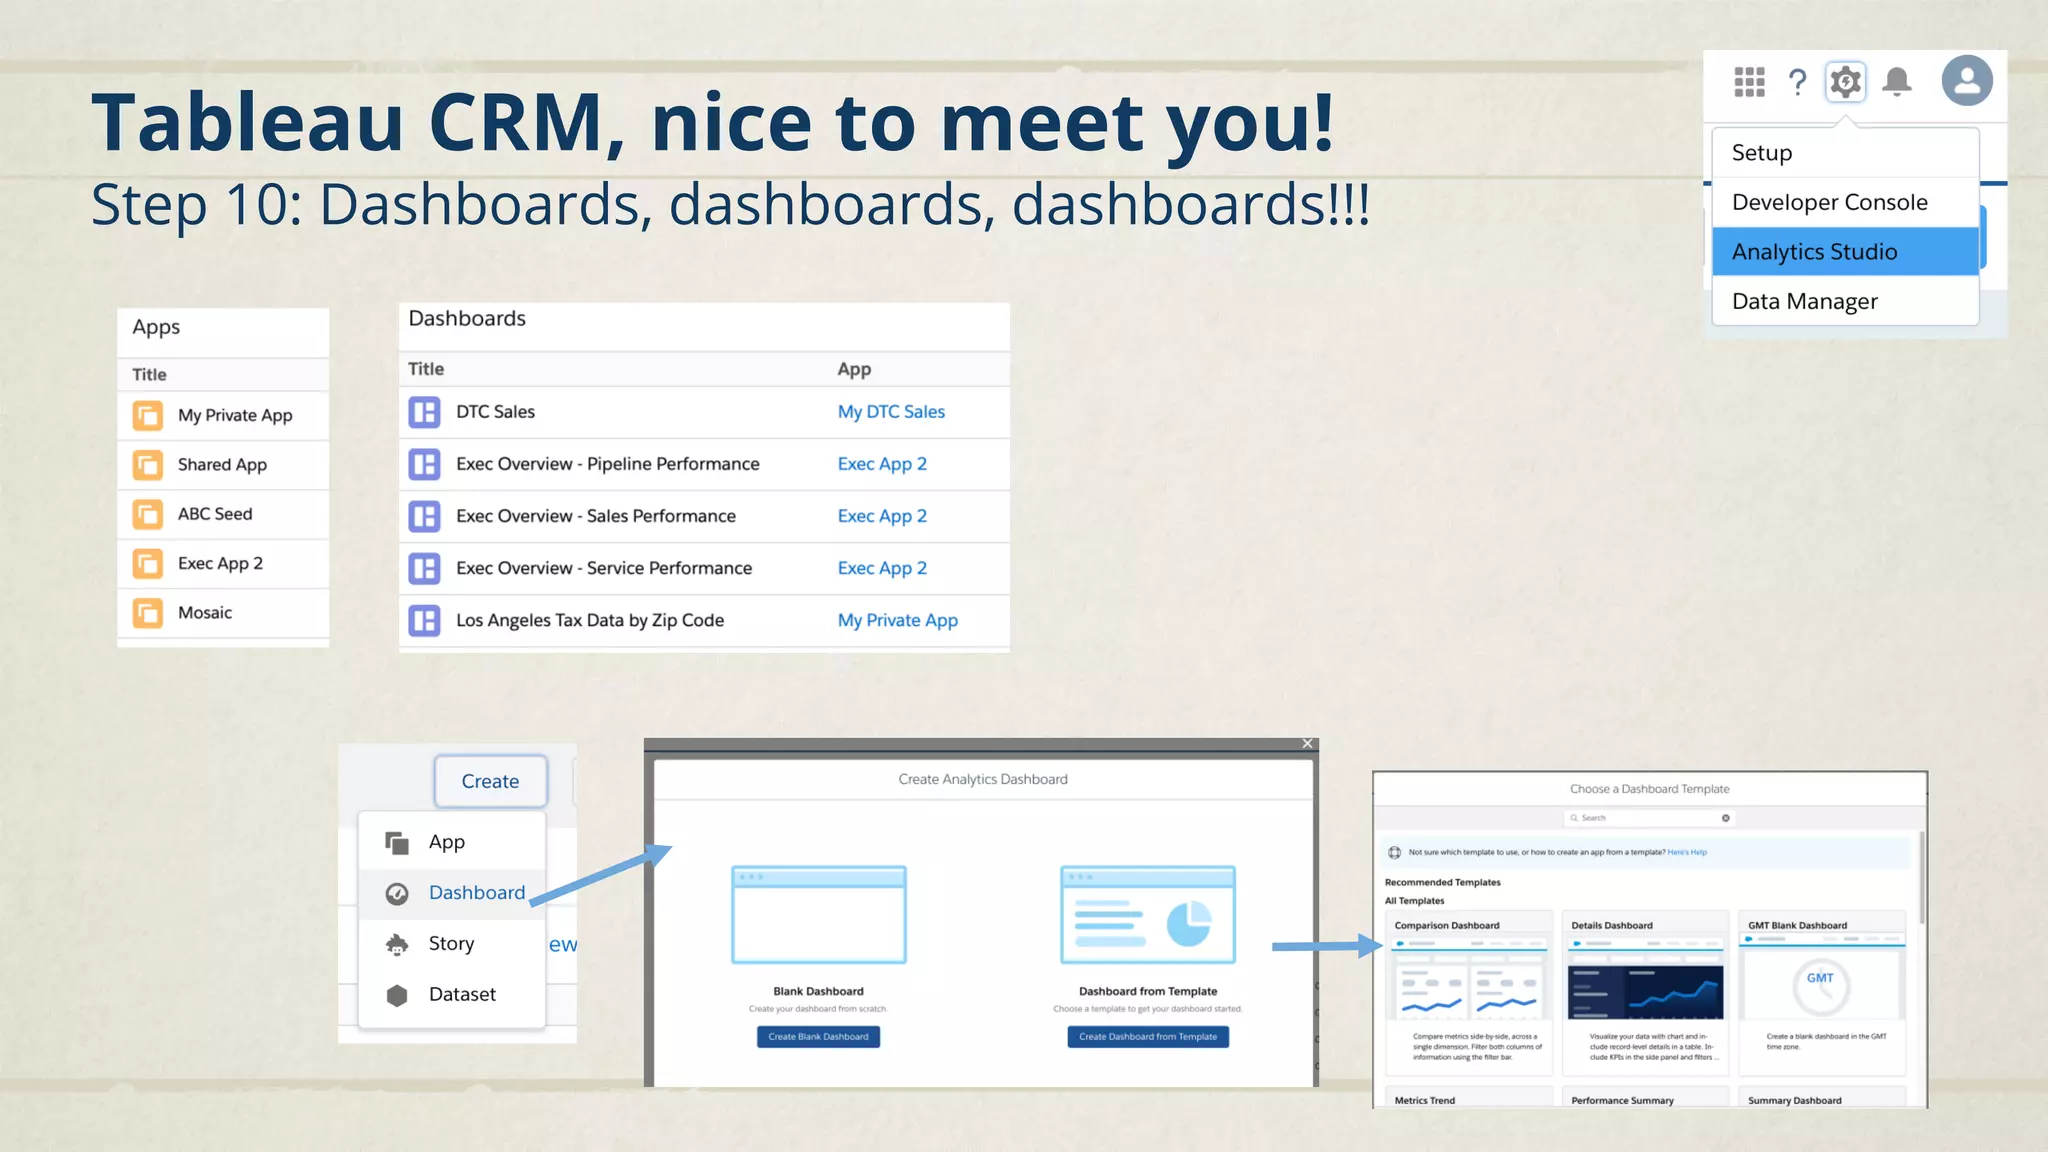


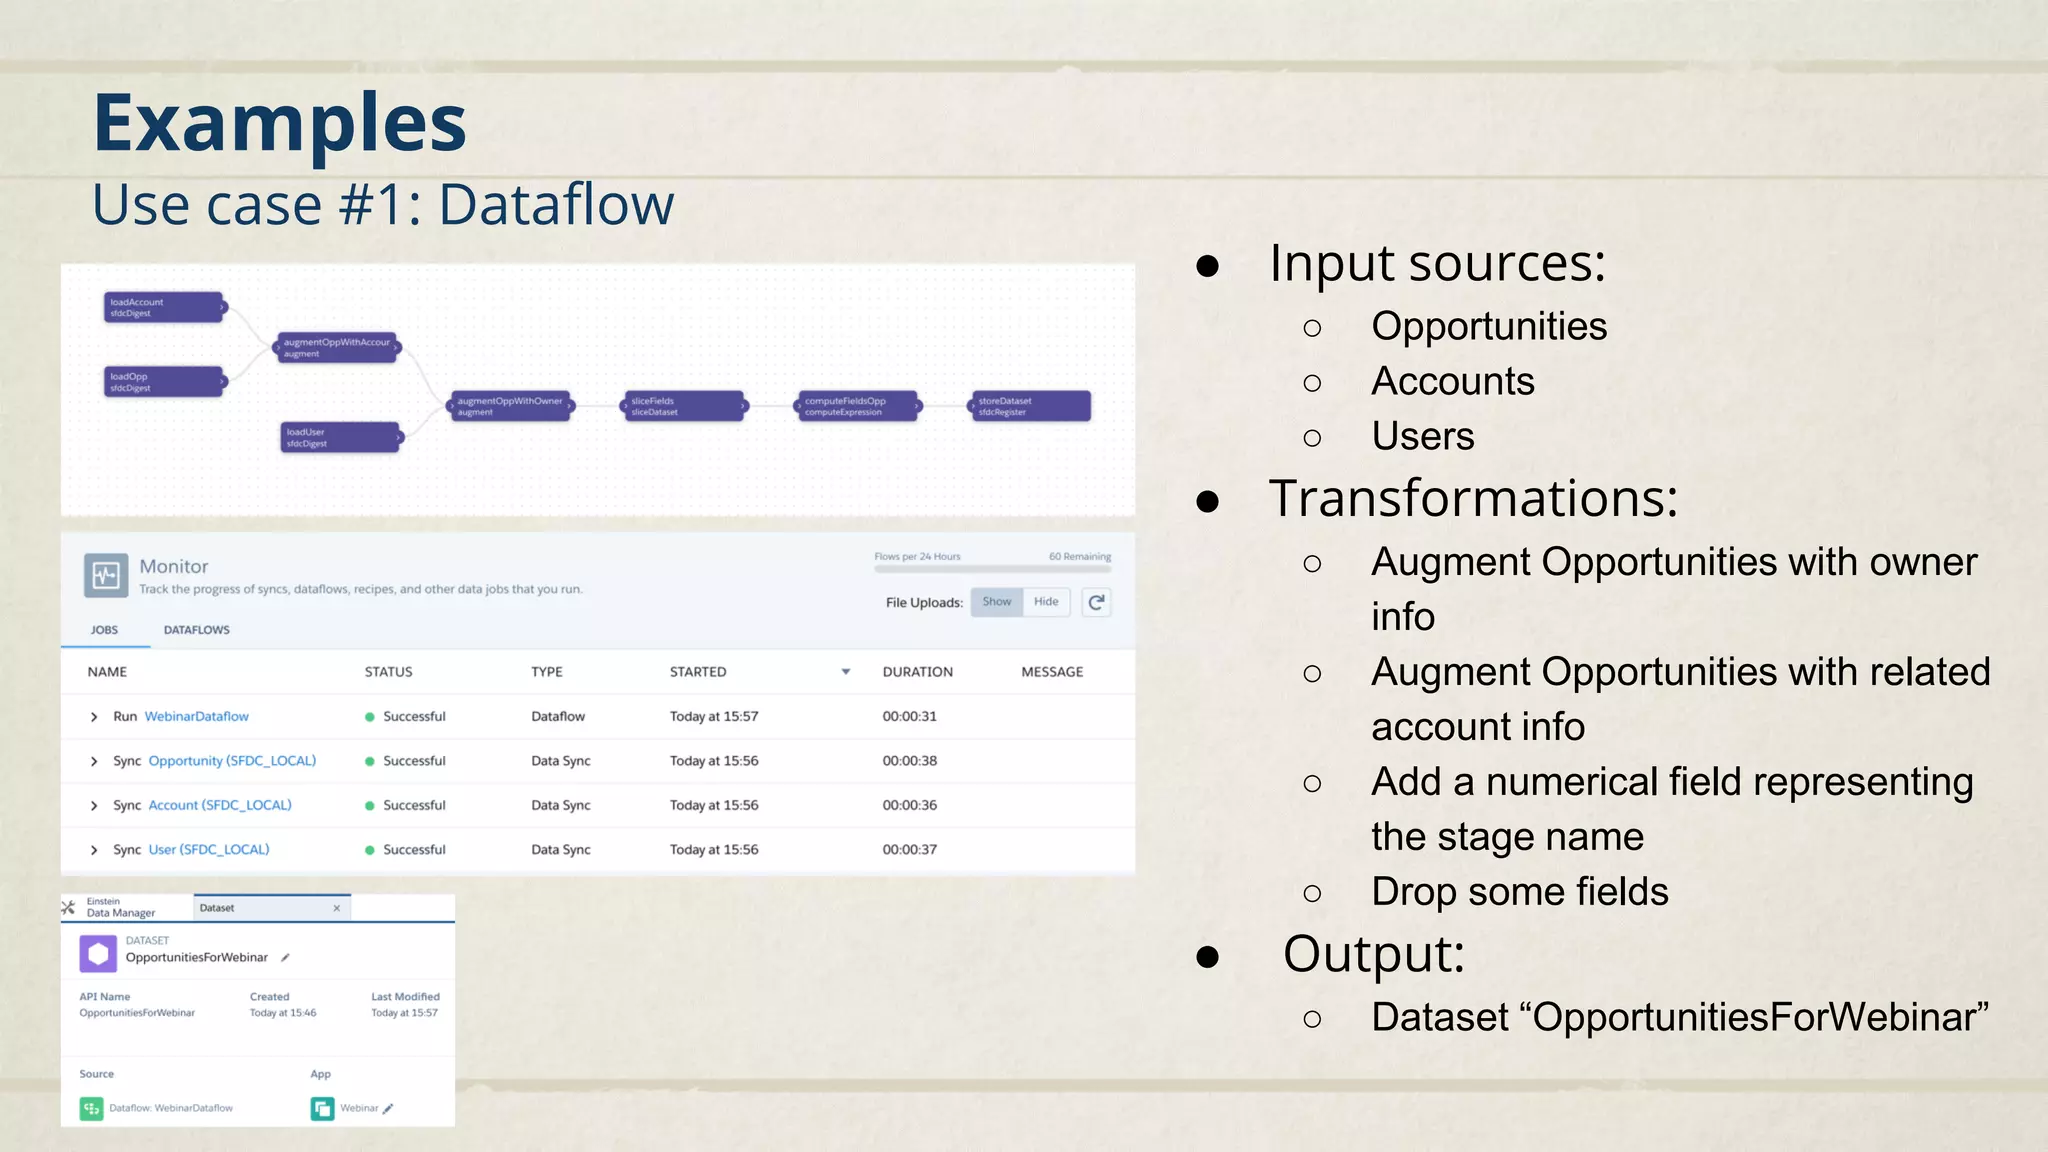

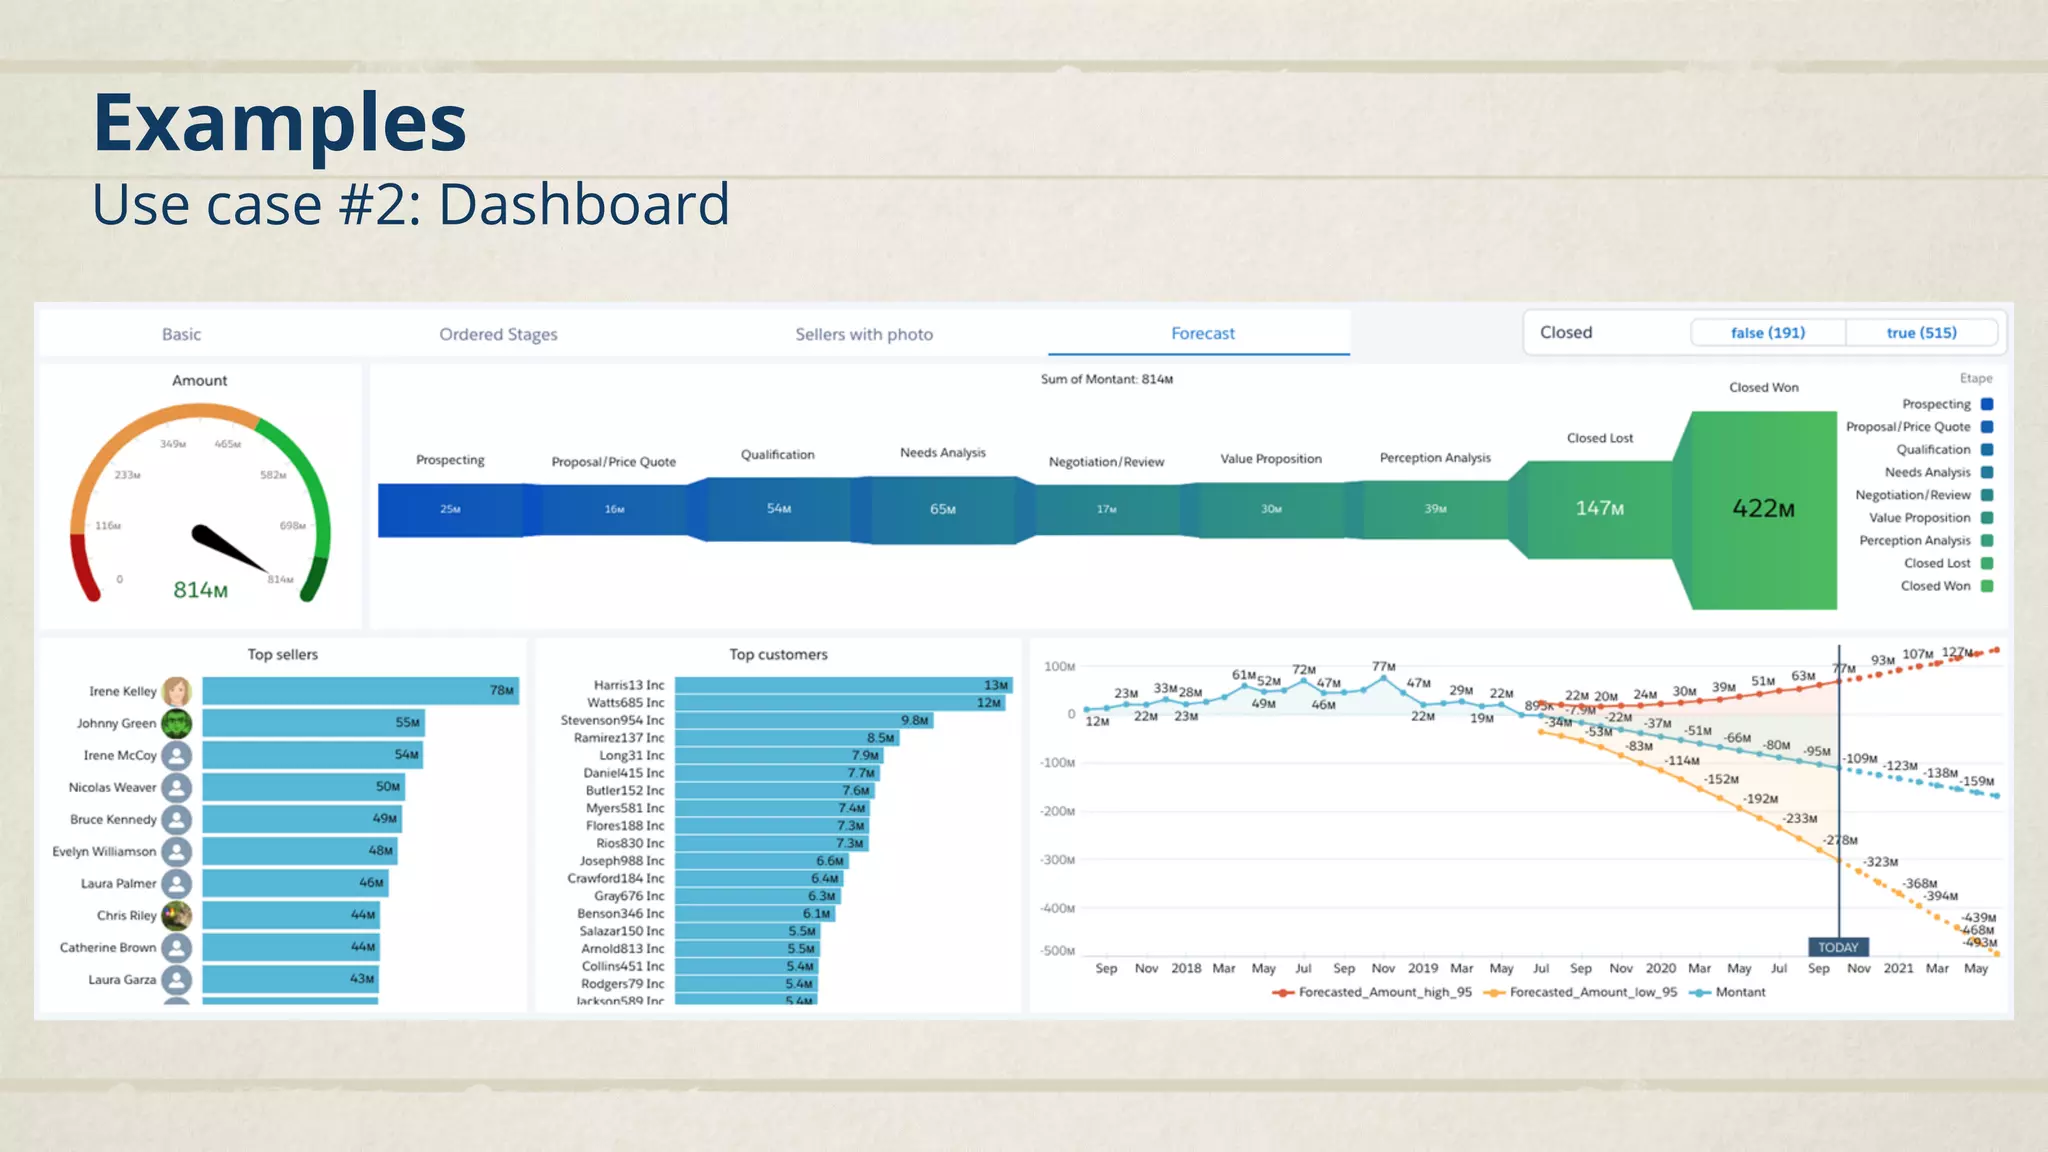

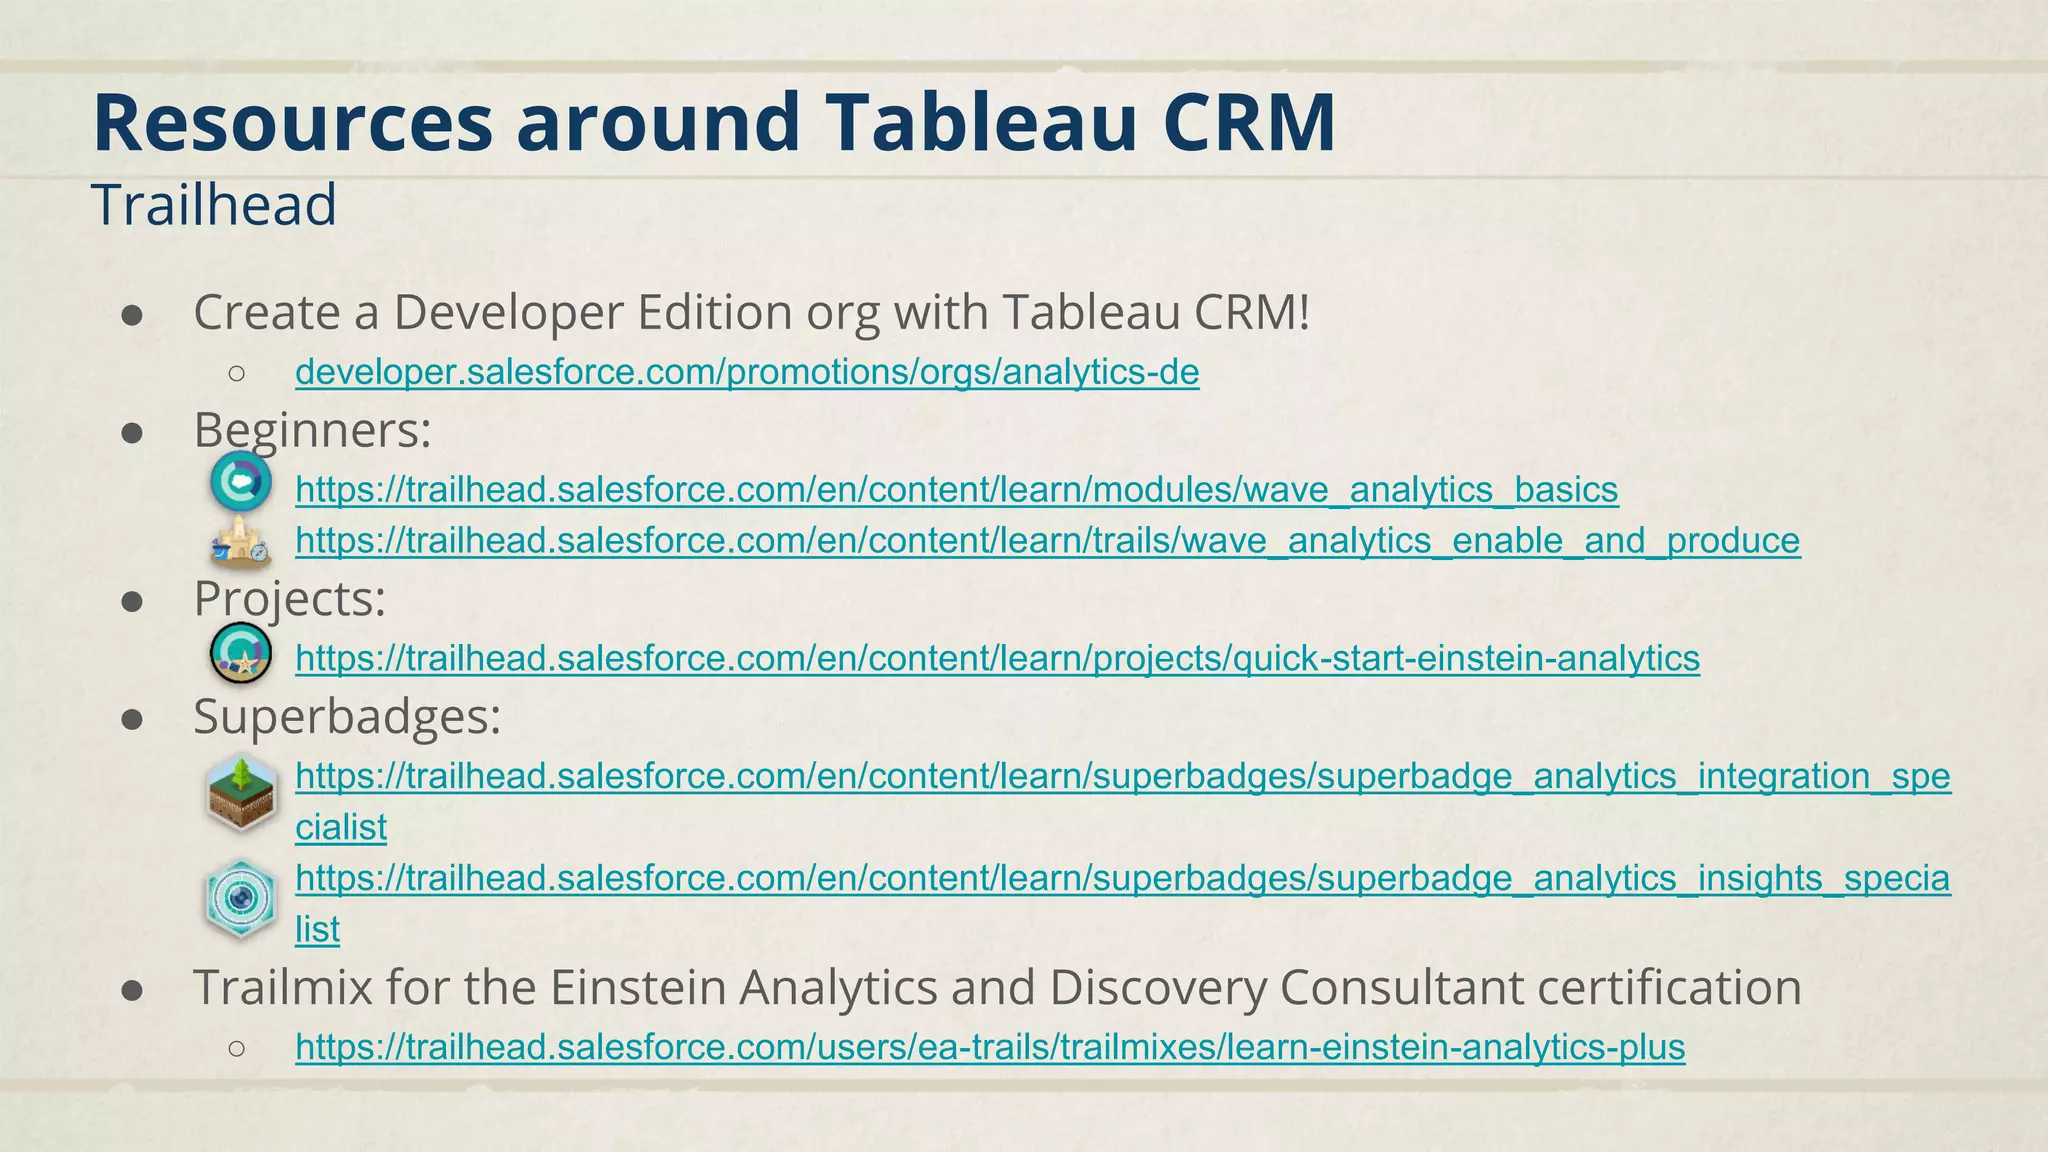


This document provides an introduction to Tableau CRM for Salesforce. It outlines 11 steps to get started with Tableau CRM, including creating a developer edition org, understanding the differences between Salesforce and Tableau CRM, exploring data sources and replications, creating datasets using recipes and dataflows, building dashboards, and important considerations around security and users. Examples of a dataflow transformation and dashboard are provided. Resources for learning more about Tableau CRM through Trailhead and blogs are also listed.