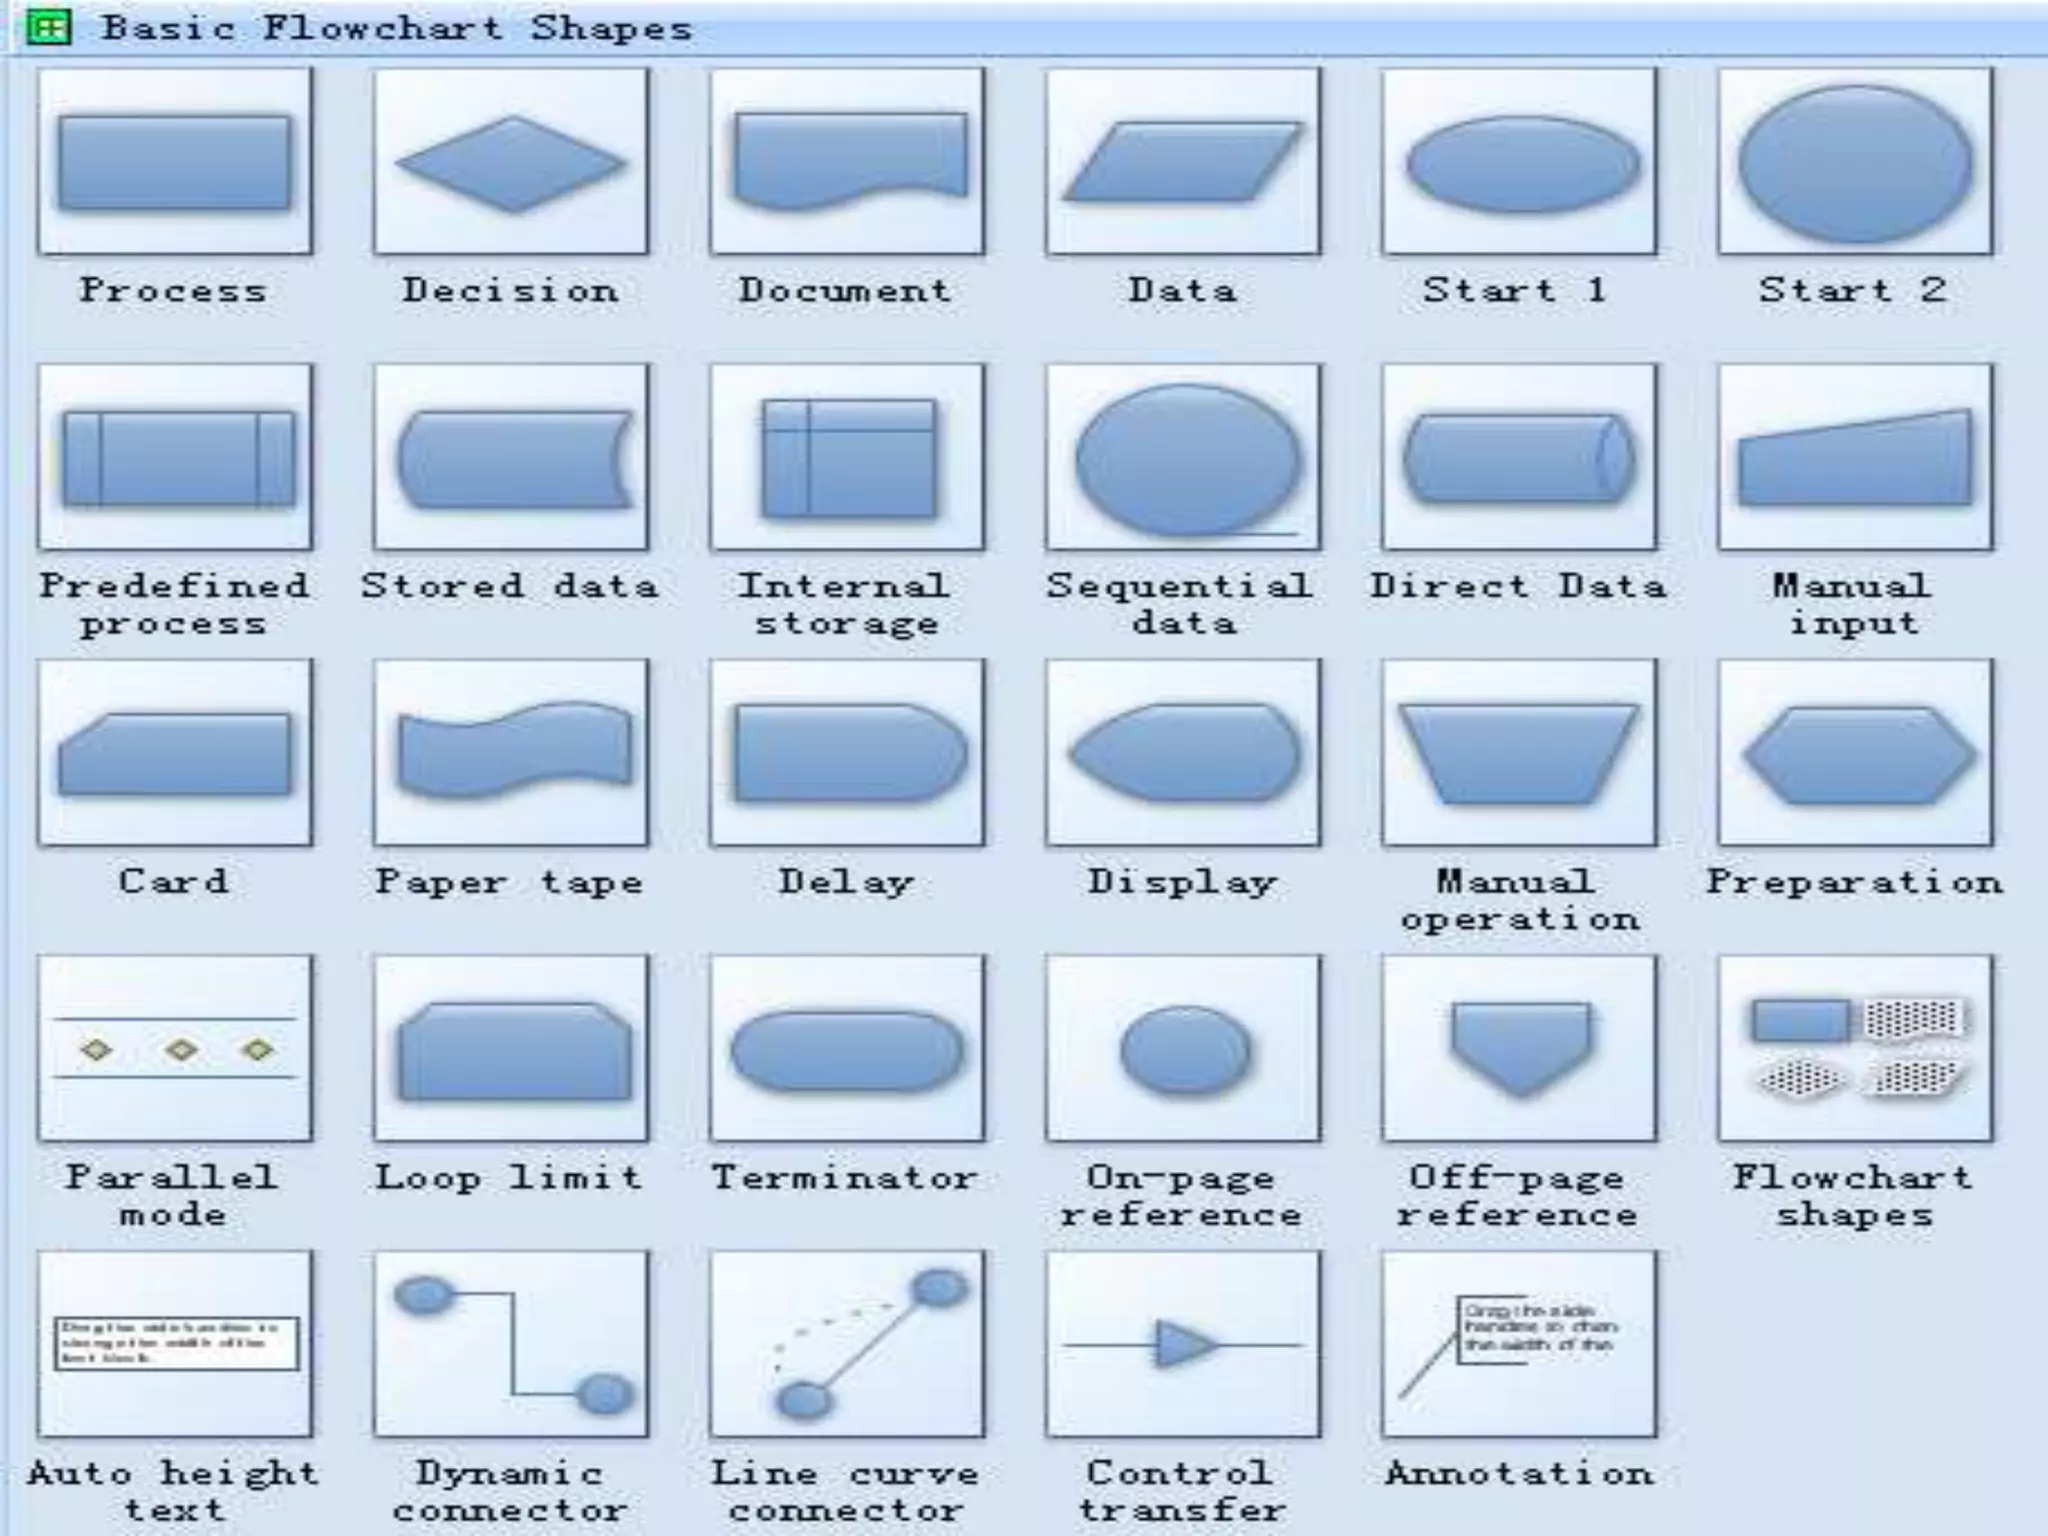
A flowchart is a diagram that represents a process or system. It uses standard symbols to show the steps in a process and their order. Flowcharts help communicate processes between teams and identify areas for improvement. There are different types of flowcharts for different purposes, such as basic flowcharts for work processes, data flow diagrams for information processes, and program flowcharts for algorithms. Flowcharts should be created through group discussion to ensure all steps are captured.
Check out this guide for flowchart symbols meaning explained. If you need to know which flowchart symbols to use, all standard shapes and their definitions are explained on this page.
I have attached here PPT of Flow Chart. By using the PPT, students will design any Flow Chart which is a diagrammatic representation of an algorithm, a step-by-step approach to solving a task. . The PPT is mainly focus on "how to design Flow Chart".
ppt on flow chart by harshid panchal with help of Sejal ma'm (git.org.in)harshid panchal
this is the simple power point presentation on flowchart
made by me harshid panchal with the help of my fav. ma'm sejal bhavsar . and we are from gandhinagar institute of technology(git.org.in)
if u have any query then contact me on harshidpanchalhp@gmail.com or you can also contact my ma'm on sejal.bhavsar@git.org.in
a diagram of the sequence of movements or actions of people or things involved in a complex system or activity.
a graphical representation of a computer program in relation to its sequence of functions (as distinct from the data it processes).
It is a powerpoint presentation that discusses about the lesson or topic: Graphic Organizers. It also includes the definition and types of the Graphic Organizers.
Flow charting on college admission processshivani jindal
the project flowcharting is the practical application of understanding the concept of flow chart and help u to know how to make micro and macro flowchart of college admission process
This was the project given to us in qimpro championship league. This presentation is all about flowchart and includes macro and micro flowcharts of the admission process.
Learn to identify parts of a computer, hardware and software, operate the mouse and keyboard and become familiar with the MS Windows X/P Operating System.
A Presentation on the flowcharts with reference to the admission procedure in banasthali vidyapeeth,a popular university,in rajasthan.
submitted by rashi and twinkle singhal.
Palestine last event orientationfvgnh .pptxRaedMohamed3
An EFL lesson about the current events in Palestine. It is intended to be for intermediate students who wish to increase their listening skills through a short lesson in power point.
The French Revolution, which began in 1789, was a period of radical social and political upheaval in France. It marked the decline of absolute monarchies, the rise of secular and democratic republics, and the eventual rise of Napoleon Bonaparte. This revolutionary period is crucial in understanding the transition from feudalism to modernity in Europe.
For more information, visit-www.vavaclasses.com
June 3, 2024 Anti-Semitism Letter Sent to MIT President Kornbluth and MIT Cor...Levi Shapiro
Letter from the Congress of the United States regarding Anti-Semitism sent June 3rd to MIT President Sally Kornbluth, MIT Corp Chair, Mark Gorenberg
Dear Dr. Kornbluth and Mr. Gorenberg,
The US House of Representatives is deeply concerned by ongoing and pervasive acts of antisemitic
harassment and intimidation at the Massachusetts Institute of Technology (MIT). Failing to act decisively to ensure a safe learning environment for all students would be a grave dereliction of your responsibilities as President of MIT and Chair of the MIT Corporation.
This Congress will not stand idly by and allow an environment hostile to Jewish students to persist. The House believes that your institution is in violation of Title VI of the Civil Rights Act, and the inability or
unwillingness to rectify this violation through action requires accountability.
Postsecondary education is a unique opportunity for students to learn and have their ideas and beliefs challenged. However, universities receiving hundreds of millions of federal funds annually have denied
students that opportunity and have been hijacked to become venues for the promotion of terrorism, antisemitic harassment and intimidation, unlawful encampments, and in some cases, assaults and riots.
The House of Representatives will not countenance the use of federal funds to indoctrinate students into hateful, antisemitic, anti-American supporters of terrorism. Investigations into campus antisemitism by the Committee on Education and the Workforce and the Committee on Ways and Means have been expanded into a Congress-wide probe across all relevant jurisdictions to address this national crisis. The undersigned Committees will conduct oversight into the use of federal funds at MIT and its learning environment under authorities granted to each Committee.
• The Committee on Education and the Workforce has been investigating your institution since December 7, 2023. The Committee has broad jurisdiction over postsecondary education, including its compliance with Title VI of the Civil Rights Act, campus safety concerns over disruptions to the learning environment, and the awarding of federal student aid under the Higher Education Act.
• The Committee on Oversight and Accountability is investigating the sources of funding and other support flowing to groups espousing pro-Hamas propaganda and engaged in antisemitic harassment and intimidation of students. The Committee on Oversight and Accountability is the principal oversight committee of the US House of Representatives and has broad authority to investigate “any matter” at “any time” under House Rule X.
• The Committee on Ways and Means has been investigating several universities since November 15, 2023, when the Committee held a hearing entitled From Ivory Towers to Dark Corners: Investigating the Nexus Between Antisemitism, Tax-Exempt Universities, and Terror Financing. The Committee followed the hearing with letters to those institutions on January 10, 202
Macroeconomics- Movie Location
This will be used as part of your Personal Professional Portfolio once graded.
Objective:
Prepare a presentation or a paper using research, basic comparative analysis, data organization and application of economic information. You will make an informed assessment of an economic climate outside of the United States to accomplish an entertainment industry objective.
Introduction to AI for Nonprofits with Tapp NetworkTechSoup
Dive into the world of AI! Experts Jon Hill and Tareq Monaur will guide you through AI's role in enhancing nonprofit websites and basic marketing strategies, making it easy to understand and apply.
Welcome to TechSoup New Member Orientation and Q&A (May 2024).pdfTechSoup
In this webinar you will learn how your organization can access TechSoup's wide variety of product discount and donation programs. From hardware to software, we'll give you a tour of the tools available to help your nonprofit with productivity, collaboration, financial management, donor tracking, security, and more.
The Roman Empire A Historical Colossus.pdfkaushalkr1407
The Roman Empire, a vast and enduring power, stands as one of history's most remarkable civilizations, leaving an indelible imprint on the world. It emerged from the Roman Republic, transitioning into an imperial powerhouse under the leadership of Augustus Caesar in 27 BCE. This transformation marked the beginning of an era defined by unprecedented territorial expansion, architectural marvels, and profound cultural influence.
The empire's roots lie in the city of Rome, founded, according to legend, by Romulus in 753 BCE. Over centuries, Rome evolved from a small settlement to a formidable republic, characterized by a complex political system with elected officials and checks on power. However, internal strife, class conflicts, and military ambitions paved the way for the end of the Republic. Julius Caesar’s dictatorship and subsequent assassination in 44 BCE created a power vacuum, leading to a civil war. Octavian, later Augustus, emerged victorious, heralding the Roman Empire’s birth.
Under Augustus, the empire experienced the Pax Romana, a 200-year period of relative peace and stability. Augustus reformed the military, established efficient administrative systems, and initiated grand construction projects. The empire's borders expanded, encompassing territories from Britain to Egypt and from Spain to the Euphrates. Roman legions, renowned for their discipline and engineering prowess, secured and maintained these vast territories, building roads, fortifications, and cities that facilitated control and integration.
The Roman Empire’s society was hierarchical, with a rigid class system. At the top were the patricians, wealthy elites who held significant political power. Below them were the plebeians, free citizens with limited political influence, and the vast numbers of slaves who formed the backbone of the economy. The family unit was central, governed by the paterfamilias, the male head who held absolute authority.
Culturally, the Romans were eclectic, absorbing and adapting elements from the civilizations they encountered, particularly the Greeks. Roman art, literature, and philosophy reflected this synthesis, creating a rich cultural tapestry. Latin, the Roman language, became the lingua franca of the Western world, influencing numerous modern languages.
Roman architecture and engineering achievements were monumental. They perfected the arch, vault, and dome, constructing enduring structures like the Colosseum, Pantheon, and aqueducts. These engineering marvels not only showcased Roman ingenuity but also served practical purposes, from public entertainment to water supply.
2024.06.01 Introducing a competency framework for languag learning materials ...Sandy Millin
http://sandymillin.wordpress.com/iateflwebinar2024
Published classroom materials form the basis of syllabuses, drive teacher professional development, and have a potentially huge influence on learners, teachers and education systems. All teachers also create their own materials, whether a few sentences on a blackboard, a highly-structured fully-realised online course, or anything in between. Despite this, the knowledge and skills needed to create effective language learning materials are rarely part of teacher training, and are mostly learnt by trial and error.
Knowledge and skills frameworks, generally called competency frameworks, for ELT teachers, trainers and managers have existed for a few years now. However, until I created one for my MA dissertation, there wasn’t one drawing together what we need to know and do to be able to effectively produce language learning materials.
This webinar will introduce you to my framework, highlighting the key competencies I identified from my research. It will also show how anybody involved in language teaching (any language, not just English!), teacher training, managing schools or developing language learning materials can benefit from using the framework.
A Strategic Approach: GenAI in EducationPeter Windle
Artificial Intelligence (AI) technologies such as Generative AI, Image Generators and Large Language Models have had a dramatic impact on teaching, learning and assessment over the past 18 months. The most immediate threat AI posed was to Academic Integrity with Higher Education Institutes (HEIs) focusing their efforts on combating the use of GenAI in assessment. Guidelines were developed for staff and students, policies put in place too. Innovative educators have forged paths in the use of Generative AI for teaching, learning and assessments leading to pockets of transformation springing up across HEIs, often with little or no top-down guidance, support or direction.
This Gasta posits a strategic approach to integrating AI into HEIs to prepare staff, students and the curriculum for an evolving world and workplace. We will highlight the advantages of working with these technologies beyond the realm of teaching, learning and assessment by considering prompt engineering skills, industry impact, curriculum changes, and the need for staff upskilling. In contrast, not engaging strategically with Generative AI poses risks, including falling behind peers, missed opportunities and failing to ensure our graduates remain employable. The rapid evolution of AI technologies necessitates a proactive and strategic approach if we are to remain relevant.
2. FLOW CHART DEFINITION
A flowchart is a graphic representation of how a process works,
showing, at a minimum, the sequence of steps.
3. WHAT IS FLOWCHART
Several types of flowcharts exist: the most simple (high level, a detailed
version (detailed, and one that also indicates the people involved in the
steps (or matrix).
The flowchart is a means to visually present the flow of data through
an information processing systems, the operations performed within the
system and the sequence in which they are performed. In this lesson, we
shall concern ourselves with the program flowchart, which describes what
operations (and in what sequence) are required to solve a given problem.
The program flowchart can be likened to the blueprint of a building. As
we know, a designer draws a blueprint before starting to construct a
building. Similarly, a programmer prefers to draw a flowchart prior to
writing a computer program. As in the case of the drawing of a blueprint,
the flowchart is drawn according to defined rules and using standard
flowchart symbols prescribed by the American National Standard
Institute, Inc.
4. MEANING OF A FLOW CHART
A flowchart is a diagrammatic representation that illustrates the sequence of
operations to be performed to get the solution of a problem. Flowcharts
are generally drawn in the early stages of formulating computer solutions.
Flowcharts facilitate communication between programmers and business
people. These flowcharts play a vital role in the programming of a
problem and are quite helpful in understanding the logic of complicated
and lengthy problems. Once the flowchart is drawn, it becomes easy to
write the program in any high level language. Often we see how
flowcharts are helpful in explaining the program to others. Hence, it is
correct to say that a flowchart is a must for the better documentation of
a complex program.
5. • Flow is a representation of a series of logic operations to satisfy specific
requirements. A flow exists naturally. It can be irregular, unfixed or full of
problems. For this reason, it may apparently be absent in some
situations. Lately, members of a team were assigned to investigate the
flow of a business process, and I was told that there were some
deficiencies in the flow. The reply from the person who was in charge of
the team was that no flow was shown in part of the business process. As a
matter of fact, it is impossible for a business carried out without a flow. It
may be a flow in an unfixed form, or, may be the person himself whom you
investigated does not have a clear sense about the flow.
• Chart, or diagram, is a presentation or a written description of some
regular and common parts of the flow. A chart is conducive to
communication and concentration and offers references for process
reengineering.
• Flow chart can be seen from the definition that a flow accompanies always
with business or transaction. Not all of the flows, however, are
appropriate to be expressed by flowcharts. Flows that can be expressed
by charts follow some fixed routines, and the key links of flows won't be
changed constantly.
6. WHEN TO USE FLOW CHART
A flowchart helps to clarify how things are currently working and how they
could be improved. It also assists in finding the key elements of a
process, while drawing clear lines between where one process ends and
the next one starts. Developing a flowchart stimulates communication
among participants and establishes a common understanding about the
process.
Flowcharts also uncover steps that are redundant or misplaced. In addition,
flowcharts are used to identify appropriate team members, to identify who
provides inputs or resources to whom, to establish important areas for
monitoring or data collection, to identify areas for improvement or
increased efficiency, and to generate hypotheses about causes.
Flowcharts can be used to examine processes for the flow of patients,
information, materials, clinical care, or combinations of these processes.
It is recommended that flowcharts be created through group discussion,
as individuals rarely know the entire process and the communication
contributes to improvement.
7. TYPES OF FLOWCHARTS
Basic Flowchart is often used to define and document basic work and data
flows, financial, production and quality management processes to increase
efficiency of you business.
Business Process Modeling Diagram is a graphical representation for
specifying business processes in a workflow.
Process Flowchart is also known as the system flow diagram or SFD. The
main reason of using process flowchart is to show the relation between
major parts of the system.
Cross Functional Flowchart is often used to show the relationship between a
business process and the functional units (such as departments)
responsible for that process.
8. Procedure Flowchart involves creating a flow chart model that illustrates and
analyzes the overall flow of activities in producing a product or service.
Data Flow Diagram is a significant modeling technique for analyzing and
constructing information processes.
IDEF Flowchart is used to apply structured methods to better understand
how to improve manufacturing productivity.
IDEF2 is often used to represent the time varying behavior of resources in a
manufacturing system, providing a framework for specification of math
model-based simulations.
List is used to draw commonly used list, block list, picture list and table list.
Process is used to show a progression or sequential steps in a task, process
or workflow.
9. SDL Diagram is widely used to model state machines in the
telecommunications, aviation, automotive and medical industries.
Program Flowchart is a graphic representation of an algorithm, often used in
the design phase of programming to work out the logical flow of a
program. It demonstrates how a program works within a system.
Workflow Diagram is used to create diagrams of information flow, business
process automation, business process re-engineering, accounting,
management and human resources tasks.
10. Value Stream Mapping is a mechanism to improve cycle times and
productivity by visually separating value-adding from non-value-adding
activities.
Highlight Flowchart is used to create good-looking style flowcharts.
System Flowchart helps to understand how complex systems work. Systems
analyzed may be anything from businesses, through biological population
models, to the impact of social policy, etc.
Document Flowchart is commonly used to trace the movement of a
document, such as internal memos, payroll information and interoffice
mail through a system.
11. A SET OF USEFUL STANDARD FLOWCHART
SYMBOLS
It is not strictly necessary to use boxes, circles, diamonds or other such
symbols to construct a flowchart, but these do help to describe the types
of events in the chart more clearly. Described below are a set of standard
symbols which are applicable to most situations without being overly
complex.
Rounded box - use it to represent an event which occurs automatically. Such
an event will trigger a subsequent action, for example `receive telephone
call', or describe a new state of affairs.
12. Rectangle or box - use it to represent an event which is controlled within the
process. Typically this will be a step or action which is taken. In most
flowcharts this will be the most frequently used symbol.
Diamond - use it to represent a decision point in the process. Typically, the
statement in the symbol will require a `yes' or `no' response and branch
to different parts of the flowchart accordingly.
Circle - use it to represent a point at which the flowchart connects with
another process. The name or reference for the other process should
appear within the symbol.