Downloaded 182 times
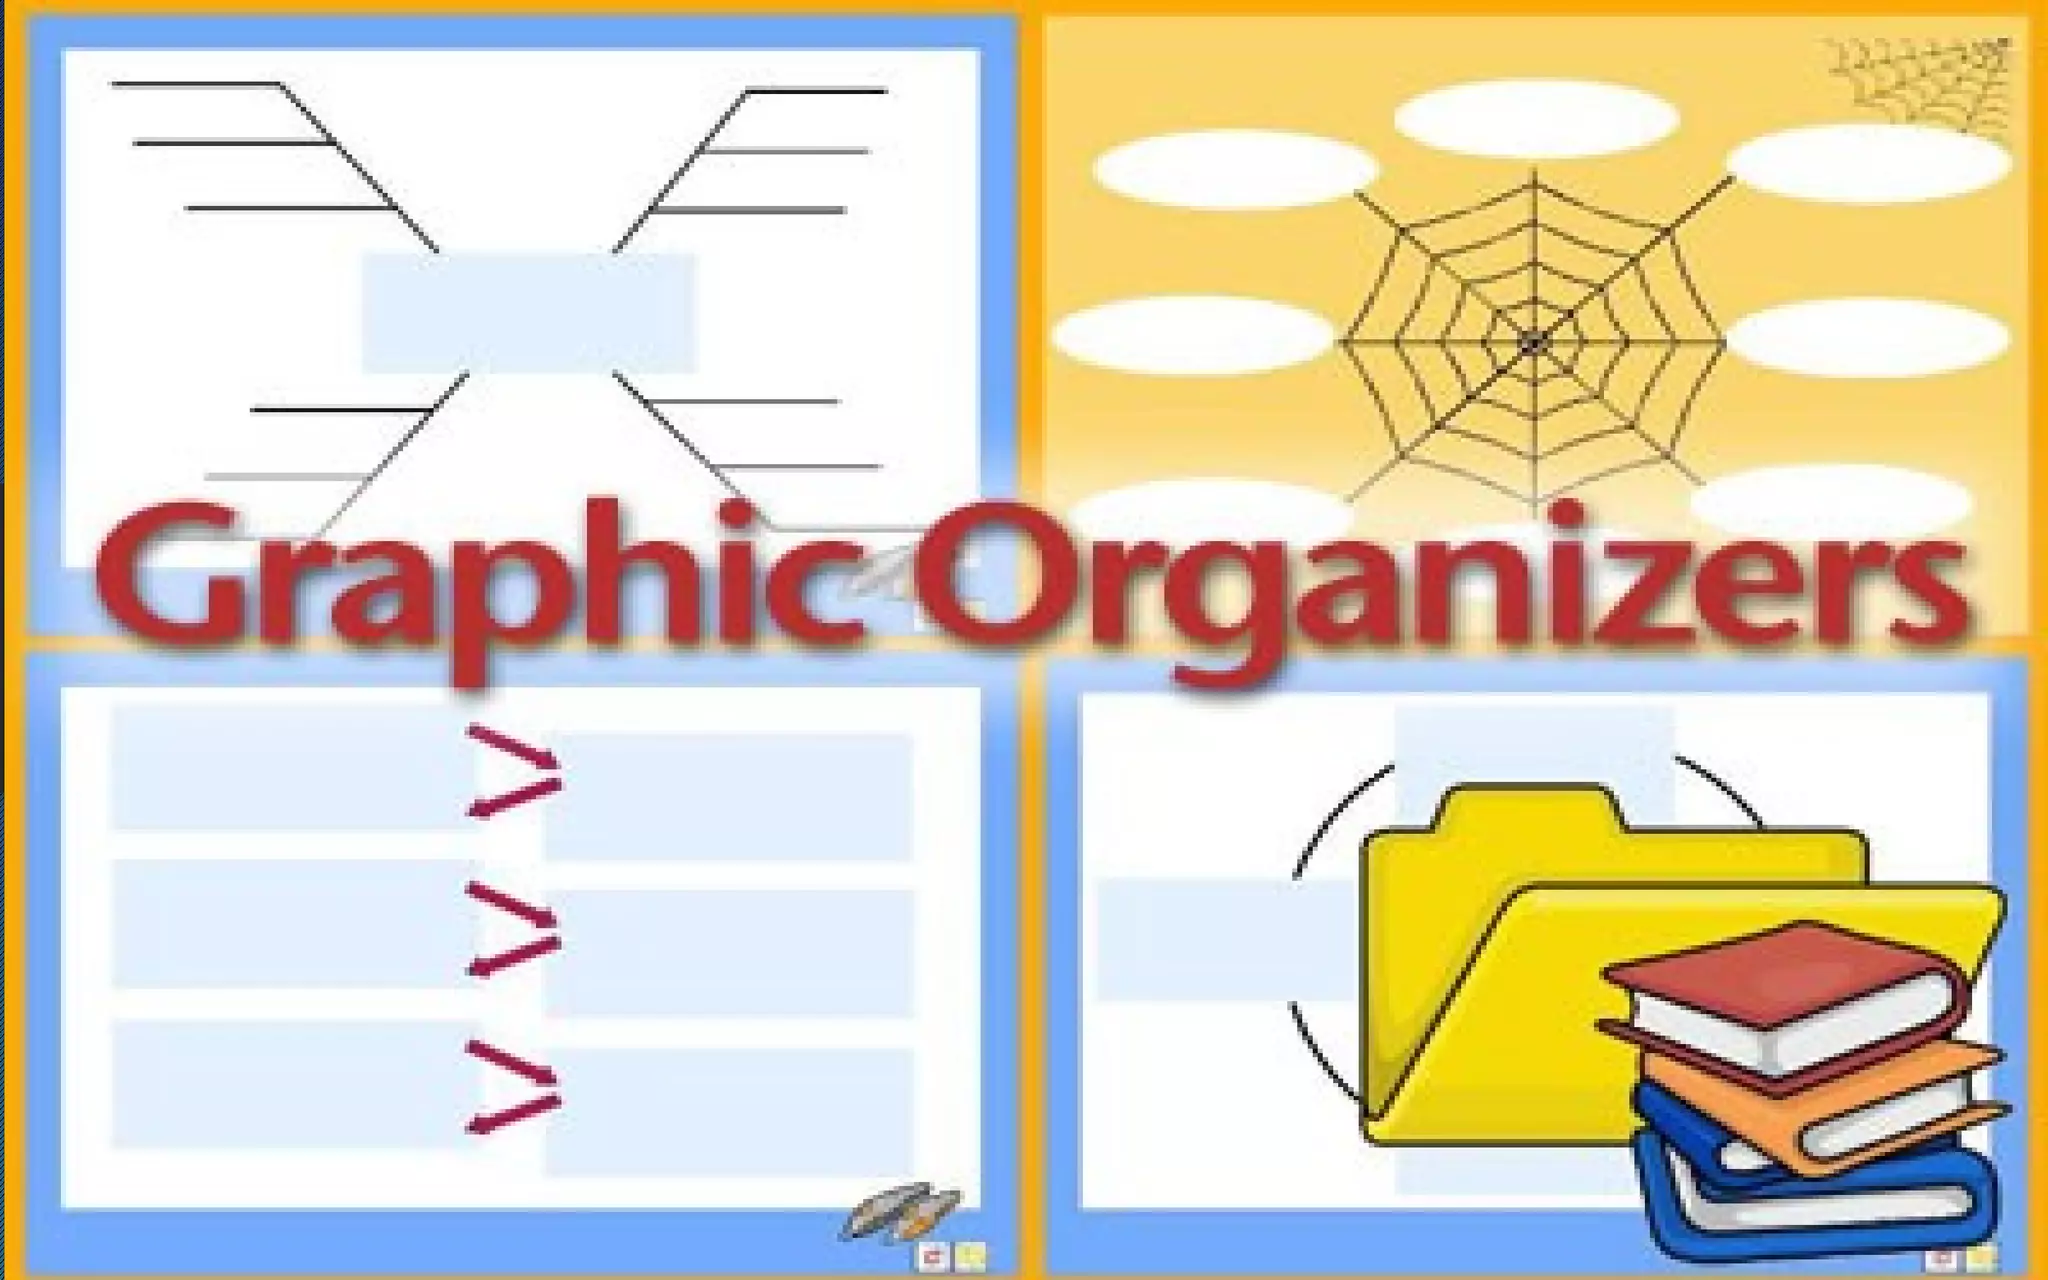
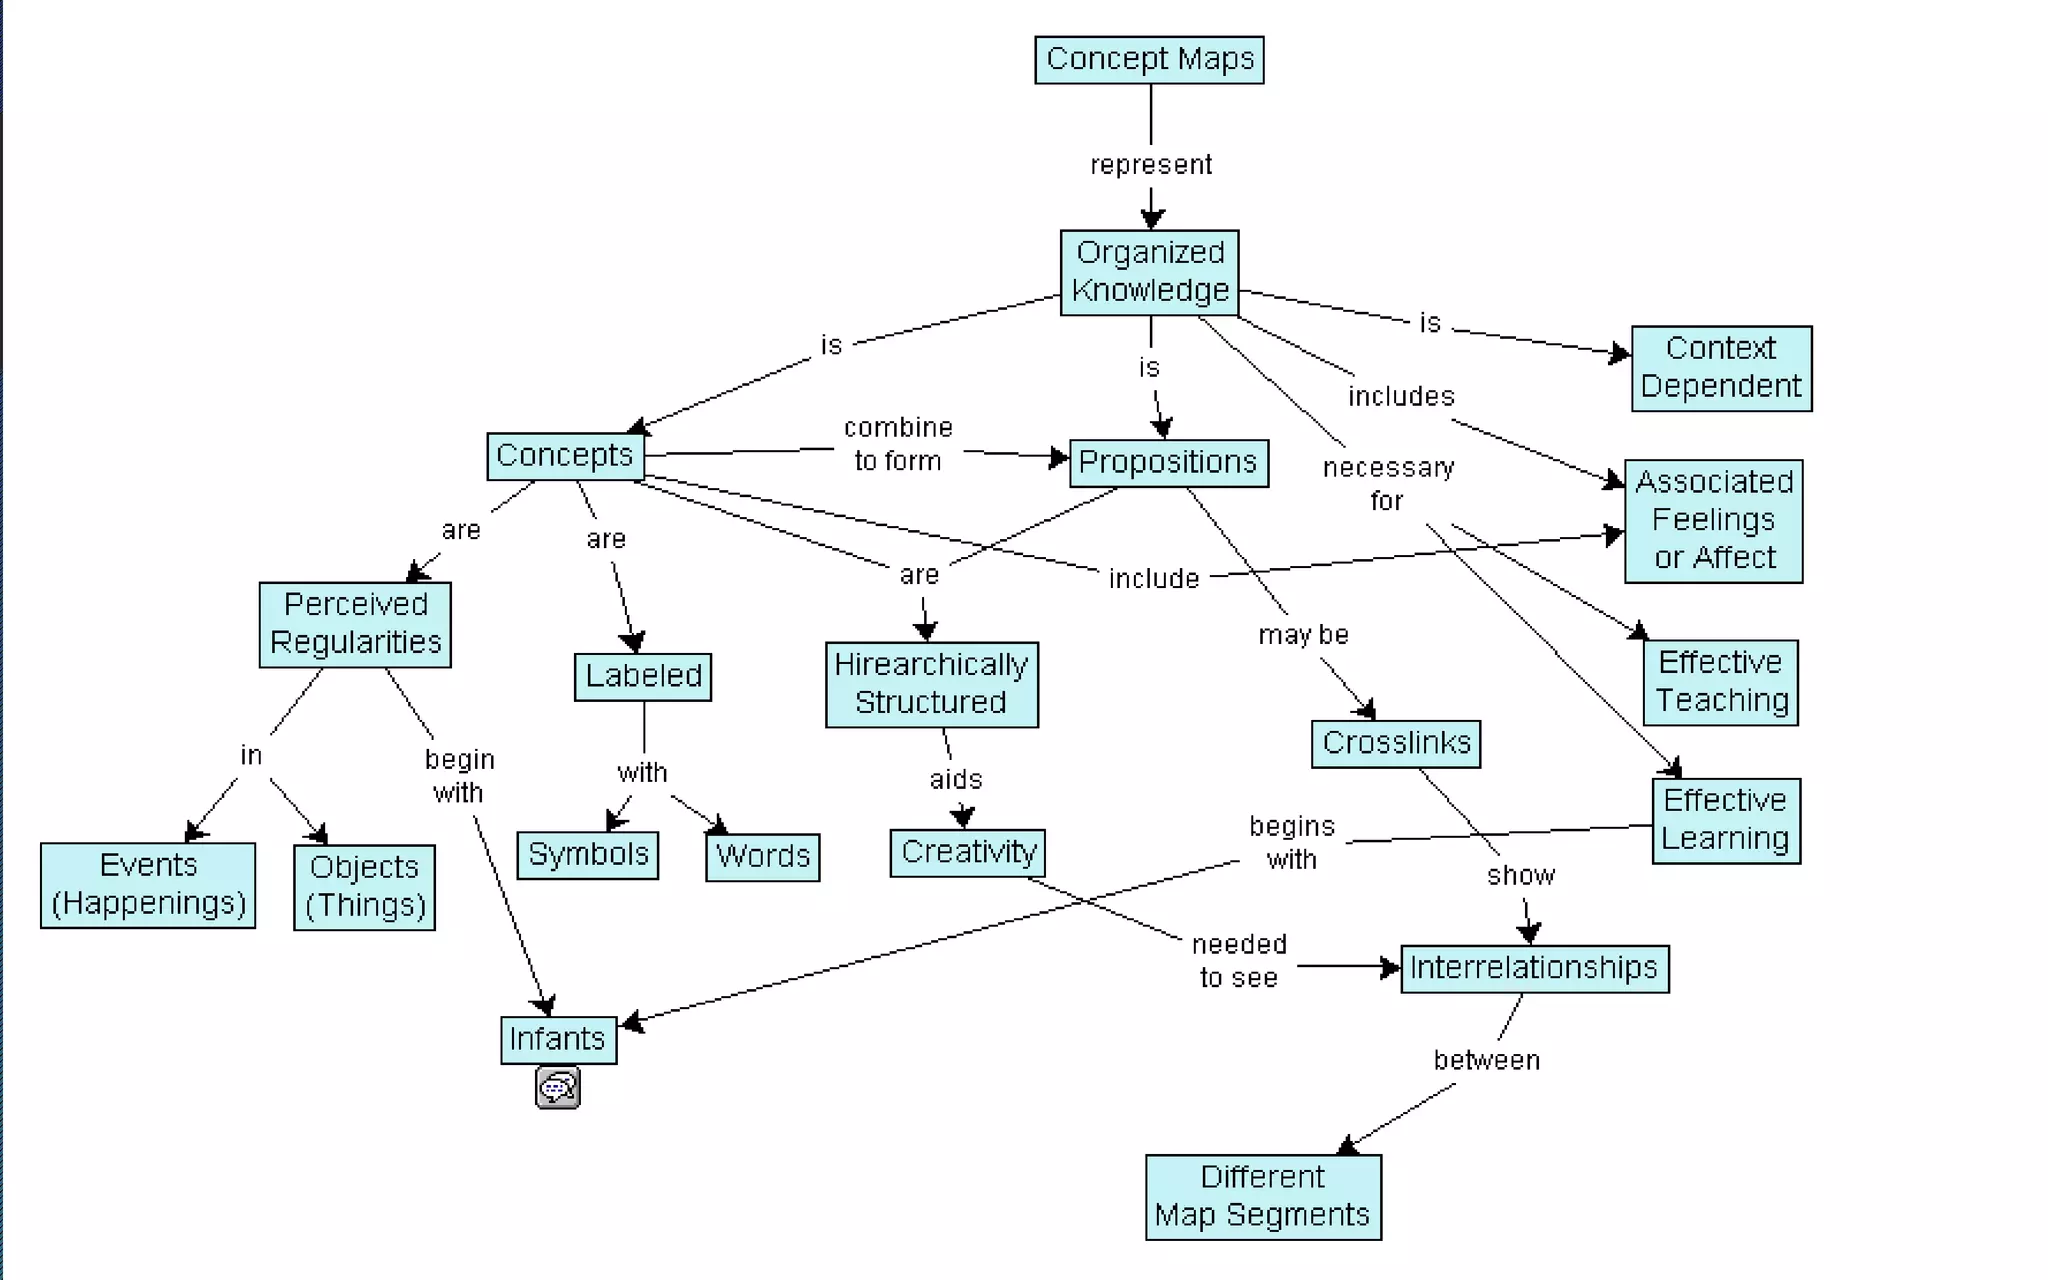
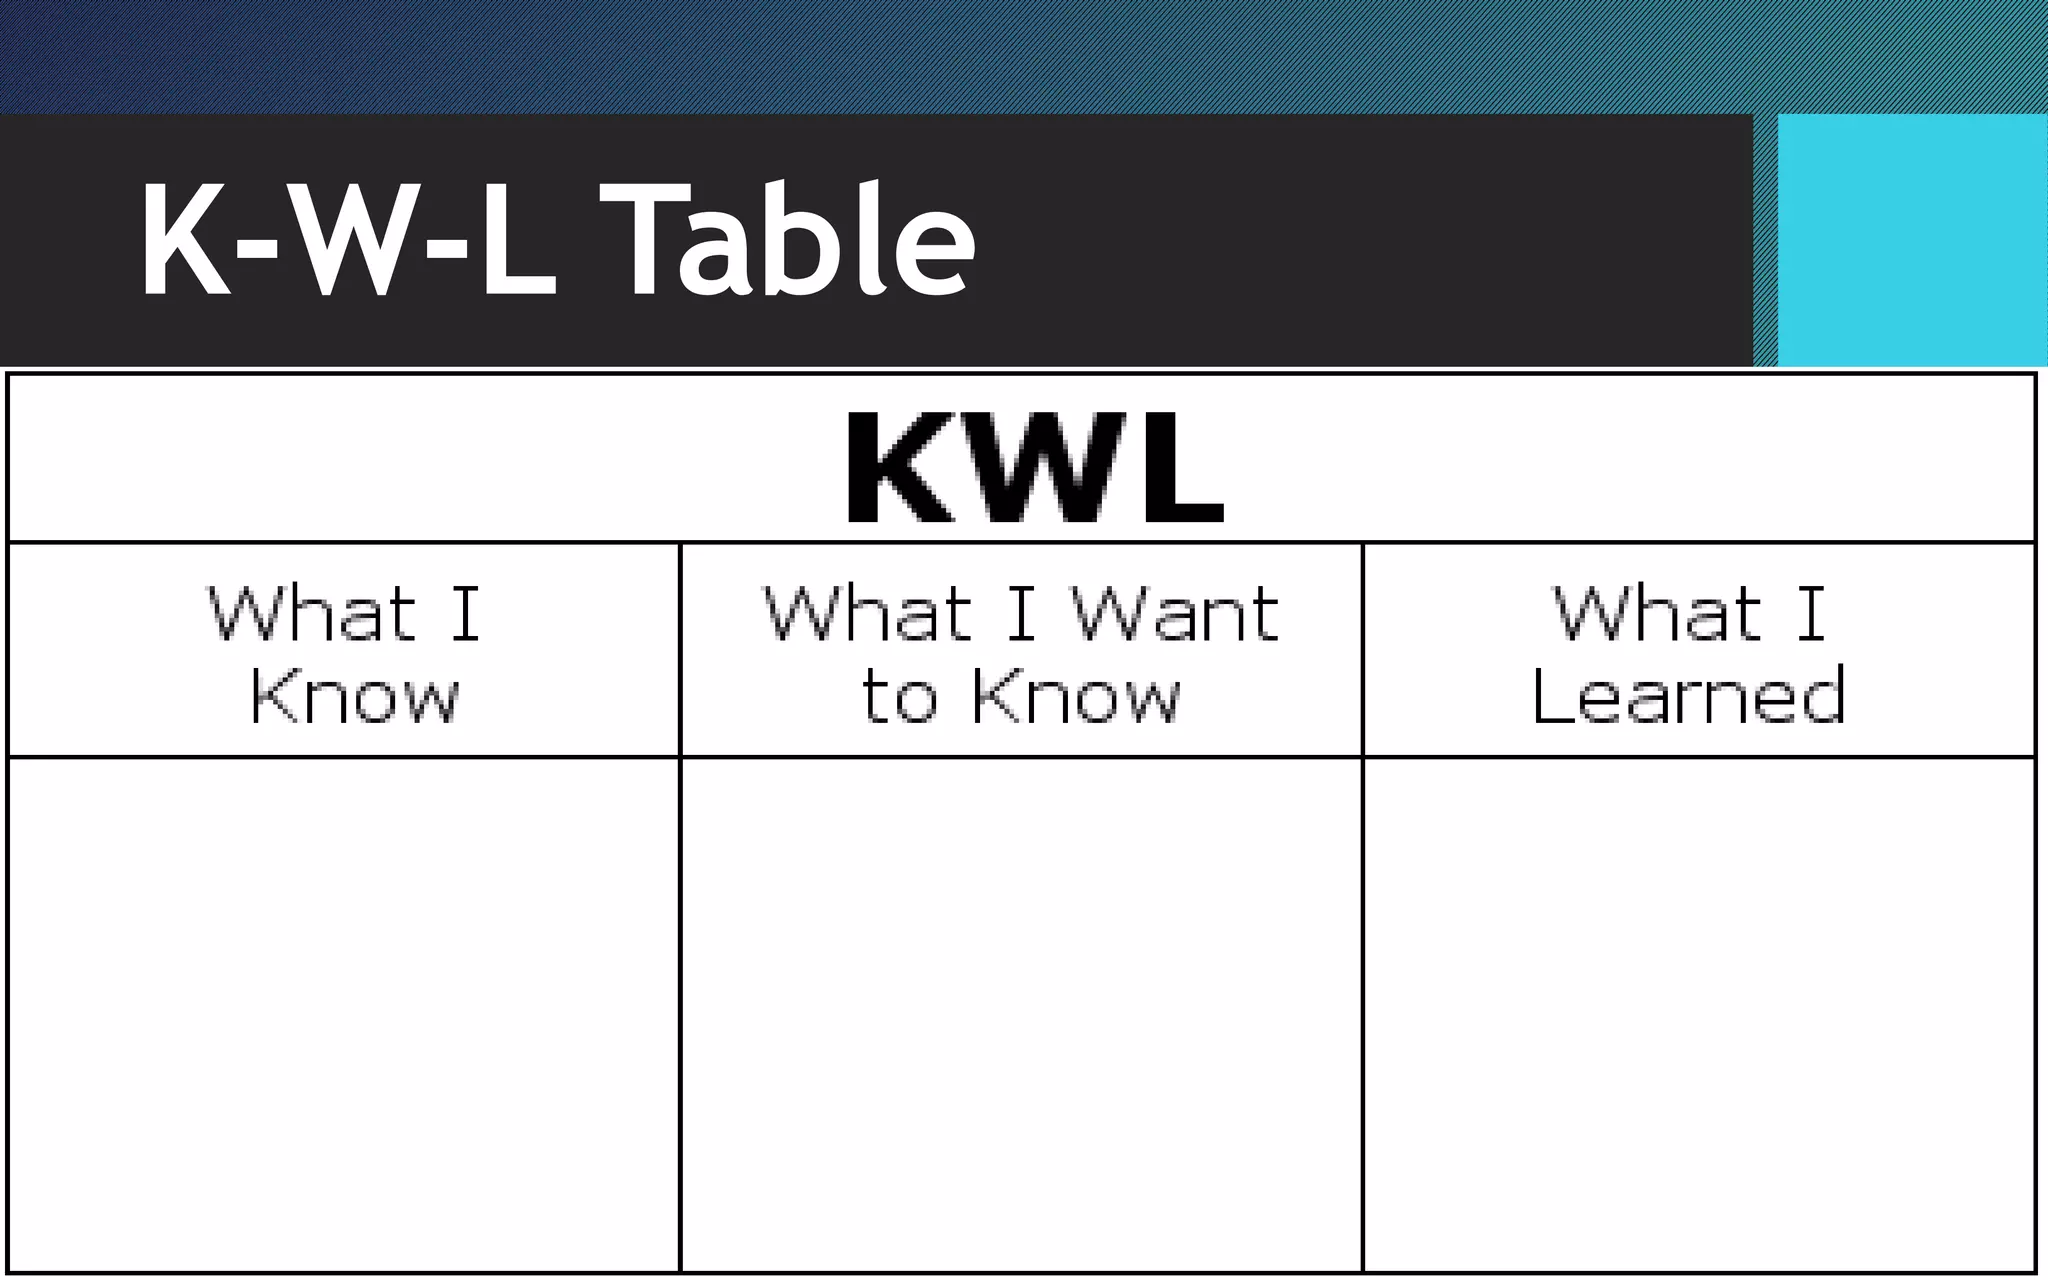
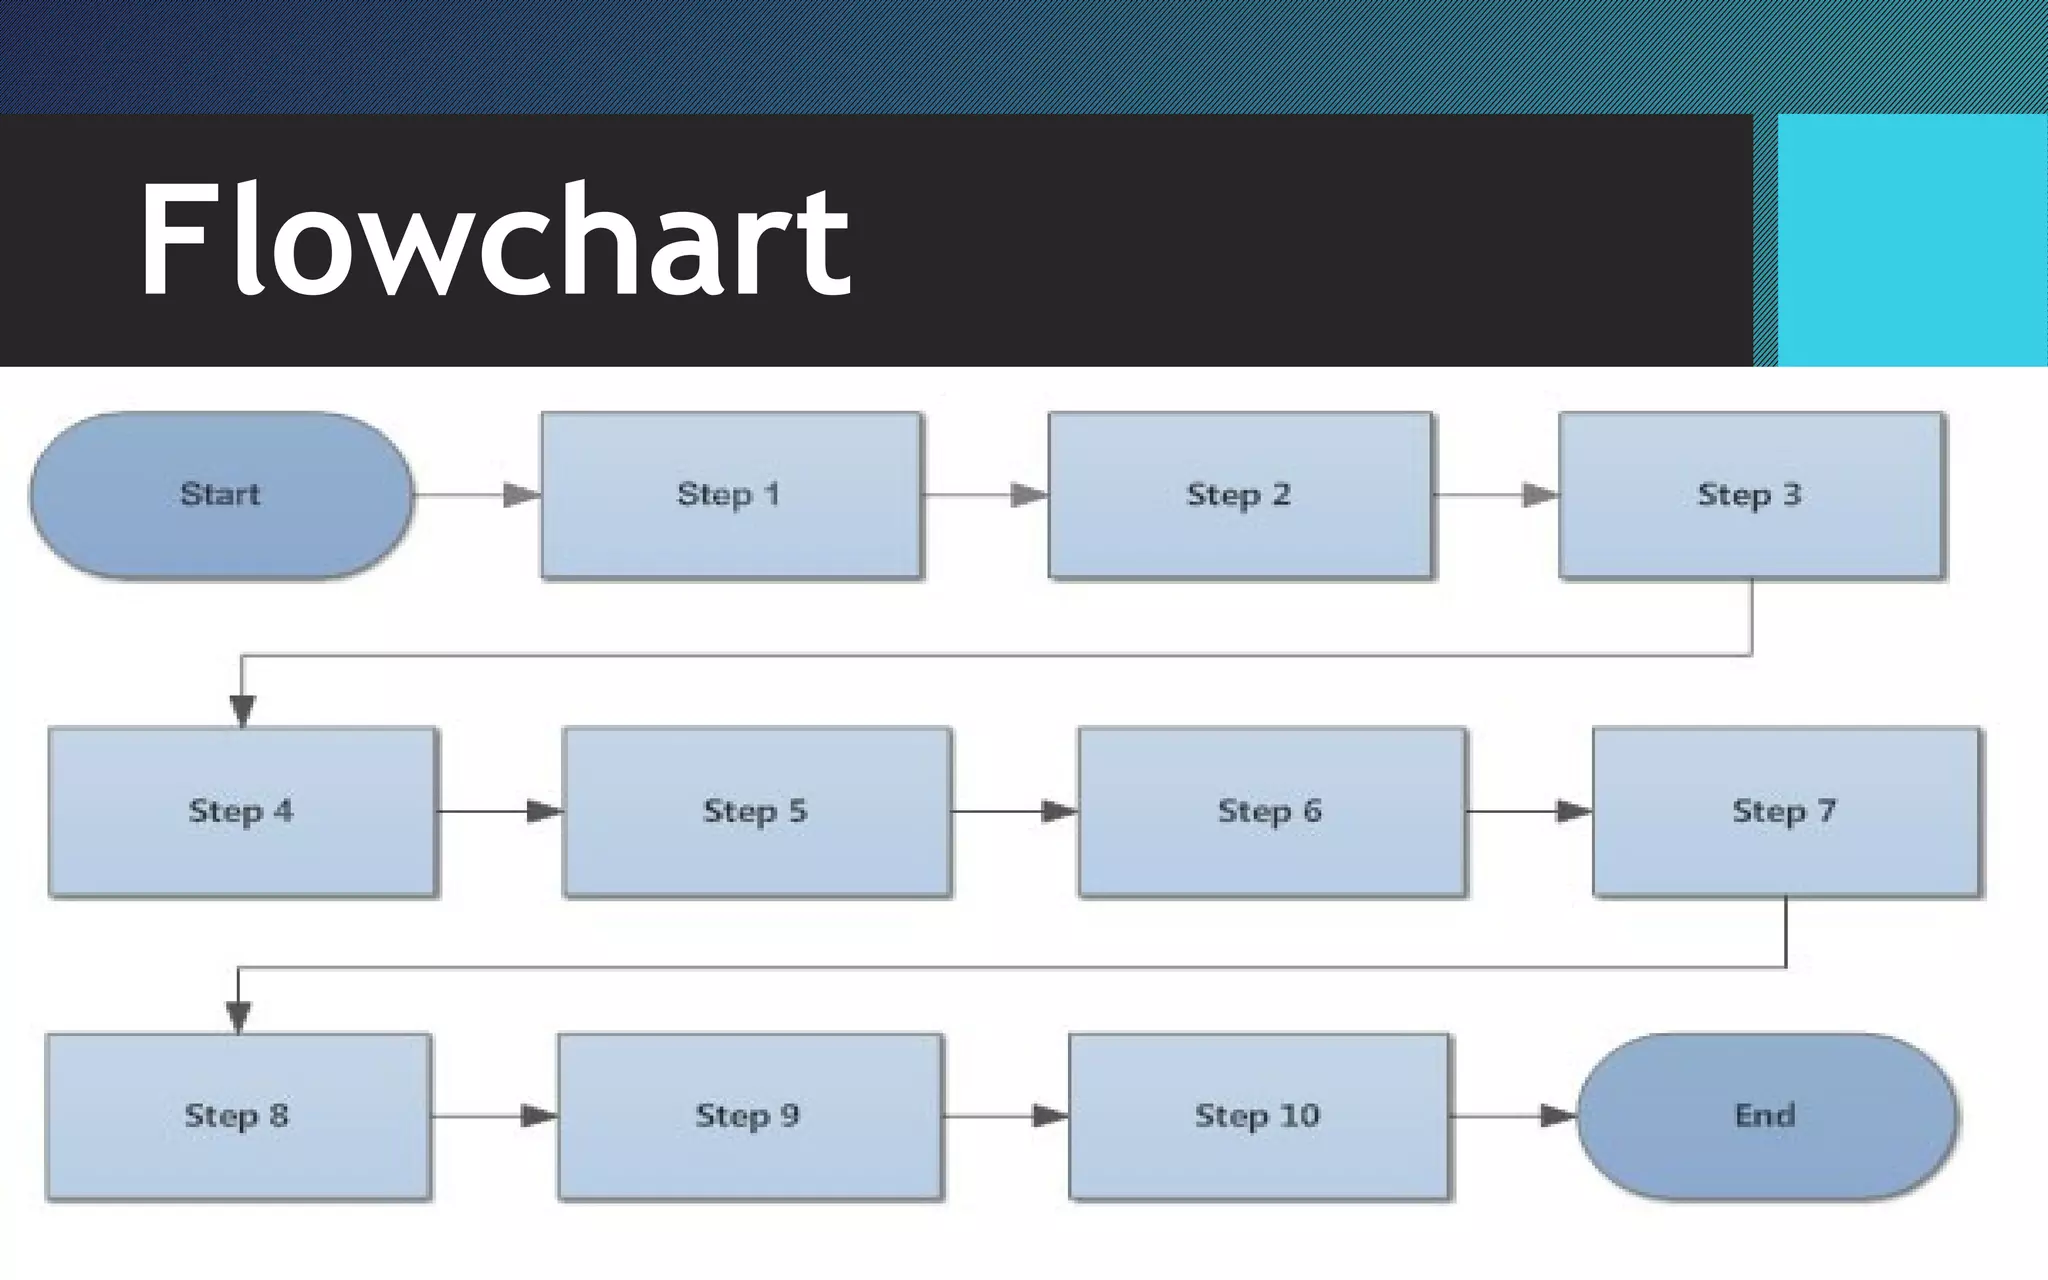
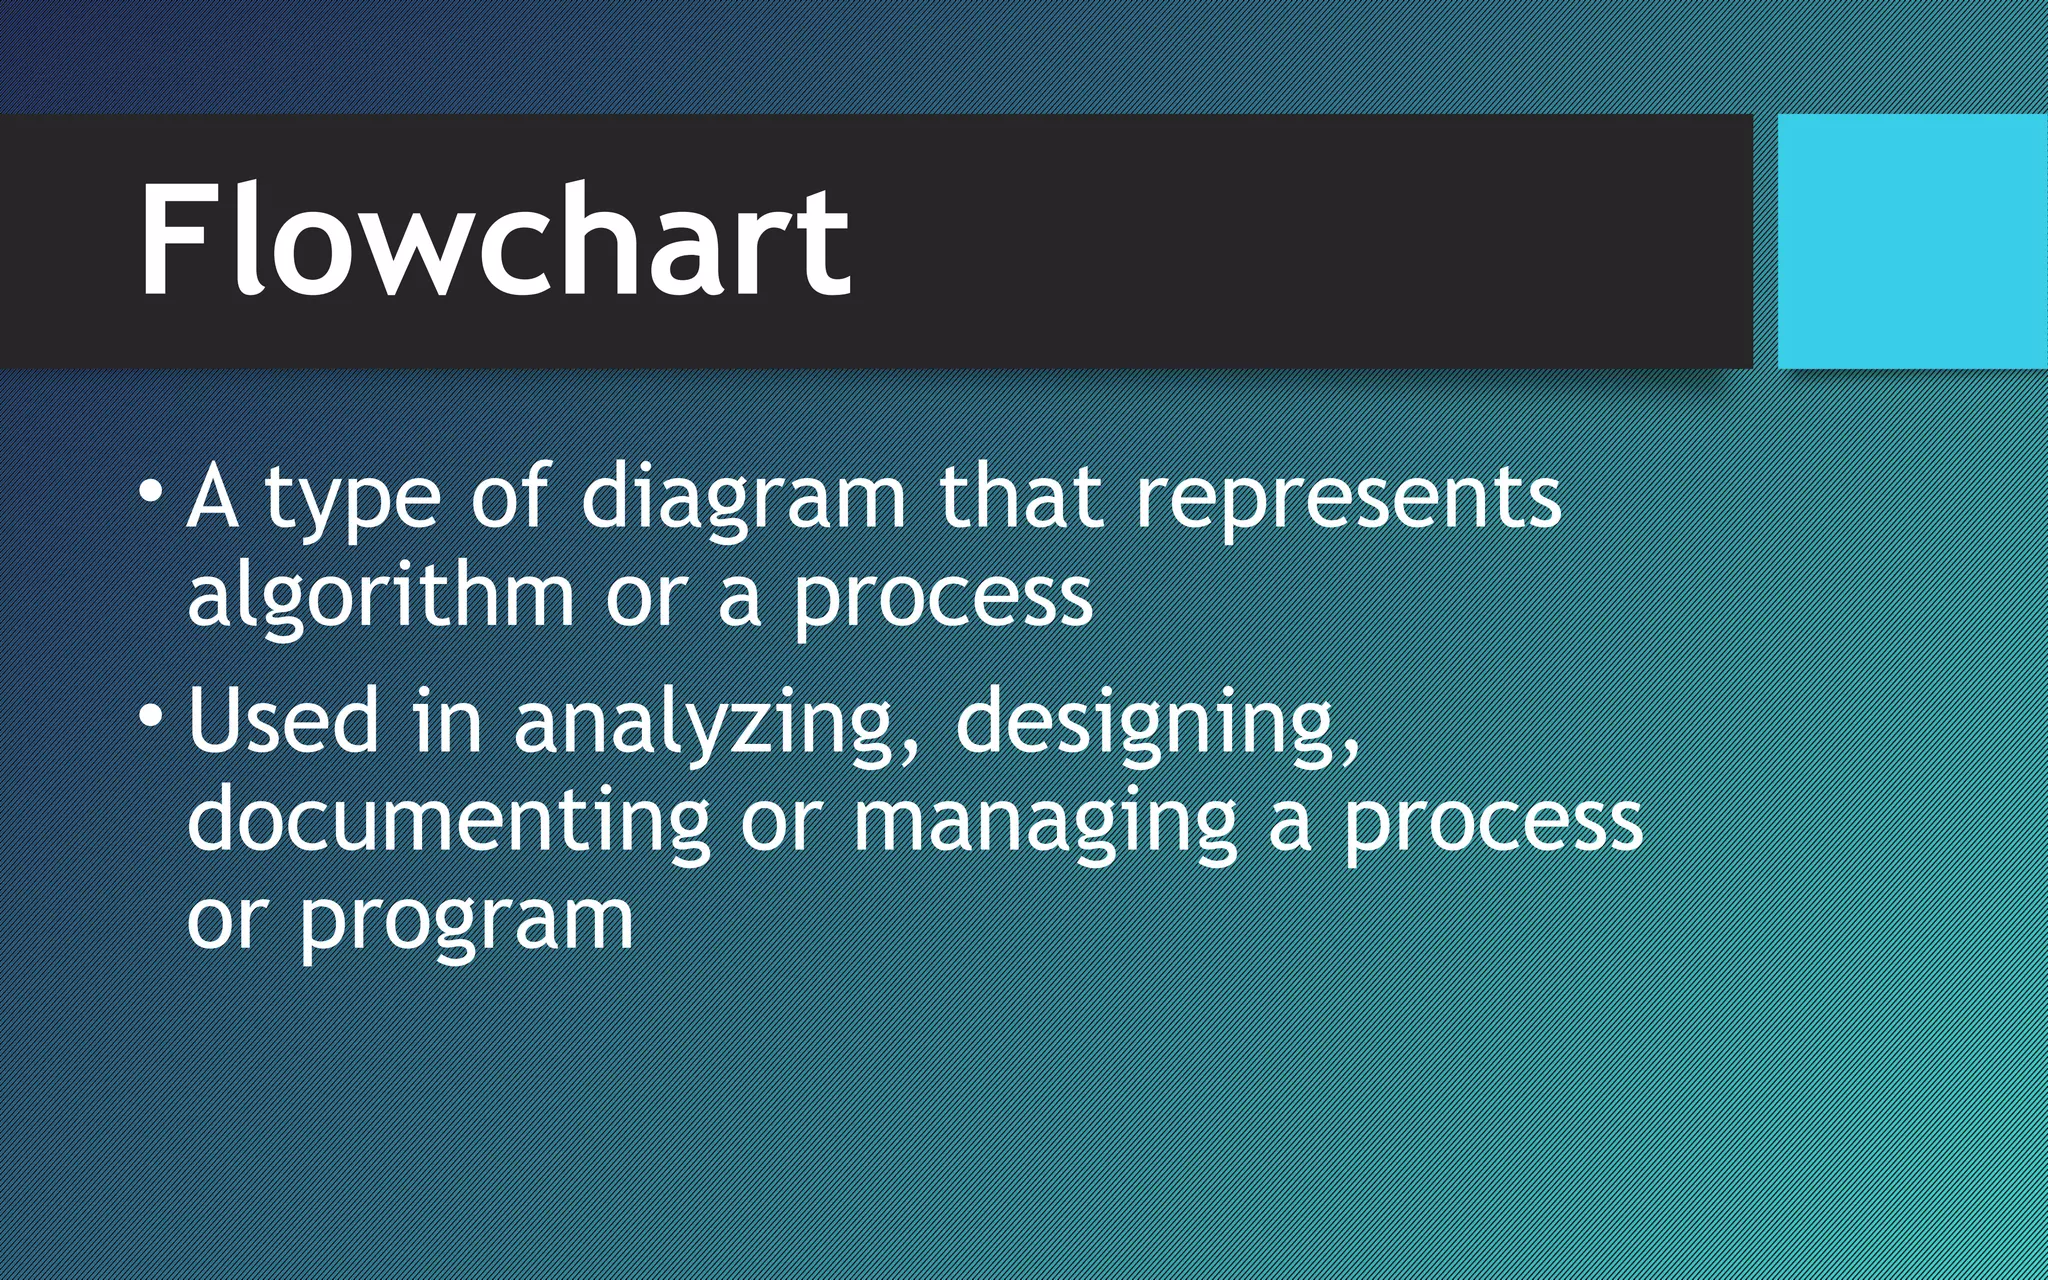
Graphic organizers, including concept maps, K-W-L tables, and flowcharts, are visual tools that aid in knowledge representation and learning. They help students improve comprehension, retain information, and synthesize ideas by depicting relationships between concepts. Each type of organizer serves distinct purposes, such as activating prior knowledge or documenting processes.


![English [Grade 8] Module 1: Noting Context Clues](https://cdn.slidesharecdn.com/ss_thumbnails/grade8english-230421075824-4882ef66-thumbnail.jpg?width=640&height=640&fit=bounds)


