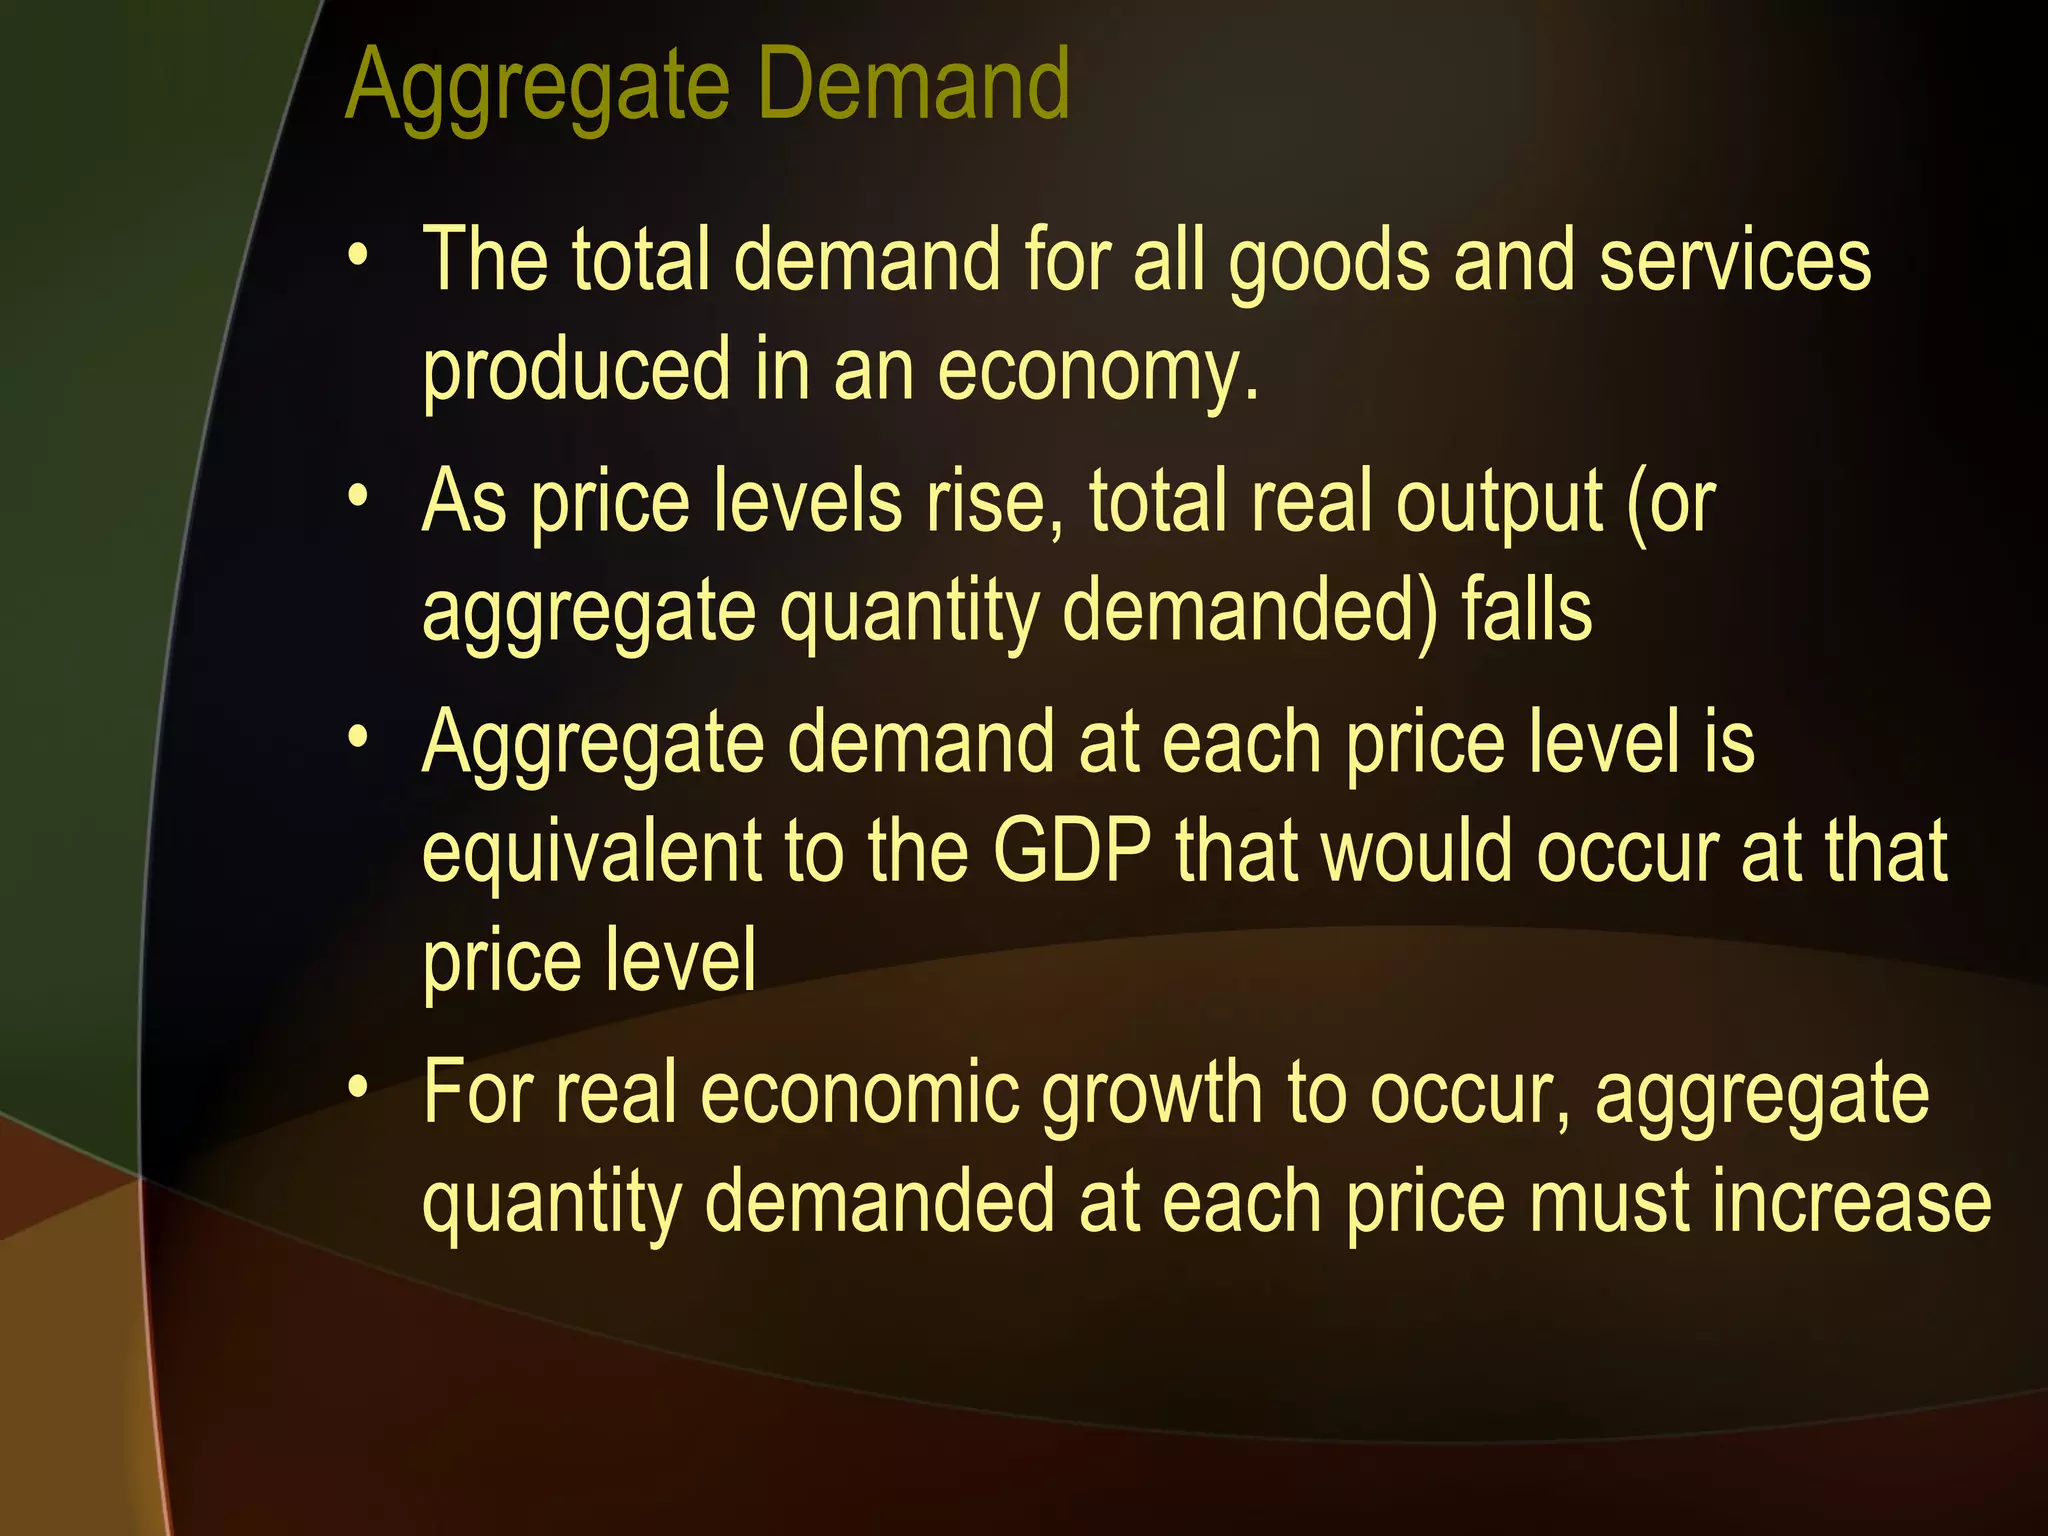
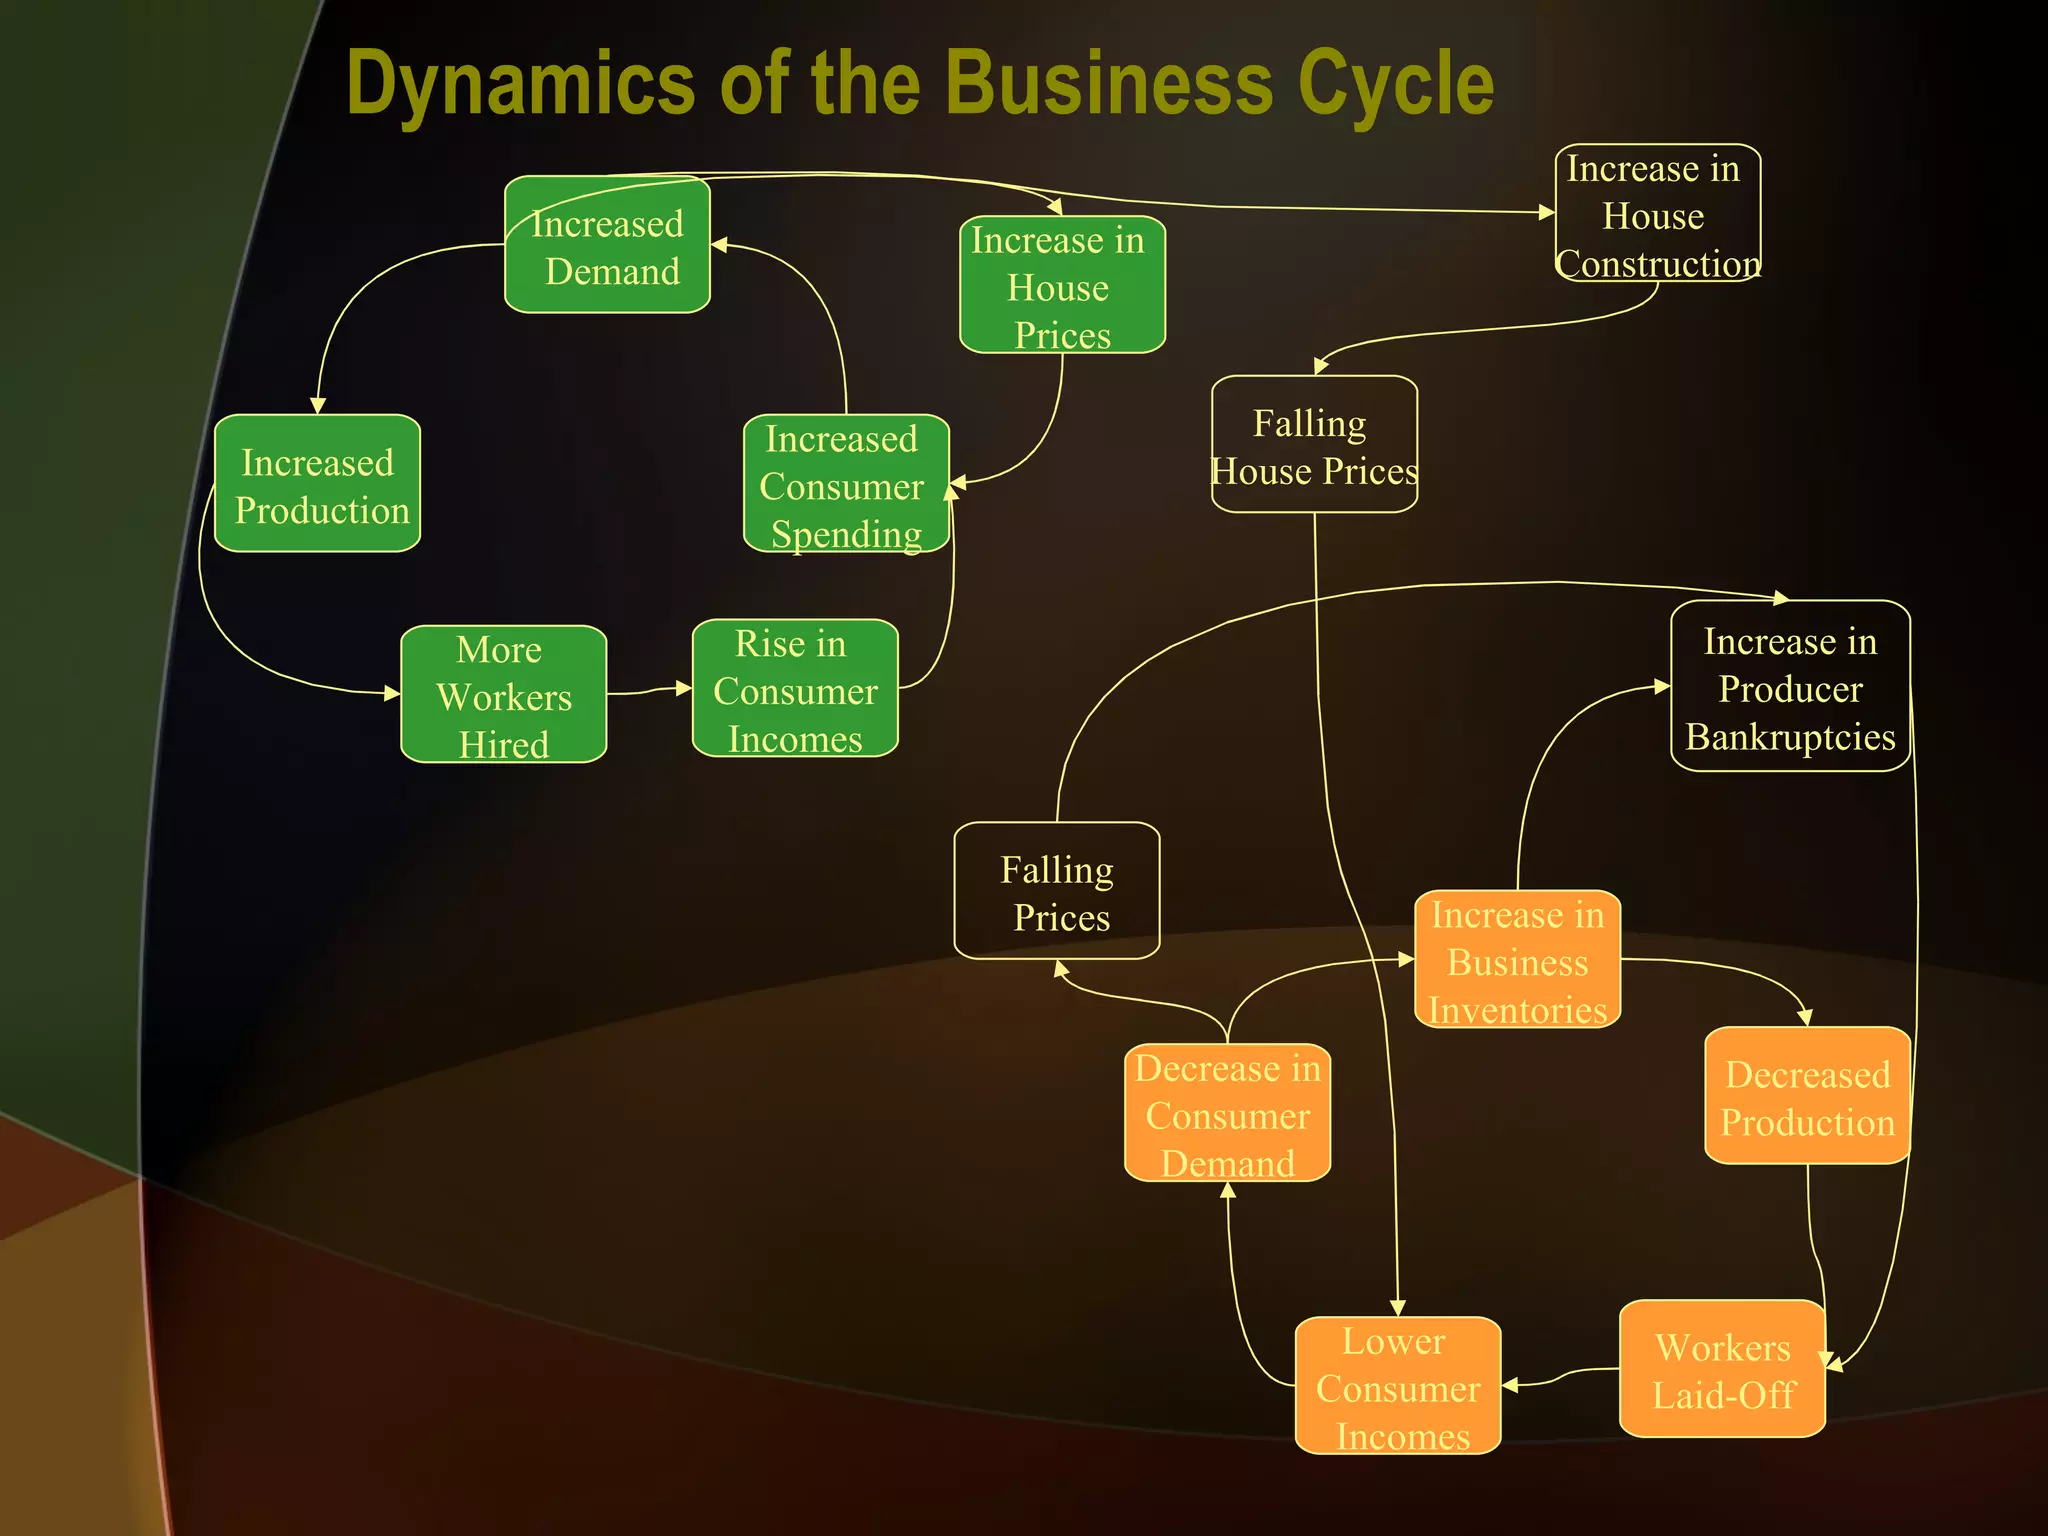
Fiscal Policy and the Business Cycle
Aggregate Demand The total demand for all goods and services produced in an economy. As price levels rise, total real output (or aggregate quantity demanded) falls Aggregate demand at each price level is equivalent to the GDP that would occur at that price level For real economic growth to occur, aggregate quantity demanded at each price must increase
Aggregate Supply Total supply of all goods and service produced in a society. Curve displays the total amount of goods and service that would be supplied at each price level. Very elastic at low output levels. Most resources sitting idle Price levels stay low even as output increases At higher output levels prices tend to rise more rapidly
Aggregate Supply Curve Price Level Real GDP Supplied AS Full employment output Maximum Capacity Output Output can increase without an increase in prices as resources are not fully utilized As output rises, resources become scarce resulting in increasing prices Economy producing at a point on the production possibilities curve – no more output possible without increases in technology or new physical inputs
Equilibrium Output and Price Level Full employment equilibrium – the two curves intersect at a point on the AS curve where prices start to increase more rapidly but the curve is not fully vertical. Price Level Real GDP Supplied AS AD Full employment output
Equilibrium Output and Price Level Recessionary Gap – AD intersects to the left of the full employment output High unemployment Low inflation Low GDP growth Price Level Real GDP Supplied AS AD Full employment output
Equilibrium Output and Price Level Inflationary Gap – AD intersects to the right of the full employment output Low unemployment High inflation High GDP growth Price Level Real GDP Supplied AS AD Full employment output
Changes in Aggregate Demand Changes in consumption Consumer income can be divided into four uses (consumption, taxes, savings, spending on imports) Consumption is whatever is left after the other three uses are considered AD increases when consumption increases – curve shifts to the right Consumption increases through higher incomes, decreases in savings, taxes or spending on imports
Changes in Aggregate Demand Continued Changes in investment Overall level of investment related to expectation of future profits If business profits expected to increase, investment will increase, AD curve shifts to the right If business profits expected to decrease, investments decrease, AD curve shifts to the left Movements closely tied to interest rate – investments normally require borrowing funds, if interest rates increase, cost of investment increases (profits decrease), decrease in investment Opposite true for decreasing interest rate
Changes in Aggregate Demand Changes in government spending Increases in spending or transfer payments shift AD curve to the right Decreases shift curve to the left
Changes in Aggregate Demand Changes in export demand (foreign trade) Four factors influence demand Demand for Canadian-produced exports -> increased demand shifts curve right Domestic rate of inflation -> makes Canadian goods more expensive, reducing demand for exports, shifts curve left Relative levels of income in other countries -> increase in income, increase in demand for Canadian exports, shifts curve right Value of Canadian dollar -> increase in value of dollar makes Canadian goods more expensive, reduced demand shifts curve left, decrease in value of currency has opposite effect
Changes in Aggregate Supply Changes in the price of inputs If price of land, labour or capital increase, firms are able to produce less at each price, AS curve shifts upward and to left of all points to the left of its perfectly inelastic section Price Level Real GDP Supplied AS AS
Changes in Aggregate Supply Changes in the amounts of inputs available If new resources are discovered, labour force increases, more capital goods available, there are more inputs available for use Increases the maximum capacity of economy AS curve shifts down and to the right Price Level Real GDP Supplied AS AS
Changes in Aggregate Supply Changes in efficiency Improvements in technology and/or productivity have the same effect as changing the amounts of inputs available, curve shifts down and to the right
The Business Cycle Covers the periods of alternating economic growth and recession (negative economic growth) as measured by changes in the real GDP Duration of time of business cycle and its size (gain/loss of GDP) vary Technical definition of a recession: negative GDP growth for two quarters No technical definition of a depression
Dynamics of the Business Cycle Increased Demand Increased Production More  Workers Hired Rise in  Consumer Incomes Increased  Consumer  Spending Increased Competition For Capital Goods Upward Pressure on Interest Rates Decrease in Consumer Borrowing Decrease in Consumer Demand Increase in Business Inventories Decreased Production Workers Laid-Off Lower  Consumer Incomes Increase in Producer Bankruptcies Falling Prices
Dynamics of the Business Cycle Increased Demand Increased Production More  Workers Hired Rise in  Consumer Incomes Increased  Consumer  Spending Decrease in Consumer Demand Increase in Business Inventories Decreased Production Workers Laid-Off Lower  Consumer Incomes Increase in Producer Bankruptcies Falling Prices Increase in  House  Prices Falling  House Prices Increase in  House  Construction
Credit and Creditability PBS NOW
Leakages and Injections Leakages: any uses of income that cause money to be taken out of the income-expenditure stream. Taxes Savings Imports Injections: any expenditures that cause money to be put into the income-expenditure stream Government spending Investment spending Exports
Leakages and Injections If Leakages > Injections    AD shrinks T + S + M > G + I + X As production falls, consumers pay fewer taxes, save less and buy fewer imports; leading to… Leakages = Injections    AD stabilizes (economy in equilibrium) T + S + M = G + I + X If Leakages < Injections    AD grows T + S + M < G + I + X As production and incomes rise, consumers pay more taxes, save more, buy more imports; leading to… Leakages = Injections    AD stabilizes (economy in equilibrium) The equilibrium point can be at, above or below the full employment point
Fiscal Policy Keynes (an economist) believed business cycle should be managed through government intervention By influencing the size of leakages and injections, AD can be managed Fiscal Policy: government use of powers of taxation, expenditure and borrowing to alter the circular flow of income Discretionary Fiscal Policy: government takes deliberate actions through legislation to alter spending or taxation policies
Expansionary Fiscal Policy When the economy is in recession, government wants to increase AD Tax cut: increases consumers disposable income Increases AD as long as consumers don’t increase savings or spending on imports Increase in government spending: directly shifts the AD curve
Contractionary Fiscal Policy When economy is suffering from inflation, government wants to decrease AD Tax increase: decreases disposable income of consumers AD curve shifts left, both inflation and GDP decrease Decrease in government spending: directly shifts the AD curve left
Tools of Fiscal Policy Changes in government spending Can increase spending in normal budgetary programs (health, education, welfare, etc.) Can increase spending on infrastructure (underlying economic foundation of goods and services that allows a society to function e.g. build roads, schools, communication systems) Added advantage of increasing capital goods in economy which can shift AS in the future Changes in taxation Raise or lower personal and corporate income taxes and/or sales and excise taxes Alter tax exemptions or tax credits Provide special tax incentives for investment (CCA)
Automatic Stabilizers Exist and act on AD before a recession or inflationary trend takes hold Employment insurance and welfare: increased payments during times of economic downturns Help to maintain incomes during recessions (maintain spending) Either slows the leftward shift of AD or shifts curve right Progressive tax: as incomes rise, taxes rise (increases leakages) Slows down increases in consumption Stops AD curve from shifting too quickly to the right
Multiplier Effect Output increases by a multiple of the original change in spending that caused it.  Thus, a $10 billion increase in government spending could cause total output to rise by $15 billion (a  multiplier  of 1.5) or by $5 billion (a  multiplier  of 0.5).  The multiplier  does not need to exceed 1.0
Government Budgets Deficit budget: government spends more than it receives in tax revenue (must borrow money to cover shortfall) Surplus budget: government collects more in taxes than it spends Balanced budget: government spends amount equal to collected tax revenue Debt: total amount owed by the government
Changing Opinions About Government Budgets Annually Balanced Budget Every year spending should equal tax revenue When AD is falling, tax revenues fall resulting in a need to cut programs When AD is rising, tax revenues rise resulting in a need to increase spending or cut taxes Cyclically Balanced Budgets During recessionary phase – governments run deficits  During inflationary phase – governments run surpluses Due to length of cycles, budget may not be balanced over cycle resulting in increasing debt Deficit and Surplus Budgets as Necessary Deficits when economy needs a boost
Budget Deficits Cyclical deficit: part of deficit incurred in trying to pull an economy out of recession (spending on infrastructure, jobs retraining, etc.) Structural deficit: part of deficit that exists even when economy is operating at full employment Full employment budget: intervene only when economy falls below its full-employment targets – no structural deficits Debt Comparison
Debt Comparisons
Debt Comparisons
Canadian Federal Budget Actual 1 Estimate Projection 2004–05 2005–06 2006–07 2007–08 (billions of dollars) Budgetary revenues 211.9 220.9 227.1 235.8 Program expenses 176.3 179.2 188.8 196.5 Public debt charges 34.1 33.7 34.8 34.8 Total expenses 210.5 212.9 223.6 231.4 Planned debt reduction 1.5 8.0 3.0 3.0 Remaining surplus 0.6 1.4 Federal debt 494.4 486.4 483.4 480.4 Nominal GDP (billions of dollars, calendar year) 1,290 1,369 1,451 1,517
November Economic Update Budget 2008 Numbers Government update
Drawbacks and Limitations of Fiscal Policy Time lags are significant Recognition lag: time it takes government to recognize there is a problem Decision lag: time required for government to determine most appropriate policy Implementation lag: time it takes to figure out how to implement new directives Impact lag: time it takes to be felt through multiplier effect Difficulties in changing spending and taxation policies Conflict between levels of government over appropriate policies Regional variations Size of debt can limit use of fiscal policy
More Limitations Crowding out of private investment  Increases interest rates Reduces amount of funding for private investment Deficits redistribute income from all taxpayers to bondholders Interest payments on debt made from tax revenue Deficits impose net burden on future generations Foreign-owned debt removes capital from economy

Fiscal Policy And The Business Cycle

  • 1.
    Fiscal Policy andthe Business Cycle
  • 2.
    Aggregate Demand Thetotal demand for all goods and services produced in an economy. As price levels rise, total real output (or aggregate quantity demanded) falls Aggregate demand at each price level is equivalent to the GDP that would occur at that price level For real economic growth to occur, aggregate quantity demanded at each price must increase
  • 3.
    Aggregate Supply Totalsupply of all goods and service produced in a society. Curve displays the total amount of goods and service that would be supplied at each price level. Very elastic at low output levels. Most resources sitting idle Price levels stay low even as output increases At higher output levels prices tend to rise more rapidly
  • 4.
    Aggregate Supply CurvePrice Level Real GDP Supplied AS Full employment output Maximum Capacity Output Output can increase without an increase in prices as resources are not fully utilized As output rises, resources become scarce resulting in increasing prices Economy producing at a point on the production possibilities curve – no more output possible without increases in technology or new physical inputs
  • 5.
    Equilibrium Output andPrice Level Full employment equilibrium – the two curves intersect at a point on the AS curve where prices start to increase more rapidly but the curve is not fully vertical. Price Level Real GDP Supplied AS AD Full employment output
  • 6.
    Equilibrium Output andPrice Level Recessionary Gap – AD intersects to the left of the full employment output High unemployment Low inflation Low GDP growth Price Level Real GDP Supplied AS AD Full employment output
  • 7.
    Equilibrium Output andPrice Level Inflationary Gap – AD intersects to the right of the full employment output Low unemployment High inflation High GDP growth Price Level Real GDP Supplied AS AD Full employment output
  • 8.
    Changes in AggregateDemand Changes in consumption Consumer income can be divided into four uses (consumption, taxes, savings, spending on imports) Consumption is whatever is left after the other three uses are considered AD increases when consumption increases – curve shifts to the right Consumption increases through higher incomes, decreases in savings, taxes or spending on imports
  • 9.
    Changes in AggregateDemand Continued Changes in investment Overall level of investment related to expectation of future profits If business profits expected to increase, investment will increase, AD curve shifts to the right If business profits expected to decrease, investments decrease, AD curve shifts to the left Movements closely tied to interest rate – investments normally require borrowing funds, if interest rates increase, cost of investment increases (profits decrease), decrease in investment Opposite true for decreasing interest rate
  • 10.
    Changes in AggregateDemand Changes in government spending Increases in spending or transfer payments shift AD curve to the right Decreases shift curve to the left
  • 11.
    Changes in AggregateDemand Changes in export demand (foreign trade) Four factors influence demand Demand for Canadian-produced exports -> increased demand shifts curve right Domestic rate of inflation -> makes Canadian goods more expensive, reducing demand for exports, shifts curve left Relative levels of income in other countries -> increase in income, increase in demand for Canadian exports, shifts curve right Value of Canadian dollar -> increase in value of dollar makes Canadian goods more expensive, reduced demand shifts curve left, decrease in value of currency has opposite effect
  • 12.
    Changes in AggregateSupply Changes in the price of inputs If price of land, labour or capital increase, firms are able to produce less at each price, AS curve shifts upward and to left of all points to the left of its perfectly inelastic section Price Level Real GDP Supplied AS AS
  • 13.
    Changes in AggregateSupply Changes in the amounts of inputs available If new resources are discovered, labour force increases, more capital goods available, there are more inputs available for use Increases the maximum capacity of economy AS curve shifts down and to the right Price Level Real GDP Supplied AS AS
  • 14.
    Changes in AggregateSupply Changes in efficiency Improvements in technology and/or productivity have the same effect as changing the amounts of inputs available, curve shifts down and to the right
  • 15.
    The Business CycleCovers the periods of alternating economic growth and recession (negative economic growth) as measured by changes in the real GDP Duration of time of business cycle and its size (gain/loss of GDP) vary Technical definition of a recession: negative GDP growth for two quarters No technical definition of a depression
  • 16.
    Dynamics of theBusiness Cycle Increased Demand Increased Production More Workers Hired Rise in Consumer Incomes Increased Consumer Spending Increased Competition For Capital Goods Upward Pressure on Interest Rates Decrease in Consumer Borrowing Decrease in Consumer Demand Increase in Business Inventories Decreased Production Workers Laid-Off Lower Consumer Incomes Increase in Producer Bankruptcies Falling Prices
  • 17.
    Dynamics of theBusiness Cycle Increased Demand Increased Production More Workers Hired Rise in Consumer Incomes Increased Consumer Spending Decrease in Consumer Demand Increase in Business Inventories Decreased Production Workers Laid-Off Lower Consumer Incomes Increase in Producer Bankruptcies Falling Prices Increase in House Prices Falling House Prices Increase in House Construction
  • 18.
  • 19.
    Leakages and InjectionsLeakages: any uses of income that cause money to be taken out of the income-expenditure stream. Taxes Savings Imports Injections: any expenditures that cause money to be put into the income-expenditure stream Government spending Investment spending Exports
  • 20.
    Leakages and InjectionsIf Leakages > Injections  AD shrinks T + S + M > G + I + X As production falls, consumers pay fewer taxes, save less and buy fewer imports; leading to… Leakages = Injections  AD stabilizes (economy in equilibrium) T + S + M = G + I + X If Leakages < Injections  AD grows T + S + M < G + I + X As production and incomes rise, consumers pay more taxes, save more, buy more imports; leading to… Leakages = Injections  AD stabilizes (economy in equilibrium) The equilibrium point can be at, above or below the full employment point
  • 21.
    Fiscal Policy Keynes(an economist) believed business cycle should be managed through government intervention By influencing the size of leakages and injections, AD can be managed Fiscal Policy: government use of powers of taxation, expenditure and borrowing to alter the circular flow of income Discretionary Fiscal Policy: government takes deliberate actions through legislation to alter spending or taxation policies
  • 22.
    Expansionary Fiscal PolicyWhen the economy is in recession, government wants to increase AD Tax cut: increases consumers disposable income Increases AD as long as consumers don’t increase savings or spending on imports Increase in government spending: directly shifts the AD curve
  • 23.
    Contractionary Fiscal PolicyWhen economy is suffering from inflation, government wants to decrease AD Tax increase: decreases disposable income of consumers AD curve shifts left, both inflation and GDP decrease Decrease in government spending: directly shifts the AD curve left
  • 24.
    Tools of FiscalPolicy Changes in government spending Can increase spending in normal budgetary programs (health, education, welfare, etc.) Can increase spending on infrastructure (underlying economic foundation of goods and services that allows a society to function e.g. build roads, schools, communication systems) Added advantage of increasing capital goods in economy which can shift AS in the future Changes in taxation Raise or lower personal and corporate income taxes and/or sales and excise taxes Alter tax exemptions or tax credits Provide special tax incentives for investment (CCA)
  • 25.
    Automatic Stabilizers Existand act on AD before a recession or inflationary trend takes hold Employment insurance and welfare: increased payments during times of economic downturns Help to maintain incomes during recessions (maintain spending) Either slows the leftward shift of AD or shifts curve right Progressive tax: as incomes rise, taxes rise (increases leakages) Slows down increases in consumption Stops AD curve from shifting too quickly to the right
  • 26.
    Multiplier Effect Outputincreases by a multiple of the original change in spending that caused it. Thus, a $10 billion increase in government spending could cause total output to rise by $15 billion (a multiplier of 1.5) or by $5 billion (a multiplier of 0.5). The multiplier does not need to exceed 1.0
  • 27.
    Government Budgets Deficitbudget: government spends more than it receives in tax revenue (must borrow money to cover shortfall) Surplus budget: government collects more in taxes than it spends Balanced budget: government spends amount equal to collected tax revenue Debt: total amount owed by the government
  • 28.
    Changing Opinions AboutGovernment Budgets Annually Balanced Budget Every year spending should equal tax revenue When AD is falling, tax revenues fall resulting in a need to cut programs When AD is rising, tax revenues rise resulting in a need to increase spending or cut taxes Cyclically Balanced Budgets During recessionary phase – governments run deficits During inflationary phase – governments run surpluses Due to length of cycles, budget may not be balanced over cycle resulting in increasing debt Deficit and Surplus Budgets as Necessary Deficits when economy needs a boost
  • 29.
    Budget Deficits Cyclicaldeficit: part of deficit incurred in trying to pull an economy out of recession (spending on infrastructure, jobs retraining, etc.) Structural deficit: part of deficit that exists even when economy is operating at full employment Full employment budget: intervene only when economy falls below its full-employment targets – no structural deficits Debt Comparison
  • 30.
  • 31.
  • 32.
    Canadian Federal BudgetActual 1 Estimate Projection 2004–05 2005–06 2006–07 2007–08 (billions of dollars) Budgetary revenues 211.9 220.9 227.1 235.8 Program expenses 176.3 179.2 188.8 196.5 Public debt charges 34.1 33.7 34.8 34.8 Total expenses 210.5 212.9 223.6 231.4 Planned debt reduction 1.5 8.0 3.0 3.0 Remaining surplus 0.6 1.4 Federal debt 494.4 486.4 483.4 480.4 Nominal GDP (billions of dollars, calendar year) 1,290 1,369 1,451 1,517
  • 33.
    November Economic UpdateBudget 2008 Numbers Government update
  • 34.
    Drawbacks and Limitationsof Fiscal Policy Time lags are significant Recognition lag: time it takes government to recognize there is a problem Decision lag: time required for government to determine most appropriate policy Implementation lag: time it takes to figure out how to implement new directives Impact lag: time it takes to be felt through multiplier effect Difficulties in changing spending and taxation policies Conflict between levels of government over appropriate policies Regional variations Size of debt can limit use of fiscal policy
  • 35.
    More Limitations Crowdingout of private investment Increases interest rates Reduces amount of funding for private investment Deficits redistribute income from all taxpayers to bondholders Interest payments on debt made from tax revenue Deficits impose net burden on future generations Foreign-owned debt removes capital from economy