Downloaded 111 times

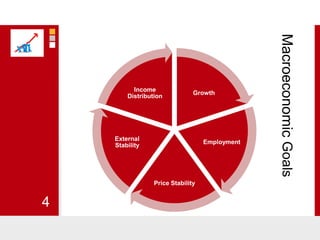


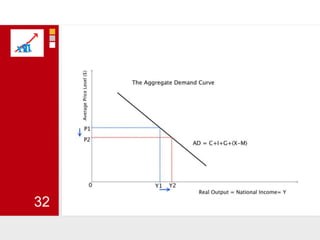
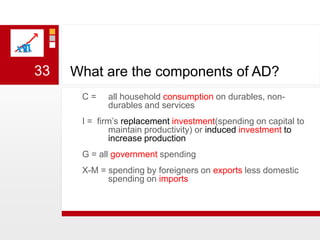
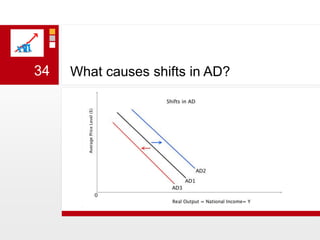
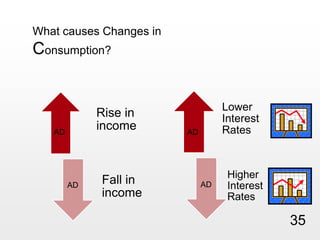


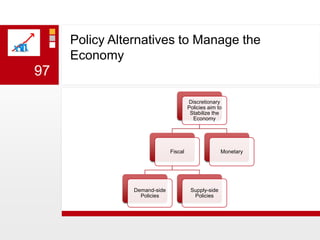
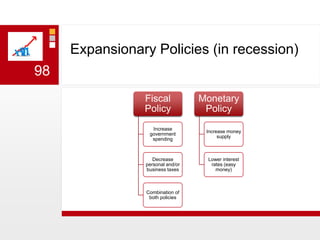
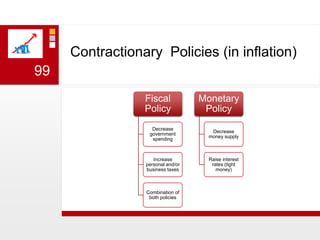
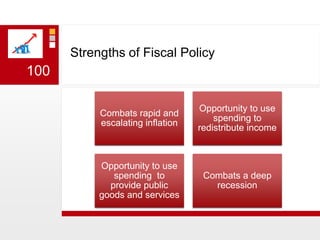


This document provides an overview of macroeconomics concepts including national income, aggregate demand and supply, the business cycle, unemployment and inflation, and income distribution. It defines key macroeconomic goals such as economic growth and price stability. It also discusses how macroeconomic equilibrium can be achieved through fiscal and monetary policy and explores supply-side policies and models including the multiplier effect, Phillips curve and NAIRU.


![MACROECONOMİC CONCEPTS FOR AP EXAMS MASSIVE_MACRO_REVIEW[1].ppt](https://cdn.slidesharecdn.com/ss_thumbnails/massivemacroreview1-240914123444-3484593f-thumbnail.jpg?width=640&height=640&fit=bounds)


![Macroeconomics presentation 2 [Autosaved].pptx](https://cdn.slidesharecdn.com/ss_thumbnails/macroeconomicspresentation2autosaved-250724160325-71fa6497-thumbnail.jpg?width=640&height=640&fit=bounds)
![Macroeconomics presentation 2 [Autosaved].pptx](https://cdn.slidesharecdn.com/ss_thumbnails/macroeconomicspresentation2autosaved-250724160812-d3d169bd-thumbnail.jpg?width=640&height=640&fit=bounds)


